
|
| Comparing the racial diversity of the journalists | ||||||||||
| at America's daily newspapers | ||||||||||
| with the communities that they serve | ||||||||||
| Newsroom diversity report for | ||||||||||
| The Daily Tribune, Royal Oak | ||||||||||
| Royal Oak, Michigan | ||||||||||
| Owner: Journal Register (N.J.) | ||||||||||
| From a report for the Knight Foundation | ||||||||||
| by Bill Dedman and Stephen K. Doig, June 2005 | ||||||||||
| Click here to read the national report or to select another newspaper | ||||||||||
| Year | Non-white % of newsroom staff | 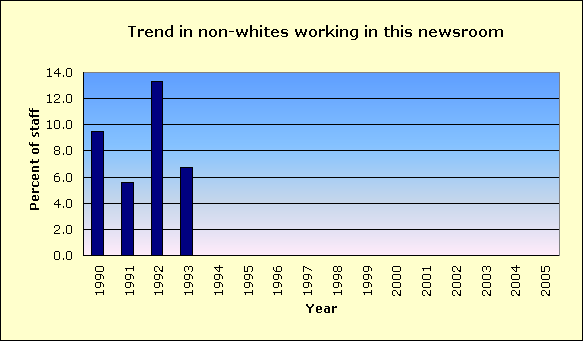
|
||||||||
| 2005 | 0.0 | |||||||||
| 2004 | 0.0 | |||||||||
| 2003 | 0.0 | |||||||||
| 2002 | 0.0 | |||||||||
| 2001 | 0.0 | |||||||||
| 2000 | 0.0 | |||||||||
| 1999 | 0.0 | |||||||||
| 1998 | 0.0 | |||||||||
| 1997 | 0.0 | |||||||||
| 1996 | Did not report | |||||||||
| 1995 | 0.0 | |||||||||
| 1994 | Did not report | |||||||||
| 1993 | 6.7 | |||||||||
| 1992 | 13.3 | |||||||||
| 1991 | 5.6 | |||||||||
| 1990 | 9.5 | |||||||||
| The latest year at peak is | 1992 | |||||||||
| See the notes and definitions section below for the sources of these figures. | ||||||||||
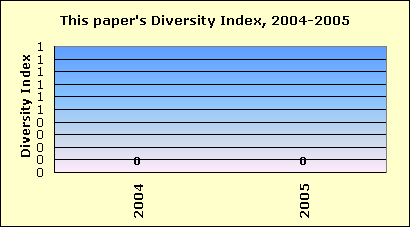
| Newsroom Diversity Index | ||||||||||
| for The Daily Tribune, Royal Oak | ||||||||||
 |
||||||||||
| Year | Non-white % of newsroom staff | Non-white % of circulation area | Newsroom Diversity Index (parity=100) | |||||||
| 2005 | 0.0 | 9.3 | 0 | |||||||
| 2004 | 0.0 | 9.3 | 0 | |||||||
| How the index is calculated | ||||||||||
| The Newsroom Diversity Index is the non-white percentage of the newsroom staff | ||||||||||
| divided by the non-white percentage of residents in the circulation area. | ||||||||||
| (Parity = 100.) | ||||||||||
| Company index | ||||||||||
| This newspaper's owner, Journal Register (N.J.), | ||||||||||
| has a companywide, circulation-weighted Diversity Index of 24. | ||||||||||
| See the notes and definitions section below for the sources of these figures. | ||||||||||
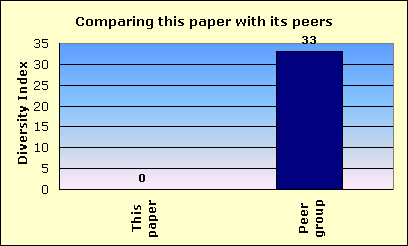
| Peer group comparison | ||||||||||
| for The Daily Tribune, Royal Oak | ||||||||||
 |
||||||||||
| This newspaper's Newsroom Diversity Index is 0. | This paper | |||||||||
| Peer group | ||||||||||
| Compare that with 33, which is the median Diversity Index for all newspapers | ||||||||||
| reporting in this circulation category of 10,001 to 25,000 daily sales. | ||||||||||
| In that group, this newspaper's Diversity Index ranks 159 out of 259 | ||||||||||
| newspapers reporting in the category of 10,001 to 25,000 daily sales. | ||||||||||
| An example of a newspaper of similar circulation, in an area of similar level of non-white residents, but one that has a relatively high Diversity Index, is The Herald, Sharon, Pennsylvania, with a 8 percent non-white staff in a community that is 7.3 percent non-white. Its index is 110. | ||||||||||
| FYI, in circulation, this newspaper's average weekday circulation of | ||||||||||
| approximately 11,989 ranks 707 out of 1,410 daily newspapers in the US. | ||||||||||
| See the notes and definitions section below for the sources of these figures. | ||||||||||
| Details on race/ethnicity | ||||||||||
| in the circulation area | ||||||||||
| and the home county | ||||||||||
| of The Daily Tribune, Royal Oak | ||||||||||
| Circulation area | ||||||||||
| Race/ethnicity | % of population | Number of residents | 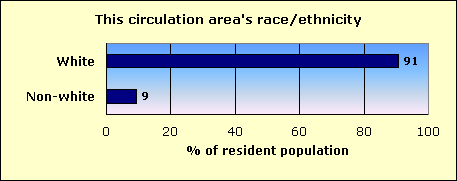
|
|||||||
| Hispanic | 1.5 | 2,496 | ||||||||
| Black | 3.3 | 5,435 | ||||||||
| Asian and Pacific Islander | 2.1 | 3,511 | ||||||||
| Native-American | 0.4 | 622 | ||||||||
| Other non-white | 0.2 | 257 | ||||||||
| Multi-racial | 1.9 | 3,122 | ||||||||
| Non-white | 9.3 | 15,443 | ||||||||
| White | 90.7 | 150,429 | ||||||||
| Total | 165,872 | |||||||||
| Home county: Oakland | ||||||||||
| Race/ethnicity | % of population | Number of residents | 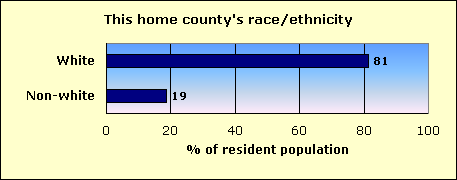
|
|||||||
| Hispanic | 2.4 | 28,999 | ||||||||
| Black | 10.0 | 119,708 | ||||||||
| Asian and Pacific Islander | 4.1 | 49,470 | ||||||||
| Native-American | 0.2 | 2,854 | ||||||||
| Other non-white | 0.1 | 1,681 | ||||||||
| Multi-racial | 1.7 | 19,692 | ||||||||
| Non-white | 18.6 | 222,404 | ||||||||
| White | 81.4 | 971,752 | ||||||||
| Total | 1,194,156 | |||||||||
| The home county of this newspaper is Oakland. | ||||||||||
| About this report | ||||||||||
| This third annual report for the Knight Foundation adds context to an annual survey by the American Society of Newspaper Editors. ASNE has set a goal that | ||||||||||
| every newspaper, to help it know its community and gather the news, should employ at least one non-white journalist, and that newspapers should strive to | ||||||||||
| employ non-whites in proportion to their share of the community. ASNE's report, at www.asne.org, shows each newspaper's non-white employment, but does | ||||||||||
| not disclose how closely that employment mirrors the newspaper's circulation area. | ||||||||||
| That gap is filled by the report you are reading now. This report was not done by ASNE, but was done for the Knight Foundation by Bill Dedman and | ||||||||||
| Stephen K. Doig. It shows how close each newspaper is to ASNE's goal, by comparing the newsroom staffing with the circulation area population. | ||||||||||
| The full report is at www.powerreporting.com/knight. | ||||||||||
| Notes and definitions | ||||||||||
| 1. The Newsroom Diversity Index is the non-white percentage of the newsroom staff divided by the non-white percentage of the circulation area's residents. Parity = 100. | ||||||||||
| 2. Source for staffing: Survey by American Society of Newspaper Editors, April 2005. Newspapers report non-white staff as of the end of the previous year. | ||||||||||
| 3. Following ASNE's definition, newsroom staff includes only supervisors, reporters, editors, copy/layout editors and photographers. | ||||||||||
| 4. Also following ASNE's definition, "whites," "blacks," etc., exclude Hispanics, who are counted in a separate category. | ||||||||||
| 5. Source for boundaries of this newspaper's circulation area: ZIP Code circulation data, Audit Bureau of Circulations, latest available. | ||||||||||
| 6. A paper may define its circulation area differently for marketing efforts, or news coverage, or to set advertising rates. | ||||||||||
| 7. If ZIP Codes or counties are used, this report applies a threshold: 10 percent household penetration is required to include an area in the circulation area. | ||||||||||
| 8. Source for the demographics of residents of that circulation area: US Census 2000. | ||||||||||
| 9. Source for total circulation: Editor & Publisher magazine, Monday-Friday average at year-end 2004. | ||||||||||
| 10. Staff of non-English publications, such as the Miami Herald's El Nuevo Herald, are excluded from the ASNE staffing survey for the first time this year. | ||||||||||
| Demographics of ZIP Codes | ||||||||||
| where sales were reported by | ||||||||||
| The Daily Tribune, Royal Oak | ||||||||||
| Note that some ZIP Codes listed here may not have been included in determining the newspaper's circulation area. In calculating the Diversity Index, a | ||||||||||
| ZIP Code was included only if the household penetration was at least 10 percent. Any lower-penetration ZIP Codes are also listed here for your information. | ||||||||||
| Also, if the newspaper reported more than 300 ZIP Codes, only the top 300 in weekday sales are listed here. | ||||||||||
| ZIP / City / State / Approx. distance in miles from the newspaper's home office | Weekday sales | Households | Penetration % (daily sales per 100 households) | Median household income | Non-white % of population |
Hispanic % of population |
Black % of population |
Native % of population |
Asian % of population |
|
| 48073 / Royal Oak / MI / 2.1 mi. | 2,664 | 16,625 | 16.0 | $52,384 | 6.6 | 1.2 | 1.8 | 0.2 | 2.0 | |
| 48067 / Royal Oak / MI / 0 mi. | 2,153 | 12,185 | 17.7 | $52,122 | 5.4 | 1.5 | 1.1 | 0.3 | 1.1 | |
| 48071 / Madison Heights / MI / 1.8 mi. | 2,015 | 13,299 | 15.2 | $42,326 | 11.5 | 1.6 | 1.8 | 0.4 | 5.0 | |
| 48030 / Hazel Park / MI / 2.9 mi. | 1,573 | 7,244 | 21.7 | $36,987 | 9.6 | 2.1 | 1.6 | 0.8 | 1.8 | |
| 48220 / Royal Oak Township / MI / 2 mi. | 1,304 | 11,010 | 11.8 | $43,698 | 19.7 | 1.7 | 13.7 | 0.5 | 1.2 | |
| 48072 / Berkley / MI / 2.2 mi. | 1,190 | 6,678 | 17.8 | $57,620 | 4.8 | 1.3 | 0.7 | 0.2 | 1.0 | |
| 48017 / Clawson / MI / 3 mi. | 1,039 | 5,661 | 18.4 | $50,822 | 4.7 | 1.1 | 0.8 | 0.3 | 1.3 | |
| 48237 / Oak Park / MI / 2.5 mi. | 514 | 12,598 | 4.1 | $45,018 | 53.6 | 1.3 | 45.6 | 0.2 | 2.2 | |
| 48098 / Troy / MI / 7.3 mi. | 421 | 14,884 | 2.8 | $98,134 | 17.6 | 1.2 | 1.9 | 0.1 | 12.8 | |
| 48069 / Pleasant Ridge / MI / 1.2 mi. | 231 | 1,029 | 22.4 | $81,108 | 4.5 | 1.8 | 0.8 | 0.3 | 1.0 | |
| 48070 / Huntington Woods / MI / 1.4 mi. | 230 | 2,382 | 9.7 | $87,507 | 3.8 | 0.9 | 0.7 | 0.1 | 1.4 | |
| 48083 / Troy / MI / 4.6 mi. | 222 | 8,969 | 2.5 | $60,943 | 19.8 | 1.8 | 2.1 | 0.2 | 13.4 | |
| 48310 / Sterling Heights / MI / 6 mi. | 139 | 14,653 | 0.9 | $61,047 | 14.4 | 1.2 | 1.2 | 0.2 | 7.6 | |
| 48084 / Troy / MI / 4.6 mi. | 54 | 6,165 | 0.9 | $67,964 | 20.6 | 1.8 | 2.5 | 0.1 | 14.4 | |
| File | mi_the_daily_tribune__royal_oak | |||||||||
| Time | 5/21/05 8:15 PM | |||||||||
| Page | 706 | |||||||||
| Member | 122600 | |||||||||