
|
| Comparing the racial diversity of the journalists | ||||||||||
| at America's daily newspapers | ||||||||||
| with the communities that they serve | ||||||||||
| Newsroom diversity report for | ||||||||||
| Clarksburg Exponent Telegram | ||||||||||
| Clarksburg, West Virginia | ||||||||||
| From a report for the Knight Foundation | ||||||||||
| by Bill Dedman and Stephen K. Doig, June 2005 | ||||||||||
| Click here to read the national report or to select another newspaper | ||||||||||
| Year | Non-white % of newsroom staff | |||||||||
| 2005 | Did not report | |||||||||
| 2004 | Did not report | |||||||||
| 2003 | Did not report | |||||||||
| 2002 | Did not report | |||||||||
| 2001 | Did not report | |||||||||
| 2000 | Did not report | |||||||||
| 1999 | Did not report | |||||||||
| 1998 | 0.0 | |||||||||
| 1997 | 0.0 | |||||||||
| 1996 | Did not report | |||||||||
| 1995 | 0.0 | |||||||||
| 1994 | Did not report | |||||||||
| 1993 | Did not report | |||||||||
| 1992 | 0.0 | |||||||||
| 1991 | Did not report | |||||||||
| 1990 | Did not report | |||||||||
| The latest year at peak is | 1998 | |||||||||
| See the notes and definitions section below for the sources of these figures. | ||||||||||
| Newsroom Diversity Index | ||||||||||
| for Clarksburg Exponent Telegram | ||||||||||
| Year | Non-white % of newsroom staff | Non-white % of circulation area | Newsroom Diversity Index (parity=100) | |||||||
| 2005 | N/A | 3.6 | N/A | |||||||
| 2004 | N/A | 3.6 | N/A | |||||||
| How the index is calculated | ||||||||||
| The Newsroom Diversity Index is the non-white percentage of the newsroom staff | ||||||||||
| divided by the non-white percentage of residents in the circulation area. | ||||||||||
| (Parity = 100.) | ||||||||||
| See the notes and definitions section below for the sources of these figures. | ||||||||||
| Peer group comparison | ||||||||||
| for Clarksburg Exponent Telegram | ||||||||||
| This paper | ||||||||||
| Peer group | ||||||||||
| The median Diversity Index is 33 for all newspapers | ||||||||||
| reporting in this circulation category of 10,001 to 25,000 daily sales. | ||||||||||
| An example of a newspaper of similar circulation, in an area of similar level of non-white residents, but one that has a relatively high Diversity Index, is Clinton Herald, Iowa, with a 10 percent non-white staff in a community that is 4.4 percent non-white. Its index is 226. | ||||||||||
| FYI, in circulation, this newspaper's average weekday circulation of | ||||||||||
| approximately 15,862 ranks 589 out of 1,410 daily newspapers in the US. | ||||||||||
| See the notes and definitions section below for the sources of these figures. | ||||||||||
| Details on race/ethnicity | ||||||||||
| in the circulation area | ||||||||||
| and the home county | ||||||||||
| of Clarksburg Exponent Telegram | ||||||||||
| Circulation area | ||||||||||
| Race/ethnicity | % of population | Number of residents | 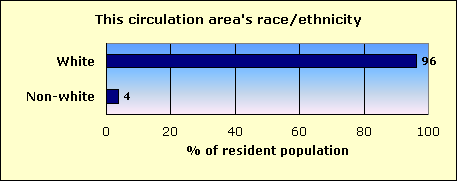
|
|||||||
| Hispanic | 0.8 | 820 | ||||||||
| Black | 1.2 | 1,215 | ||||||||
| Asian and Pacific Islander | 0.5 | 512 | ||||||||
| Native-American | 0.2 | 228 | ||||||||
| Other non-white | 0.1 | 86 | ||||||||
| Multi-racial | 0.8 | 784 | ||||||||
| Non-white | 3.6 | 3,645 | ||||||||
| White | 96.4 | 97,908 | ||||||||
| Total | 101,553 | |||||||||
| Home county: Harrison | ||||||||||
| Race/ethnicity | % of population | Number of residents | 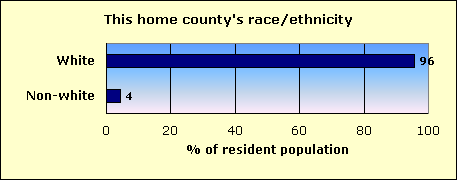
|
|||||||
| Hispanic | 1.0 | 660 | ||||||||
| Black | 1.6 | 1,102 | ||||||||
| Asian and Pacific Islander | 0.6 | 423 | ||||||||
| Native-American | 0.2 | 100 | ||||||||
| Other non-white | 0.1 | 76 | ||||||||
| Multi-racial | 0.8 | 535 | ||||||||
| Non-white | 4.2 | 2,896 | ||||||||
| White | 95.8 | 65,756 | ||||||||
| Total | 68,652 | |||||||||
| The home county of this newspaper is Harrison. | ||||||||||
| About this report | ||||||||||
| This third annual report for the Knight Foundation adds context to an annual survey by the American Society of Newspaper Editors. ASNE has set a goal that | ||||||||||
| every newspaper, to help it know its community and gather the news, should employ at least one non-white journalist, and that newspapers should strive to | ||||||||||
| employ non-whites in proportion to their share of the community. ASNE's report, at www.asne.org, shows each newspaper's non-white employment, but does | ||||||||||
| not disclose how closely that employment mirrors the newspaper's circulation area. | ||||||||||
| That gap is filled by the report you are reading now. This report was not done by ASNE, but was done for the Knight Foundation by Bill Dedman and | ||||||||||
| Stephen K. Doig. It shows how close each newspaper is to ASNE's goal, by comparing the newsroom staffing with the circulation area population. | ||||||||||
| The full report is at www.powerreporting.com/knight. | ||||||||||
| Notes and definitions | ||||||||||
| 1. The Newsroom Diversity Index is the non-white percentage of the newsroom staff divided by the non-white percentage of the circulation area's residents. Parity = 100. | ||||||||||
| 2. Source for staffing: Survey by American Society of Newspaper Editors, April 2005. Newspapers report non-white staff as of the end of the previous year. | ||||||||||
| 3. Following ASNE's definition, newsroom staff includes only supervisors, reporters, editors, copy/layout editors and photographers. | ||||||||||
| 4. Also following ASNE's definition, "whites," "blacks," etc., exclude Hispanics, who are counted in a separate category. | ||||||||||
| 5. Source for boundaries of this newspaper's circulation area: ZIP Code circulation data, Audit Bureau of Circulations, latest available. | ||||||||||
| 6. A paper may define its circulation area differently for marketing efforts, or news coverage, or to set advertising rates. | ||||||||||
| 7. If ZIP Codes or counties are used, this report applies a threshold: 10 percent household penetration is required to include an area in the circulation area. | ||||||||||
| 8. Source for the demographics of residents of that circulation area: US Census 2000. | ||||||||||
| 9. Source for total circulation: Editor & Publisher magazine, Monday-Friday average at year-end 2004. | ||||||||||
| 10. Staff of non-English publications, such as the Miami Herald's El Nuevo Herald, are excluded from the ASNE staffing survey for the first time this year. | ||||||||||
| Demographics of ZIP Codes | ||||||||||
| where sales were reported by | ||||||||||
| Clarksburg Exponent Telegram | ||||||||||
| Note that some ZIP Codes listed here may not have been included in determining the newspaper's circulation area. In calculating the Diversity Index, a | ||||||||||
| ZIP Code was included only if the household penetration was at least 10 percent. Any lower-penetration ZIP Codes are also listed here for your information. | ||||||||||
| Also, if the newspaper reported more than 300 ZIP Codes, only the top 300 in weekday sales are listed here. | ||||||||||
| ZIP / City / State / Approx. distance in miles from the newspaper's home office | Weekday sales | Households | Penetration % (daily sales per 100 households) | Median household income | Non-white % of population |
Hispanic % of population |
Black % of population |
Native % of population |
Asian % of population |
|
| 26301 / Stonewood / WV / 0 mi. | 5,859 | 13,361 | 43.9 | $27,182 | 5.2 | 0.9 | 2.6 | 0.2 | 0.4 | |
| 26330 / Bridgeport / WV / 4.3 mi. | 2,503 | 5,025 | 49.8 | $44,566 | 3.6 | 1.2 | 1.0 | 0.1 | 0.7 | |
| 26452 / Weston / WV / 16.3 mi. | 865 | 4,409 | 19.6 | $26,738 | 2.0 | 0.5 | 0.2 | 0.2 | 0.4 | |
| 26426 / Wolf Summit / WV / 11.1 mi. | 790 | 2,141 | 36.9 | $25,420 | 7.0 | 0.9 | 1.5 | 0.3 | 3.4 | |
| 26431 / Shinnston / WV / 7.7 mi. | 725 | 2,500 | 29.0 | $28,051 | 2.2 | 0.8 | 0.5 | 0.3 | 0.1 | |
| 26201 / Tennerton / WV / 19.8 mi. | 477 | 7,345 | 6.5 | $28,405 | 2.5 | 0.6 | 0.7 | 0.2 | 0.3 | |
| 26416 / Philippi / WV / 16.9 mi. | 401 | 2,747 | 14.6 | $26,687 | 4.0 | 0.5 | 0.8 | 1.0 | 0.4 | |
| 26408 / Mount Clare / WV / 6 mi. | 384 | 945 | 40.6 | $39,375 | 2.9 | 1.3 | 0.5 | 0.2 | 0.3 | |
| 26378 / Jane Lew / WV / 11.3 mi. | 378 | 1,456 | 26.0 | $33,348 | 1.3 | 0.4 | 0.0 | 0.1 | 0.0 | |
| 26385 / McWhorter / WV / 7.8 mi. | 370 | 1,430 | 25.9 | $33,559 | 1.2 | 0.6 | 0.1 | 0.1 | 0.1 | |
| 26456 / West Union / WV / 21.7 mi. | 332 | 1,625 | 20.4 | $25,465 | 1.8 | 0.6 | 0.1 | 0.2 | 0.1 | |
| 26354 / Grafton / WV / 16.3 mi. | 303 | 4,264 | 7.1 | $26,145 | 2.2 | 0.5 | 0.9 | 0.2 | 0.1 | |
| 26386 / Lumberport / WV / 6.7 mi. | 246 | 913 | 26.9 | $31,397 | 1.1 | 0.5 | 0.2 | 0.2 | 0.0 | |
| 26554 / White Hall / WV / 16 mi. | 222 | 17,379 | 1.3 | $29,200 | 6.6 | 0.7 | 4.0 | 0.2 | 0.6 | |
| 26332 / Bristol / WV / 8.9 mi. | 115 | 556 | 20.7 | $41,219 | 1.8 | 0.6 | 0.1 | 0.0 | 0.2 | |
| 26347 / Wendel / WV / 10.7 mi. | 111 | 780 | 14.2 | $24,632 | 2.0 | 0.7 | 0.3 | 0.3 | 0.2 | |
| 26241 / Elkins / WV / 33.3 mi. | 101 | 5,878 | 1.7 | $29,487 | 2.9 | 0.8 | 0.7 | 0.2 | 0.6 | |
| 26323 / Anmoore / WV / 2.8 mi. | 100 | 221 | 45.2 | $25,313 | 5.5 | 2.6 | 1.2 | 0.2 | 1.0 | |
| 26351 / Glenville / WV / 33 mi. | 94 | 1,303 | 7.2 | $23,953 | 4.8 | 0.9 | 1.6 | 0.2 | 1.1 | |
| 26448 / Wallace / WV / 11.3 mi. | 94 | 509 | 18.5 | $22,941 | 2.7 | 0.9 | 0.2 | 0.1 | 0.0 | |
| 26451 / West Milford / WV / 5.8 mi. | 80 | 275 | 29.1 | $34,432 | 2.6 | 2.4 | 0.1 | 0.0 | 0.0 | |
| 26505 / Star City / WV / 30.2 mi. | 72 | 13,687 | 0.5 | $20,440 | 12.0 | 1.4 | 3.8 | 0.1 | 4.9 | |
| 26415 / Toll Gate / WV / 31.4 mi. | 58 | 1,115 | 5.2 | $30,614 | 1.6 | 0.4 | 0.1 | 0.4 | 0.1 | |
| 26369 / Hepzibah / WV / 3.6 mi. | 57 | 208 | 27.4 | $21,823 | 4.0 | 0.8 | 2.1 | 0.8 | 0.0 | |
| 26447 / Walkersville / WV / 28.8 mi. | 53 | 303 | 17.5 | $26,000 | 1.8 | 0.0 | 0.1 | 0.0 | 0.3 | |
| 26422 / Reynoldsville / WV / 4.9 mi. | 51 | 253 | 20.2 | $24,259 | 2.5 | 0.2 | 0.9 | 0.2 | 0.0 | |
| 26238 / Volga / WV / 17.3 mi. | 49 | 335 | 14.6 | $21,250 | 0.7 | 0.0 | 0.4 | 0.4 | 0.0 | |
| 26568 / Enterprise / WV / 9.8 mi. | 43 | 225 | 19.1 | $27,277 | 1.3 | 1.1 | 0.0 | 0.0 | 0.0 | |
| 26438 / Spelter / WV / 4.7 mi. | 39 | 13 | 300.0 | $12,708 | 8.3 | 8.3 | 0.0 | 0.0 | 0.0 | |
| 26250 / Belington / WV / 25.7 mi. | 34 | 1,789 | 1.9 | $22,648 | 1.7 | 0.4 | 0.2 | 0.1 | 0.2 | |
| 26621 / Flatwoods / WV / 37.3 mi. | 34 | 367 | 9.3 | $29,135 | 1.2 | 0.0 | 0.2 | 0.0 | 0.3 | |
| 26335 / Gem / WV / 40.6 mi. | 31 | 518 | 6.0 | $28,056 | 1.1 | 0.6 | 0.2 | 0.2 | 0.1 | |
| 26372 / Horner / WV / 20.5 mi. | 31 | 237 | 13.1 | $26,964 | 1.3 | 0.8 | 0.0 | 0.2 | 0.0 | |
| 26260 / Davis / WV / 44.4 mi. | 30 | 485 | 6.2 | $28,438 | 2.2 | 0.5 | 0.1 | 0.1 | 0.0 | |
| 26591 / Worthington / WV / 11.7 mi. | 30 | 607 | 4.9 | $23,100 | 1.7 | 0.8 | 0.6 | 0.0 | 0.1 | |
| 26404 / Meadowbrook / WV / 4.7 mi. | 28 | 280 | 10.0 | $25,428 | 4.5 | 2.5 | 0.5 | 0.1 | 0.1 | |
| 26338 / Camden / WV / 17.8 mi. | 25 | 210 | 11.9 | $22,083 | 1.7 | 0.2 | 0.2 | 0.4 | 0.0 | |
| 26601 / Sutton / WV / 42.7 mi. | 24 | 1,984 | 1.2 | $23,867 | 3.5 | 0.4 | 1.5 | 0.6 | 0.1 | |
| 26287 / Saint George / WV / 34.9 mi. | 23 | 1,385 | 1.7 | $27,060 | 1.1 | 0.3 | 0.1 | 0.2 | 0.0 | |
| 26361 / Gypsy / WV / 6.1 mi. | 22 | 87 | 25.3 | $27,857 | 3.8 | 3.0 | 0.0 | 0.0 | 0.0 | |
| 26435 / Simpson / WV / 13.5 mi. | 22 | 31 | 71.0 | $33,750 | 2.7 | 0.0 | 0.0 | 0.0 | 0.0 | |
| 26218 / French Creek / WV / 28.6 mi. | 21 | 938 | 2.2 | $24,801 | 1.5 | 0.4 | 0.1 | 0.1 | 0.4 | |
| 26348 / Folsom / WV / 15.6 mi. | 19 | 83 | 22.9 | $28,333 | 1.8 | 0.0 | 0.0 | 0.0 | 0.0 | |
| 26424 / Rosemont / WV / 8.9 mi. | 19 | 36 | 52.8 | $30,536 | 5.1 | 3.1 | 1.0 | 0.0 | 0.0 | |
| 26624 / Gassaway / WV / 43.9 mi. | 19 | 1,255 | 1.5 | $24,651 | 1.4 | 0.5 | 0.2 | 0.2 | 0.1 | |
| 26321 / Vadis / WV / 13.7 mi. | 18 | 196 | 9.2 | $27,667 | 1.0 | 0.2 | 0.0 | 0.4 | 0.2 | |
| 26339 / Center Point / WV / 16.8 mi. | 18 | 98 | 18.4 | $29,444 | 1.3 | 1.3 | 0.0 | 0.0 | 0.0 | |
| 26405 / Moatsville / WV / 21.8 mi. | 17 | 464 | 3.7 | $25,295 | 4.8 | 0.8 | 0.2 | 2.3 | 0.2 | |
| File | wv_clarksburg_exponent_telegram | |||||||||
| Time | 5/19/05 9:19 PM | |||||||||
| Page | 588 | |||||||||
| Member | 149650 | |||||||||