
|
| Comparing the racial diversity of the journalists | ||||||||||
| at America's daily newspapers | ||||||||||
| with the communities that they serve | ||||||||||
| Newsroom diversity report for | ||||||||||
| Wisconsin State Journal, Madison | ||||||||||
| Madison, Wisconsin | ||||||||||
| Owner: Lee Enterprises (Iowa) | ||||||||||
| From a report for the Knight Foundation | ||||||||||
| by Bill Dedman and Stephen K. Doig, June 2005 | ||||||||||
| Click here to read the national report or to select another newspaper | ||||||||||
| Year | Non-white % of newsroom staff | 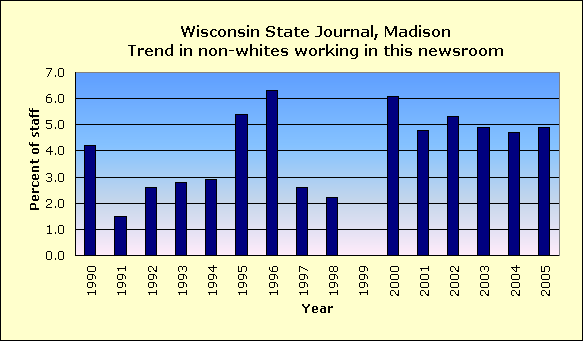
|
||||||||
| 2005 | 4.9 | |||||||||
| 2004 | 4.7 | |||||||||
| 2003 | 4.9 | |||||||||
| 2002 | 5.3 | |||||||||
| 2001 | 4.8 | |||||||||
| 2000 | 6.1 | |||||||||
| 1999 | Did not report | |||||||||
| 1998 | 2.2 | |||||||||
| 1997 | 2.6 | |||||||||
| 1996 | 6.3 | |||||||||
| 1995 | 5.4 | |||||||||
| 1994 | 2.9 | |||||||||
| 1993 | 2.8 | |||||||||
| 1992 | 2.6 | |||||||||
| 1991 | 1.5 | |||||||||
| 1990 | 4.2 | |||||||||
| The latest year at peak is | 1996 | |||||||||
| See the notes and definitions section below for the sources of these figures. | ||||||||||
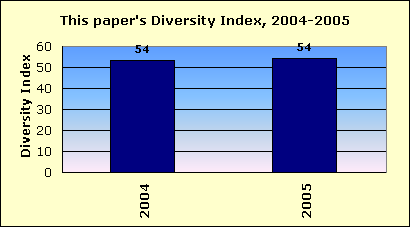
| Newsroom Diversity Index | ||||||||||
| for Wisconsin State Journal, Madison | ||||||||||
 |
||||||||||
| Year | Non-white % of newsroom staff | Non-white % of circulation area | Newsroom Diversity Index (parity=100) | |||||||
| 2005 | 4.9 | 9.0 | 54 | |||||||
| 2004 | 4.7 | 8.8 | 54 | |||||||
| How the index is calculated | ||||||||||
| The Newsroom Diversity Index is the non-white percentage of the newsroom staff | ||||||||||
| divided by the non-white percentage of residents in the circulation area. | ||||||||||
| (Parity = 100.) | ||||||||||
| Company index | ||||||||||
| This newspaper's owner, Lee Enterprises (Iowa), | ||||||||||
| has a companywide, circulation-weighted Diversity Index of 47. | ||||||||||
| See the notes and definitions section below for the sources of these figures. | ||||||||||
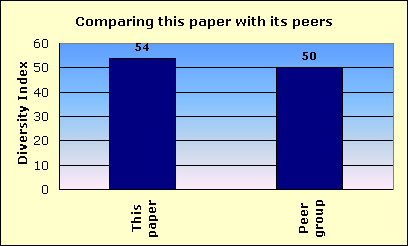
| Peer group comparison | ||||||||||
| for Wisconsin State Journal, Madison | ||||||||||
 |
||||||||||
| This newspaper's Newsroom Diversity Index is 54. | This paper | |||||||||
| Peer group | ||||||||||
| Compare that with 50, which is the median Diversity Index for all newspapers | ||||||||||
| reporting in this circulation category of 50,001 to 100,000 daily sales. | ||||||||||
| In that group, this newspaper's Diversity Index ranks 40 out of 90 | ||||||||||
| newspapers reporting in the category of 50,001 to 100,000 daily sales. | ||||||||||
| An example of a newspaper of similar circulation, in an area of similar level of non-white residents, but one that has a relatively high Diversity Index, is Lincoln Journal Star, Nebraska, with a 9.9 percent non-white staff in a community that is 8.3 percent non-white. Its index is 119. | ||||||||||
| FYI, in circulation, this newspaper's average weekday circulation of | ||||||||||
| approximately 90,741 ranks 116 out of 1,410 daily newspapers in the US. | ||||||||||
| See the notes and definitions section below for the sources of these figures. | ||||||||||
| Details on race/ethnicity | ||||||||||
| in the circulation area | ||||||||||
| and the home county | ||||||||||
| of Wisconsin State Journal, Madison | ||||||||||
| Circulation area | ||||||||||
| Race/ethnicity | % of population | Number of residents | 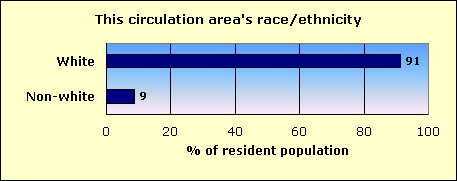
|
|||||||
| Hispanic | 2.5 | 17,965 | ||||||||
| Black | 2.5 | 18,160 | ||||||||
| Asian and Pacific Islander | 2.2 | 15,768 | ||||||||
| Native-American | 0.3 | 2,406 | ||||||||
| Other non-white | 0.1 | 612 | ||||||||
| Multi-racial | 1.1 | 7,804 | ||||||||
| Non-white | 8.8 | 62,715 | ||||||||
| White | 91.2 | 651,577 | ||||||||
| Total | 714,292 | |||||||||
| Home county: Dane | ||||||||||
| Race/ethnicity | % of population | Number of residents | 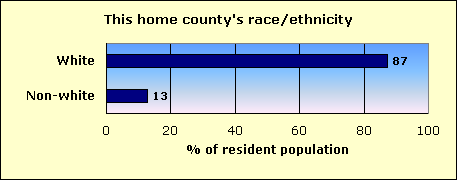
|
|||||||
| Hispanic | 3.4 | 14,387 | ||||||||
| Black | 4.0 | 16,829 | ||||||||
| Asian and Pacific Islander | 3.5 | 14,773 | ||||||||
| Native-American | 0.3 | 1,198 | ||||||||
| Other non-white | 0.1 | 510 | ||||||||
| Multi-racial | 1.5 | 6,232 | ||||||||
| Non-white | 12.6 | 53,929 | ||||||||
| White | 87.4 | 372,597 | ||||||||
| Total | 426,526 | |||||||||
| The home county of this newspaper is Dane. | ||||||||||
| About this report | ||||||||||
| This third annual report for the Knight Foundation adds context to an annual survey by the American Society of Newspaper Editors. ASNE has set a goal that | ||||||||||
| every newspaper, to help it know its community and gather the news, should employ at least one non-white journalist, and that newspapers should strive to | ||||||||||
| employ non-whites in proportion to their share of the community. ASNE's report, at www.asne.org, shows each newspaper's non-white employment, but does | ||||||||||
| not disclose how closely that employment mirrors the newspaper's circulation area. | ||||||||||
| That gap is filled by the report you are reading now. This report was not done by ASNE, but was done for the Knight Foundation by Bill Dedman and | ||||||||||
| Stephen K. Doig. It shows how close each newspaper is to ASNE's goal, by comparing the newsroom staffing with the circulation area population. | ||||||||||
| The full report is at www.powerreporting.com/knight. | ||||||||||
| Notes and definitions | ||||||||||
| 1. The Newsroom Diversity Index is the non-white percentage of the newsroom staff divided by the non-white percentage of the circulation area's residents. Parity = 100. | ||||||||||
| 2. Source for staffing: Survey by American Society of Newspaper Editors, April 2005. Newspapers report non-white staff as of the end of the previous year. | ||||||||||
| 3. Following ASNE's definition, newsroom staff includes only supervisors, reporters, editors, copy/layout editors and photographers. | ||||||||||
| 4. Also following ASNE's definition, "whites," "blacks," etc., exclude Hispanics, who are counted in a separate category. | ||||||||||
| 5. Source for boundaries of this newspaper's circulation area: ZIP Code circulation data, Audit Bureau of Circulations, latest available. | ||||||||||
| 6. A paper may define its circulation area differently for marketing efforts, or news coverage, or to set advertising rates. | ||||||||||
| 7. If ZIP Codes or counties are used, this report applies a threshold: 10 percent household penetration is required to include an area in the circulation area. | ||||||||||
| 8. Source for the demographics of residents of that circulation area: US Census 2000. | ||||||||||
| 9. Source for total circulation: Editor & Publisher magazine, Monday-Friday average at year-end 2004. | ||||||||||
| 10. Staff of non-English publications, such as the Miami Herald's El Nuevo Herald, are excluded from the ASNE staffing survey for the first time this year. | ||||||||||
| Demographics of ZIP Codes | ||||||||||
| where sales were reported by | ||||||||||
| Wisconsin State Journal, Madison | ||||||||||
| Note that some ZIP Codes listed here may not have been included in determining the newspaper's circulation area. In calculating the Diversity Index, a | ||||||||||
| ZIP Code was included only if the household penetration was at least 10 percent. Any lower-penetration ZIP Codes are also listed here for your information. | ||||||||||
| Also, if the newspaper reported more than 300 ZIP Codes, only the top 300 in weekday sales are listed here. | ||||||||||
| ZIP / City / State / Approx. distance in miles from the newspaper's home office | Weekday sales | Households | Penetration % (daily sales per 100 households) | Median household income | Non-white % of population |
Hispanic % of population |
Black % of population |
Native % of population |
Asian % of population |
|
| 53713 / Monona / WI / 5.7 mi. | 6,337 | 9,924 | 63.9 | $32,558 | 42.6 | 15.1 | 17.1 | 0.4 | 7.0 | |
| 53711 / Madison / WI / 7.5 mi. | 5,582 | 17,352 | 32.2 | $56,672 | 16.3 | 3.7 | 6.2 | 0.2 | 4.1 | |
| 53704 / Maple Bluff / WI / 1.4 mi. | 5,337 | 19,615 | 27.2 | $42,958 | 17.8 | 4.7 | 7.0 | 0.4 | 3.3 | |
| 53590 / Sun Prairie / WI / 7.3 mi. | 3,388 | 9,865 | 34.3 | $55,456 | 7.6 | 2.3 | 2.5 | 0.3 | 1.2 | |
| 53705 / Shorewood Hills / WI / 7.2 mi. | 3,287 | 13,291 | 24.7 | $45,786 | 19.2 | 3.0 | 2.0 | 0.3 | 12.0 | |
| 53562 / Middleton / WI / 9.4 mi. | 3,165 | 8,430 | 37.5 | $55,962 | 8.1 | 2.3 | 1.7 | 0.3 | 2.4 | |
| 53716 / Monona Grove / WI / 2.1 mi. | 2,864 | 8,117 | 35.3 | $52,002 | 8.0 | 2.4 | 2.6 | 0.3 | 1.2 | |
| 53719 / Madison / WI / 9.8 mi. | 2,359 | 7,996 | 29.5 | $55,006 | 16.5 | 4.3 | 4.7 | 0.3 | 5.4 | |
| 53593 / Verona / WI / 13.9 mi. | 2,242 | 4,571 | 49.0 | $69,745 | 3.0 | 0.8 | 0.6 | 0.2 | 0.7 | |
| 53597 / Westport / WI / 8.3 mi. | 2,163 | 4,831 | 44.8 | $59,742 | 2.4 | 0.8 | 0.4 | 0.1 | 0.5 | |
| 53589 / Stoughton / WI / 11.9 mi. | 2,022 | 7,377 | 27.4 | $52,787 | 3.5 | 1.1 | 0.7 | 0.2 | 0.7 | |
| 53717 / Madison / WI / 9.6 mi. | 1,939 | 4,865 | 39.9 | $59,934 | 15.5 | 3.7 | 4.0 | 0.1 | 6.0 | |
| 53714 / Monona / WI / 0.1 mi. | 1,754 | 6,983 | 25.1 | $45,980 | 13.7 | 3.4 | 5.8 | 0.3 | 2.0 | |
| 53703 / Madison / WI / 3.2 mi. | 1,632 | 12,694 | 12.9 | $20,443 | 15.3 | 3.6 | 4.6 | 0.3 | 5.0 | |
| 53575 / Oregon / WI / 11.4 mi. | 1,580 | 4,779 | 33.1 | $61,274 | 5.9 | 1.1 | 3.3 | 0.2 | 0.6 | |
| 53532 / De Forest / WI / 8.9 mi. | 1,523 | 4,079 | 37.3 | $60,308 | 4.8 | 1.8 | 1.1 | 0.3 | 0.6 | |
| 53545 / Janesville / WI / 29.2 mi. | 1,477 | 16,794 | 8.8 | $44,346 | 6.3 | 2.5 | 1.4 | 0.3 | 1.0 | |
| 53558 / McFarland / WI / 6.1 mi. | 1,269 | 3,374 | 37.6 | $66,015 | 3.6 | 1.4 | 0.3 | 0.3 | 0.8 | |
| 53965 / Wisconsin Dells / WI / 45.5 mi. | 1,228 | 3,651 | 33.6 | $39,162 | 5.9 | 1.5 | 0.5 | 2.9 | 0.3 | |
| 53566 / Monroe / WI / 35.9 mi. | 1,089 | 6,082 | 17.9 | $39,624 | 2.6 | 1.1 | 0.3 | 0.2 | 0.3 | |
| 53572 / Mount Horeb / WI / 21.1 mi. | 1,089 | 3,169 | 34.4 | $57,063 | 2.2 | 0.7 | 0.3 | 0.2 | 0.4 | |
| 53913 / West Baraboo / WI / 31.7 mi. | 1,071 | 7,259 | 14.8 | $40,857 | 4.0 | 1.5 | 0.4 | 1.1 | 0.4 | |
| 53901 / Portage / WI / 29.5 mi. | 1,033 | 5,389 | 19.2 | $40,374 | 7.1 | 2.6 | 2.6 | 0.4 | 0.6 | |
| 53718 / Madison / WI / 5.5 mi. | 1,012 | 1,493 | 67.8 | $61,948 | 6.0 | 1.6 | 1.9 | 0.4 | 1.0 | |
| 53581 / Richland Center / WI / 52.6 mi. | 1,009 | 4,141 | 24.4 | $32,334 | 2.2 | 1.0 | 0.2 | 0.2 | 0.3 | |
| 53555 / Lodi / WI / 18.8 mi. | 985 | 3,041 | 32.4 | $55,719 | 1.9 | 0.7 | 0.2 | 0.3 | 0.3 | |
| 53583 / Sauk City / WI / 22.8 mi. | 983 | 2,048 | 48.0 | $41,597 | 3.5 | 2.5 | 0.2 | 0.2 | 0.1 | |
| 53533 / Dodgeville / WI / 39.6 mi. | 963 | 2,570 | 37.5 | $42,396 | 2.1 | 0.3 | 0.3 | 0.1 | 0.5 | |
| 53959 / Reedsburg / WI / 42.8 mi. | 939 | 4,459 | 21.1 | $41,966 | 2.7 | 1.2 | 0.1 | 0.7 | 0.2 | |
| 53527 / Cottage Grove / WI / 5.7 mi. | 885 | 2,730 | 32.4 | $69,766 | 4.4 | 1.4 | 1.2 | 0.3 | 0.7 | |
| 53925 / Columbus / WI / 20.3 mi. | 855 | 2,910 | 29.4 | $47,712 | 2.5 | 1.0 | 0.5 | 0.2 | 0.2 | |
| 53715 / Madison / WI / 4.6 mi. | 845 | 4,487 | 18.8 | $24,476 | 18.4 | 3.4 | 3.8 | 0.4 | 9.0 | |
| 53818 / Platteville / WI / 60.2 mi. | 807 | 4,505 | 17.9 | $37,480 | 3.9 | 0.8 | 0.9 | 0.2 | 1.4 | |
| 53948 / Mauston / WI / 57.4 mi. | 733 | 3,114 | 23.5 | $35,396 | 3.9 | 1.5 | 0.5 | 0.4 | 0.8 | |
| 53528 / Cross Plains / WI / 15.4 mi. | 717 | 1,909 | 37.6 | $59,688 | 2.1 | 0.5 | 0.3 | 0.1 | 0.3 | |
| 53546 / Janesville / WI / 31.6 mi. | 682 | 10,676 | 6.4 | $51,908 | 5.4 | 2.4 | 1.3 | 0.2 | 0.8 | |
| 53551 / Lake Mills / WI / 18.9 mi. | 649 | 2,815 | 23.1 | $47,105 | 4.2 | 2.5 | 0.1 | 0.1 | 0.8 | |
| 53578 / Prairie du Sac / WI / 23.4 mi. | 612 | 1,939 | 31.6 | $48,811 | 3.4 | 2.1 | 0.1 | 0.1 | 0.5 | |
| 53538 / Fort Atkinson / WI / 24.9 mi. | 557 | 6,899 | 8.1 | $47,793 | 4.8 | 3.3 | 0.2 | 0.3 | 0.5 | |
| 53821 / Prairie du Chien / WI / 85.8 mi. | 547 | 3,276 | 16.7 | $35,816 | 4.5 | 0.7 | 2.6 | 0.3 | 0.3 | |
| 53523 / Cambridge / WI / 14.7 mi. | 535 | 1,858 | 28.8 | $52,259 | 2.8 | 1.3 | 0.1 | 0.2 | 0.5 | |
| 53588 / Spring Green / WI / 36.4 mi. | 530 | 1,467 | 36.1 | $46,435 | 1.3 | 0.6 | 0.1 | 0.2 | 0.1 | |
| 53565 / Mineral Point / WI / 43.8 mi. | 526 | 1,802 | 29.2 | $42,106 | 1.3 | 0.5 | 0.1 | 0.0 | 0.3 | |
| 53805 / Boscobel / WI / 64.3 mi. | 517 | 2,031 | 25.5 | $34,138 | 4.1 | 0.9 | 2.1 | 0.2 | 0.3 | |
| 53559 / Marshall / WI / 12.2 mi. | 516 | 2,008 | 25.7 | $52,895 | 6.3 | 4.3 | 0.7 | 0.4 | 0.2 | |
| 53955 / Poynette / WI / 19.6 mi. | 507 | 2,182 | 23.2 | $50,839 | 2.6 | 1.0 | 0.1 | 0.5 | 0.1 | |
| 53916 / South Beaver Dam / WI / 32.3 mi. | 472 | 8,556 | 5.5 | $41,615 | 5.6 | 3.9 | 0.2 | 0.4 | 0.5 | |
| 53536 / Evansville / WI / 21.3 mi. | 445 | 2,700 | 16.5 | $48,656 | 3.2 | 1.4 | 0.2 | 0.3 | 0.4 | |
| 53508 / Belleville / WI / 18.2 mi. | 439 | 1,561 | 28.1 | $53,854 | 1.7 | 0.5 | 0.1 | 0.1 | 0.2 | |
| 54501 / Woodboro / WI / 164.8 mi. | 430 | 8,121 | 5.3 | $36,661 | 2.6 | 0.5 | 0.3 | 0.6 | 0.4 | |
| 54481 / Whiting / WI / 92.4 mi. | 409 | 13,936 | 2.9 | $39,732 | 6.6 | 1.4 | 0.4 | 0.4 | 3.6 | |
| 53534 / Edgerton / WI / 21.3 mi. | 404 | 4,332 | 9.3 | $50,127 | 3.9 | 2.4 | 0.2 | 0.3 | 0.3 | |
| 53964 / Westfield / WI / 54.8 mi. | 399 | 1,264 | 31.6 | $32,477 | 3.8 | 2.2 | 0.3 | 0.5 | 0.1 | |
| 53530 / Darlington / WI / 45.9 mi. | 394 | 1,672 | 23.6 | $37,146 | 1.5 | 0.9 | 0.1 | 0.1 | 0.2 | |
| 53809 / Fennimore / WI / 63.1 mi. | 378 | 1,542 | 24.5 | $35,807 | 1.2 | 0.8 | 0.1 | 0.0 | 0.2 | |
| 53594 / Waterloo / WI / 16.3 mi. | 371 | 1,865 | 19.9 | $50,855 | 7.6 | 5.7 | 0.7 | 0.3 | 0.4 | |
| 53549 / Jefferson / WI / 24.7 mi. | 362 | 3,752 | 9.6 | $43,715 | 7.1 | 5.3 | 0.4 | 0.4 | 0.4 | |
| 53531 / Deerfield / WI / 10.7 mi. | 350 | 1,351 | 25.9 | $56,273 | 7.0 | 2.5 | 2.3 | 0.4 | 0.9 | |
| 53574 / New Glarus / WI / 24.1 mi. | 344 | 1,273 | 27.0 | $49,904 | 2.4 | 1.0 | 0.2 | 0.2 | 0.3 | |
| 53560 / Mazomanie / WI / 21.7 mi. | 343 | 1,340 | 25.6 | $54,837 | 3.5 | 1.7 | 0.5 | 0.3 | 0.1 | |
| 53521 / Brooklyn / WI / 15.4 mi. | 335 | 1,065 | 31.5 | $54,327 | 2.2 | 0.9 | 0.1 | 0.2 | 0.4 | |
| 53598 / Windsor / WI / 7.4 mi. | 320 | 795 | 40.3 | $56,812 | 5.0 | 1.4 | 0.6 | 0.4 | 1.4 | |
| 53813 / Lancaster / WI / 67.9 mi. | 317 | 2,411 | 13.1 | $35,833 | 1.0 | 0.4 | 0.1 | 0.0 | 0.2 | |
| 54660 / Wyeville / WI / 79.7 mi. | 317 | 5,521 | 5.7 | $38,337 | 5.2 | 1.1 | 0.7 | 2.0 | 0.5 | |
| 53573 / Muscoda / WI / 54.4 mi. | 295 | 1,295 | 22.8 | $34,091 | 1.9 | 0.9 | 0.2 | 0.4 | 0.0 | |
| 53511 / Beloit / WI / 39.1 mi. | 270 | 17,953 | 1.5 | $39,454 | 23.1 | 7.3 | 12.5 | 0.3 | 1.0 | |
| 53130 / Hales Corners / WI / 60.5 mi. | 267 | 3,170 | 8.4 | $54,046 | 4.2 | 2.1 | 0.2 | 0.5 | 1.0 | |
| 53563 / Milton / WI / 26.7 mi. | 254 | 3,522 | 7.2 | $52,320 | 2.2 | 0.8 | 0.2 | 0.2 | 0.5 | |
| 53515 / Black Earth / WI / 20.2 mi. | 243 | 803 | 30.3 | $55,052 | 3.5 | 1.2 | 0.1 | 0.2 | 0.5 | |
| 53960 / Rio / WI / 22.5 mi. | 241 | 1,195 | 20.2 | $47,150 | 2.9 | 1.4 | 0.1 | 0.3 | 0.4 | |
| 53569 / Montfort / WI / 55.1 mi. | 232 | 397 | 58.4 | $38,092 | 0.8 | 0.0 | 0.2 | 0.1 | 0.1 | |
| 53929 / Elroy / WI / 61 mi. | 226 | 1,109 | 20.4 | $36,708 | 1.8 | 0.8 | 0.4 | 0.1 | 0.1 | |
| 53954 / Pardeeville / WI / 27.8 mi. | 217 | 2,457 | 8.8 | $44,589 | 3.5 | 1.8 | 0.2 | 0.2 | 0.5 | |
| 54634 / Yuba / WI / 60 mi. | 215 | 1,401 | 15.3 | $34,309 | 1.5 | 0.6 | 0.1 | 0.1 | 0.1 | |
| 53577 / Plain / WI / 36.2 mi. | 201 | 562 | 35.8 | $42,946 | 2.1 | 1.0 | 0.1 | 0.8 | 0.0 | |
| 53529 / Dane / WI / 13.2 mi. | 196 | 613 | 32.0 | $56,250 | 3.5 | 1.4 | 0.2 | 0.1 | 1.1 | |
| 53507 / Barneveld / WI / 28.2 mi. | 195 | 724 | 26.9 | $55,039 | 1.0 | 0.1 | 0.2 | 0.2 | 0.1 | |
| 53516 / Blanchardville / WI / 34.5 mi. | 185 | 728 | 25.4 | $43,859 | 1.1 | 0.3 | 0.0 | 0.0 | 0.1 | |
| 53520 / Brodhead / WI / 31.1 mi. | 173 | 2,485 | 7.0 | $43,569 | 2.7 | 1.1 | 0.3 | 0.2 | 0.2 | |
| 54601 / Shelby / WI / 99.9 mi. | 170 | 19,209 | 0.9 | $34,771 | 7.0 | 1.1 | 1.1 | 0.4 | 3.3 | |
| 53949 / Montello / WI / 44.8 mi. | 164 | 2,460 | 6.7 | $34,422 | 13.9 | 4.1 | 6.7 | 1.9 | 0.3 | |
| 53503 / Arena / WI / 30 mi. | 158 | 661 | 23.9 | $47,750 | 1.9 | 0.8 | 0.0 | 0.0 | 0.9 | |
| 53570 / Monticello / WI / 26.2 mi. | 158 | 903 | 17.5 | $47,688 | 1.8 | 0.8 | 0.0 | 0.3 | 0.1 | |
| 53543 / Highland / WI / 49.7 mi. | 157 | 619 | 25.4 | $36,758 | 0.8 | 0.2 | 0.0 | 0.0 | 0.1 | |
| 53517 / Blue Mounds / WI / 24.7 mi. | 153 | 602 | 25.4 | $52,414 | 2.0 | 0.8 | 0.1 | 0.2 | 0.6 | |
| 53554 / Livingston / WI / 55.5 mi. | 153 | 404 | 37.9 | $36,696 | 0.5 | 0.2 | 0.0 | 0.0 | 0.0 | |
| 53556 / Lone Rock / WI / 42 mi. | 143 | 1,114 | 12.8 | $37,545 | 2.1 | 0.9 | 0.2 | 0.1 | 0.2 | |
| 53968 / Wonewoc / WI / 55.5 mi. | 140 | 956 | 14.6 | $31,827 | 2.0 | 1.0 | 0.0 | 0.2 | 0.2 | |
| 53510 / Belmont / WI / 53.5 mi. | 135 | 525 | 25.7 | $36,146 | 1.0 | 0.6 | 0.1 | 0.2 | 0.0 | |
| 53963 / Waupun / WI / 43.5 mi. | 134 | 4,206 | 3.2 | $42,745 | 14.3 | 2.7 | 10.1 | 0.8 | 0.3 | |
| 53911 / Arlington / WI / 12.4 mi. | 131 | 399 | 32.8 | $50,673 | 2.2 | 1.7 | 0.1 | 0.1 | 0.1 | |
| 53941 / La Valle / WI / 49.4 mi. | 130 | 985 | 13.2 | $42,434 | 1.9 | 1.0 | 0.3 | 0.0 | 0.1 | |
| 53950 / New Lisbon / WI / 64.1 mi. | 129 | 1,753 | 7.4 | $36,653 | 3.3 | 1.0 | 0.1 | 1.1 | 0.4 | |
| 53951 / North Freedom / WI / 33 mi. | 126 | 902 | 14.0 | $41,293 | 7.5 | 5.9 | 0.1 | 0.5 | 0.3 | |
| 53807 / Cuba City / WI / 65.1 mi. | 115 | 1,911 | 6.0 | $41,205 | 0.7 | 0.2 | 0.0 | 0.1 | 0.2 | |
| 53561 / Merrimac / WI / 24.6 mi. | 114 | 637 | 17.9 | $45,000 | 1.2 | 0.5 | 0.3 | 0.1 | 0.1 | |
| 53956 / Randolph / WI / 32 mi. | 113 | 1,220 | 9.3 | $44,333 | 2.4 | 1.7 | 0.1 | 0.1 | 0.2 | |
| 53190 / Whitewater / WI / 32.9 mi. | 108 | 5,905 | 1.8 | $37,336 | 10.0 | 6.1 | 1.7 | 0.2 | 1.2 | |
| 53502 / Albany / WI / 24.6 mi. | 105 | 852 | 12.3 | $44,621 | 1.6 | 0.8 | 0.0 | 0.1 | 0.4 | |
| 53706 / Madison / WI / 4.9 mi. | 105 | 18 | 583.3 | $11,250 | 11.8 | 2.3 | 1.6 | 0.2 | 5.8 | |
| 53094 / Watertown / WI / 28.4 mi. | 101 | 6,217 | 1.6 | $43,847 | 6.8 | 4.9 | 0.2 | 0.3 | 0.6 | |
| 53582 / Ridgeway / WI / 32.8 mi. | 101 | 439 | 23.0 | $45,250 | 1.5 | 0.1 | 0.0 | 0.2 | 0.9 | |
| 53932 / Fall River / WI / 22.3 mi. | 95 | 751 | 12.6 | $50,038 | 2.2 | 1.1 | 0.4 | 0.1 | 0.4 | |
| 53504 / Argyle / WI / 37.7 mi. | 92 | 813 | 11.3 | $40,304 | 1.8 | 0.7 | 0.3 | 0.3 | 0.1 | |
| 54452 / Schley / WI / 135.3 mi. | 91 | 7,573 | 1.2 | $41,260 | 2.2 | 0.8 | 0.2 | 0.3 | 0.4 | |
| 53098 / Watertown / WI / 28.7 mi. | 86 | 4,302 | 2.0 | $46,030 | 4.4 | 2.9 | 0.2 | 0.3 | 0.6 | |
| 53518 / Blue River / WI / 58.6 mi. | 85 | 553 | 15.4 | $34,605 | 1.0 | 0.5 | 0.2 | 0.1 | 0.1 | |
| 53804 / Bloomington / WI / 76.8 mi. | 85 | 619 | 13.7 | $34,444 | 0.6 | 0.4 | 0.0 | 0.1 | 0.0 | |
| 53944 / Lyndon Station / WI / 47.6 mi. | 81 | 773 | 10.5 | $34,784 | 9.2 | 1.5 | 0.5 | 6.1 | 0.2 | |
| 53526 / Cobb / WI / 48.9 mi. | 79 | 229 | 34.5 | $33,906 | 1.3 | 0.4 | 0.0 | 0.4 | 0.4 | |
| 53506 / Avoca / WI / 47.7 mi. | 77 | 476 | 16.2 | $32,708 | 2.1 | 0.5 | 0.3 | 0.2 | 0.8 | |
| 53544 / Hollandale / WI / 27.4 mi. | 76 | 309 | 24.6 | $43,036 | 0.6 | 0.3 | 0.1 | 0.0 | 0.0 | |
| 53923 / Cambria / WI / 30.4 mi. | 75 | 770 | 9.7 | $40,165 | 4.9 | 3.4 | 0.1 | 0.3 | 0.1 | |
| 53924 / Cazenovia / WI / 51.9 mi. | 74 | 548 | 13.5 | $38,125 | 1.7 | 0.4 | 0.1 | 0.2 | 0.2 | |
| 53806 / Cassville / WI / 80.4 mi. | 68 | 833 | 8.2 | $29,712 | 0.7 | 0.2 | 0.1 | 0.3 | 0.0 | |
| 53952 / Oxford / WI / 47.7 mi. | 64 | 1,225 | 5.2 | $37,021 | 3.3 | 1.5 | 0.4 | 0.3 | 0.7 | |
| 54631 / Gays Mills / WI / 73.9 mi. | 59 | 709 | 8.3 | $30,852 | 2.2 | 1.3 | 0.2 | 0.1 | 0.3 | |
| 53587 / South Wayne / WI / 43.2 mi. | 58 | 500 | 11.6 | $38,661 | 1.0 | 0.6 | 0.1 | 0.1 | 0.0 | |
| 53934 / Friendship / WI / 61.6 mi. | 58 | 1,809 | 3.2 | $29,934 | 3.5 | 1.5 | 0.4 | 0.6 | 0.5 | |
| 53943 / Loganville / WI / 40.5 mi. | 58 | 369 | 15.7 | $41,250 | 2.5 | 2.4 | 0.0 | 0.0 | 0.0 | |
| 53586 / Shullsburg / WI / 54.6 mi. | 56 | 852 | 6.6 | $33,934 | 0.7 | 0.0 | 0.0 | 0.2 | 0.1 | |
| 53826 / Wauzeka / WI / 72.5 mi. | 55 | 659 | 8.3 | $35,391 | 1.9 | 0.8 | 0.1 | 0.1 | 0.7 | |
| 53038 / Johnson Creek / WI / 25.4 mi. | 54 | 1,118 | 4.8 | $47,121 | 4.4 | 2.9 | 0.2 | 0.5 | 0.1 | |
| 54665 / Viroqua / WI / 79.5 mi. | 52 | 3,315 | 1.6 | $31,462 | 1.6 | 0.6 | 0.1 | 0.1 | 0.4 | |
| 53933 / Fox Lake / WI / 35.4 mi. | 49 | 1,142 | 4.3 | $40,068 | 19.6 | 3.4 | 14.7 | 0.9 | 0.2 | |
| 54638 / Kendall / WI / 68.6 mi. | 49 | 550 | 8.9 | $37,308 | 0.8 | 0.5 | 0.1 | 0.1 | 0.1 | |
| 53910 / Adams / WI / 57 mi. | 47 | 1,423 | 3.3 | $30,000 | 3.6 | 1.6 | 0.4 | 0.5 | 0.2 | |
| 54655 / Soldiers Grove / WI / 70.9 mi. | 46 | 674 | 6.8 | $30,493 | 2.1 | 0.7 | 0.1 | 0.2 | 0.2 | |
| 54618 / Cutler / WI / 69.3 mi. | 44 | 843 | 5.2 | $40,192 | 2.3 | 0.9 | 0.1 | 0.8 | 0.3 | |
| 53962 / Union Center / WI / 58.4 mi. | 43 | 17 | 252.9 | $40,000 | 2.6 | 2.6 | 0.0 | 0.0 | 0.0 | |
| 53039 / Juneau / WI / 35.1 mi. | 41 | 1,651 | 2.5 | $46,038 | 3.1 | 2.2 | 0.2 | 0.1 | 0.2 | |
| 53553 / Linden / WI / 46.9 mi. | 39 | 250 | 15.6 | $36,250 | 1.0 | 0.0 | 0.1 | 0.4 | 0.0 | |
| 53946 / Markesan / WI / 42 mi. | 36 | 1,749 | 2.1 | $41,085 | 2.0 | 1.7 | 0.0 | 0.1 | 0.1 | |
| 53541 / Gratiot / WI / 47.1 mi. | 35 | 376 | 9.3 | $41,429 | 0.9 | 0.0 | 0.8 | 0.0 | 0.0 | |
| 53937 / Hillpoint / WI / 44.2 mi. | 35 | 321 | 10.9 | $39,038 | 1.5 | 0.7 | 0.2 | 0.2 | 0.2 | |
| 54664 / Viola / WI / 67.7 mi. | 35 | 603 | 5.8 | $32,935 | 2.5 | 1.4 | 0.1 | 0.1 | 0.3 | |
| 53961 / Rock Springs / WI / 37.2 mi. | 33 | 297 | 11.1 | $50,000 | 1.4 | 0.9 | 0.1 | 0.3 | 0.1 | |
| 53930 / Endeavor / WI / 40.4 mi. | 30 | 457 | 6.6 | $45,592 | 4.8 | 2.2 | 0.6 | 0.1 | 0.5 | |
| 53936 / Grand Marsh / WI / 52.5 mi. | 29 | 597 | 4.9 | $29,471 | 4.6 | 2.2 | 0.3 | 0.6 | 0.1 | |
| 53576 / Orfordville / WI / 30.9 mi. | 27 | 805 | 3.4 | $50,117 | 2.9 | 1.5 | 0.3 | 0.1 | 0.1 | |
| 53803 / Cuba City / WI / 60.7 mi. | 27 | 472 | 5.7 | $31,250 | 1.7 | 0.0 | 0.1 | 0.1 | 1.4 | |
| 53811 / Hazel Green / WI / 67.2 mi. | 27 | 1,124 | 2.4 | $41,505 | 1.2 | 0.3 | 0.2 | 0.0 | 0.1 | |
| 53550 / Juda / WI / 39.7 mi. | 26 | 434 | 6.0 | $43,421 | 2.3 | 0.5 | 0.1 | 0.0 | 1.1 | |
| 53801 / Wyalusing / WI / 82.9 mi. | 25 | 336 | 7.4 | $29,271 | 3.2 | 1.2 | 0.0 | 0.9 | 0.1 | |
| 53926 / Dalton / WI / 36.1 mi. | 24 | 458 | 5.2 | $37,009 | 3.8 | 0.7 | 0.2 | 0.4 | 0.2 | |
| 54639 / West Lima / WI / 70 mi. | 23 | 833 | 2.8 | $29,722 | 1.8 | 0.4 | 0.1 | 0.3 | 0.2 | |
| 54646 / Necedah / WI / 70 mi. | 23 | 1,369 | 1.7 | $33,185 | 2.7 | 1.0 | 0.2 | 0.3 | 0.3 | |
| File | wi_wisconsin_state_journal__madison | |||||||||
| Time | 5/17/05 5:10 PM | |||||||||
| Page | 116 | |||||||||
| Member | 150700A | |||||||||