
|
| Comparing the racial diversity of the journalists | ||||||||||
| at America's daily newspapers | ||||||||||
| with the communities that they serve | ||||||||||
| Newsroom diversity report for | ||||||||||
| The Daily Chronicle, Centralia | ||||||||||
| Centralia, Washington | ||||||||||
| From a report for the Knight Foundation | ||||||||||
| by Bill Dedman and Stephen K. Doig, June 2005 | ||||||||||
| Click here to read the national report or to select another newspaper | ||||||||||
| Year | Non-white % of newsroom staff | 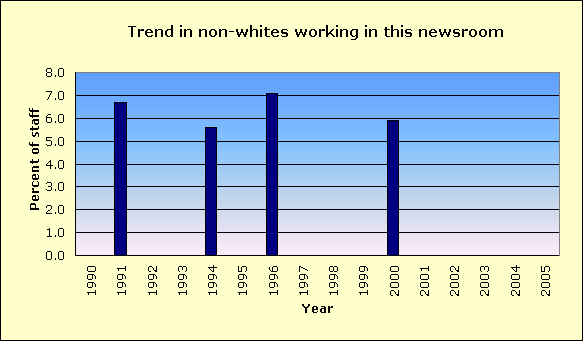
|
||||||||
| 2005 | Did not report | |||||||||
| 2004 | Did not report | |||||||||
| 2003 | Did not report | |||||||||
| 2002 | Did not report | |||||||||
| 2001 | 0.0 | |||||||||
| 2000 | 5.9 | |||||||||
| 1999 | 0.0 | |||||||||
| 1998 | 0.0 | |||||||||
| 1997 | 0.0 | |||||||||
| 1996 | 7.1 | |||||||||
| 1995 | 0.0 | |||||||||
| 1994 | 5.6 | |||||||||
| 1993 | 0.0 | |||||||||
| 1992 | 0.0 | |||||||||
| 1991 | 6.7 | |||||||||
| 1990 | 0.0 | |||||||||
| The latest year at peak is | 1996 | |||||||||
| See the notes and definitions section below for the sources of these figures. | ||||||||||
| Newsroom Diversity Index | ||||||||||
| for The Daily Chronicle, Centralia | ||||||||||
| Year | Non-white % of newsroom staff | Non-white % of circulation area | Newsroom Diversity Index (parity=100) | |||||||
| 2005 | N/A | 10.4 | N/A | |||||||
| 2004 | N/A | 10.4 | N/A | |||||||
| How the index is calculated | ||||||||||
| The Newsroom Diversity Index is the non-white percentage of the newsroom staff | ||||||||||
| divided by the non-white percentage of residents in the circulation area. | ||||||||||
| (Parity = 100.) | ||||||||||
| See the notes and definitions section below for the sources of these figures. | ||||||||||
| Peer group comparison | ||||||||||
| for The Daily Chronicle, Centralia | ||||||||||
| This paper | ||||||||||
| Peer group | ||||||||||
| The median Diversity Index is 33 for all newspapers | ||||||||||
| reporting in this circulation category of 10,001 to 25,000 daily sales. | ||||||||||
| An example of a newspaper of similar circulation, in an area of similar level of non-white residents, but one that has a relatively high Diversity Index, is The Herald, Sharon, Pennsylvania, with a 8 percent non-white staff in a community that is 7.3 percent non-white. Its index is 110. | ||||||||||
| FYI, in circulation, this newspaper's average weekday circulation of | ||||||||||
| approximately 14,060 ranks 643 out of 1,410 daily newspapers in the US. | ||||||||||
| See the notes and definitions section below for the sources of these figures. | ||||||||||
| Details on race/ethnicity | ||||||||||
| in the circulation area | ||||||||||
| and the home county | ||||||||||
| of The Daily Chronicle, Centralia | ||||||||||
| Circulation area | ||||||||||
| Race/ethnicity | % of population | Number of residents | 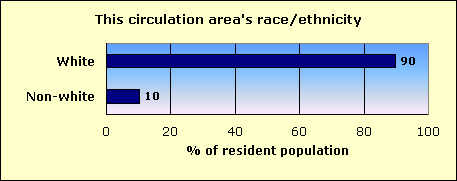
|
|||||||
| Hispanic | 5.5 | 4,865 | ||||||||
| Black | 0.4 | 373 | ||||||||
| Asian and Pacific Islander | 0.9 | 766 | ||||||||
| Native-American | 1.6 | 1,418 | ||||||||
| Other non-white | 0.1 | 111 | ||||||||
| Multi-racial | 1.8 | 1,597 | ||||||||
| Non-white | 10.4 | 9,130 | ||||||||
| White | 89.6 | 78,825 | ||||||||
| Total | 87,955 | |||||||||
| Home county: Lewis | ||||||||||
| Race/ethnicity | % of population | Number of residents | 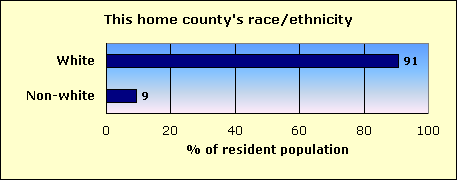
|
|||||||
| Hispanic | 5.4 | 3,684 | ||||||||
| Black | 0.4 | 239 | ||||||||
| Asian and Pacific Islander | 0.9 | 581 | ||||||||
| Native-American | 1.2 | 795 | ||||||||
| Other non-white | 0.1 | 73 | ||||||||
| Multi-racial | 1.5 | 1,054 | ||||||||
| Non-white | 9.4 | 6,426 | ||||||||
| White | 90.6 | 62,174 | ||||||||
| Total | 68,600 | |||||||||
| The home county of this newspaper is Lewis. | ||||||||||
| About this report | ||||||||||
| This third annual report for the Knight Foundation adds context to an annual survey by the American Society of Newspaper Editors. ASNE has set a goal that | ||||||||||
| every newspaper, to help it know its community and gather the news, should employ at least one non-white journalist, and that newspapers should strive to | ||||||||||
| employ non-whites in proportion to their share of the community. ASNE's report, at www.asne.org, shows each newspaper's non-white employment, but does | ||||||||||
| not disclose how closely that employment mirrors the newspaper's circulation area. | ||||||||||
| That gap is filled by the report you are reading now. This report was not done by ASNE, but was done for the Knight Foundation by Bill Dedman and | ||||||||||
| Stephen K. Doig. It shows how close each newspaper is to ASNE's goal, by comparing the newsroom staffing with the circulation area population. | ||||||||||
| The full report is at www.powerreporting.com/knight. | ||||||||||
| Notes and definitions | ||||||||||
| 1. The Newsroom Diversity Index is the non-white percentage of the newsroom staff divided by the non-white percentage of the circulation area's residents. Parity = 100. | ||||||||||
| 2. Source for staffing: Survey by American Society of Newspaper Editors, April 2005. Newspapers report non-white staff as of the end of the previous year. | ||||||||||
| 3. Following ASNE's definition, newsroom staff includes only supervisors, reporters, editors, copy/layout editors and photographers. | ||||||||||
| 4. Also following ASNE's definition, "whites," "blacks," etc., exclude Hispanics, who are counted in a separate category. | ||||||||||
| 5. Source for boundaries of this newspaper's circulation area: ZIP Code circulation data, Audit Bureau of Circulations, latest available. | ||||||||||
| 6. A paper may define its circulation area differently for marketing efforts, or news coverage, or to set advertising rates. | ||||||||||
| 7. If ZIP Codes or counties are used, this report applies a threshold: 10 percent household penetration is required to include an area in the circulation area. | ||||||||||
| 8. Source for the demographics of residents of that circulation area: US Census 2000. | ||||||||||
| 9. Source for total circulation: Editor & Publisher magazine, Monday-Friday average at year-end 2004. | ||||||||||
| 10. Staff of non-English publications, such as the Miami Herald's El Nuevo Herald, are excluded from the ASNE staffing survey for the first time this year. | ||||||||||
| Demographics of ZIP Codes | ||||||||||
| where sales were reported by | ||||||||||
| The Daily Chronicle, Centralia | ||||||||||
| Note that some ZIP Codes listed here may not have been included in determining the newspaper's circulation area. In calculating the Diversity Index, a | ||||||||||
| ZIP Code was included only if the household penetration was at least 10 percent. Any lower-penetration ZIP Codes are also listed here for your information. | ||||||||||
| Also, if the newspaper reported more than 300 ZIP Codes, only the top 300 in weekday sales are listed here. | ||||||||||
| ZIP / City / State / Approx. distance in miles from the newspaper's home office | Weekday sales | Households | Penetration % (daily sales per 100 households) | Median household income | Non-white % of population |
Hispanic % of population |
Black % of population |
Native % of population |
Asian % of population |
|
| 98531 / Waunch Prairie / WA / 0 mi. | 4,299 | 8,594 | 50.0 | $32,485 | 13.4 | 9.0 | 0.3 | 1.1 | 1.2 | |
| 98532 / Newaukum / WA / 6 mi. | 3,958 | 7,503 | 52.8 | $39,614 | 8.9 | 4.8 | 0.7 | 1.0 | 1.0 | |
| 98579 / Rochester / WA / 7.7 mi. | 887 | 3,454 | 25.7 | $41,961 | 13.1 | 6.6 | 0.9 | 1.6 | 0.9 | |
| 98596 / Winlock / WA / 14.5 mi. | 863 | 2,372 | 36.4 | $39,179 | 9.0 | 5.3 | 0.1 | 1.2 | 0.5 | |
| 98570 / Onalaska / WA / 15.2 mi. | 609 | 1,324 | 46.0 | $36,521 | 6.9 | 3.4 | 0.1 | 1.1 | 0.4 | |
| 98591 / Toledo / WA / 19.2 mi. | 427 | 1,118 | 38.2 | $37,474 | 7.0 | 3.2 | 0.3 | 1.5 | 0.3 | |
| 98564 / Mossyrock / WA / 24.3 mi. | 396 | 849 | 46.6 | $32,838 | 8.0 | 4.5 | 0.3 | 1.7 | 0.3 | |
| 98356 / Morton / WA / 31.6 mi. | 322 | 895 | 36.0 | $34,756 | 4.8 | 1.1 | 0.2 | 0.8 | 1.0 | |
| 98589 / Tenino / WA / 10.1 mi. | 260 | 2,417 | 10.8 | $46,111 | 8.7 | 3.3 | 0.5 | 1.2 | 1.3 | |
| 98377 / Randle / WA / 48.4 mi. | 247 | 842 | 29.3 | $31,116 | 5.6 | 2.3 | 0.4 | 1.1 | 0.3 | |
| 98568 / Oakville / WA / 14.8 mi. | 221 | 798 | 27.7 | $35,726 | 26.7 | 5.2 | 0.4 | 16.8 | 0.5 | |
| 98565 / Napavine / WA / 9.7 mi. | 209 | 176 | 118.8 | $40,294 | 7.8 | 4.0 | 0.2 | 1.6 | 1.0 | |
| 98572 / Peell / WA / 18.3 mi. | 171 | 327 | 52.3 | $28,472 | 6.4 | 1.7 | 0.2 | 1.7 | 1.2 | |
| 98361 / Packwood / WA / 57.4 mi. | 140 | 561 | 25.0 | $31,964 | 2.5 | 1.1 | 0.0 | 0.4 | 0.1 | |
| 98585 / Silver Creek / WA / 20.8 mi. | 120 | 233 | 51.5 | $44,375 | 5.4 | 1.8 | 0.0 | 1.1 | 0.2 | |
| 98336 / Kosmos / WA / 39.2 mi. | 109 | 471 | 23.1 | $31,875 | 5.4 | 2.1 | 0.1 | 1.5 | 0.2 | |
| 98582 / Salkum / WA / 19.4 mi. | 107 | 160 | 66.9 | $32,813 | 8.4 | 5.3 | 0.0 | 1.6 | 0.5 | |
| 98542 / Ethel / WA / 15.5 mi. | 86 | 189 | 45.5 | $32,083 | 7.0 | 3.0 | 0.2 | 1.9 | 0.4 | |
| 98533 / Cinebar / WA / 20.5 mi. | 79 | 193 | 40.9 | $24,038 | 3.9 | 0.8 | 0.0 | 1.2 | 0.2 | |
| 98538 / Wildwood / WA / 14.8 mi. | 78 | 114 | 68.4 | $40,750 | 11.2 | 8.3 | 0.0 | 1.3 | 0.0 | |
| 98593 / Vader / WA / 20.4 mi. | 72 | 380 | 18.9 | $33,750 | 9.8 | 4.8 | 0.0 | 2.1 | 0.2 | |
| 98530 / Bucoda / WA / 6.5 mi. | 49 | 190 | 25.8 | $33,571 | 7.8 | 2.0 | 0.2 | 0.9 | 1.6 | |
| 98539 / Doty / WA / 15.1 mi. | 39 | 63 | 61.9 | $29,375 | 13.6 | 2.2 | 0.0 | 3.8 | 0.0 | |
| 98501 / Union Mills / WA / 19.1 mi. | 30 | 13,827 | 0.2 | $47,230 | 13.0 | 3.8 | 1.1 | 1.1 | 3.8 | |
| 98512 / Tumwater / WA / 14.9 mi. | 28 | 9,639 | 0.3 | $50,286 | 11.3 | 2.9 | 1.4 | 1.1 | 3.0 | |
| 98581 / Ryderwood / WA / 22.5 mi. | 27 | 242 | 11.2 | $24,167 | 3.6 | 0.2 | 1.7 | 0.2 | 0.5 | |
| 98355 / Mineral / WA / 34.2 mi. | 23 | 269 | 8.6 | $29,125 | 4.7 | 1.3 | 0.3 | 1.9 | 0.3 | |
| File | wa_the_daily_chronicle__centralia | |||||||||
| Time | 5/19/05 11:12 PM | |||||||||
| Page | 642 | |||||||||
| Member | 148700 | |||||||||