
|
| Comparing the racial diversity of the journalists | ||||||||||
| at America's daily newspapers | ||||||||||
| with the communities that they serve | ||||||||||
| Newsroom diversity report for | ||||||||||
| Peninsula Daily News, Port Angeles | ||||||||||
| Port Angeles, Washington | ||||||||||
| Owner: Horvitz Newspapers (Wa.) | ||||||||||
| From a report for the Knight Foundation | ||||||||||
| by Bill Dedman and Stephen K. Doig, June 2005 | ||||||||||
| Click here to read the national report or to select another newspaper | ||||||||||
| Year | Non-white % of newsroom staff | 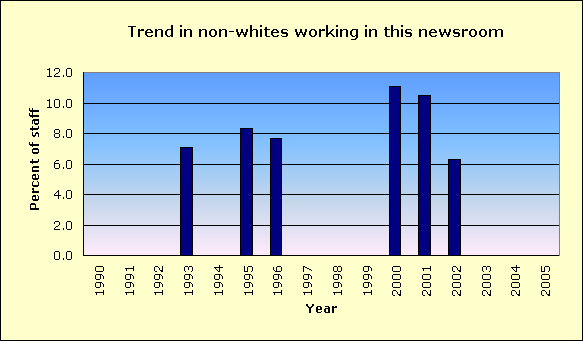
|
||||||||
| 2005 | Did not report | |||||||||
| 2004 | Did not report | |||||||||
| 2003 | 0.0 | |||||||||
| 2002 | 6.3 | |||||||||
| 2001 | 10.5 | |||||||||
| 2000 | 11.1 | |||||||||
| 1999 | Did not report | |||||||||
| 1998 | Did not report | |||||||||
| 1997 | Did not report | |||||||||
| 1996 | 7.7 | |||||||||
| 1995 | 8.3 | |||||||||
| 1994 | 0.0 | |||||||||
| 1993 | 7.1 | |||||||||
| 1992 | 0.0 | |||||||||
| 1991 | 0.0 | |||||||||
| 1990 | Did not report | |||||||||
| The latest year at peak is | 2000 | |||||||||
| See the notes and definitions section below for the sources of these figures. | ||||||||||
| Newsroom Diversity Index | ||||||||||
| for Peninsula Daily News, Port Angeles | ||||||||||
| Year | Non-white % of newsroom staff | Non-white % of circulation area | Newsroom Diversity Index (parity=100) | |||||||
| 2005 | N/A | 11.5 | N/A | |||||||
| 2004 | N/A | 11.5 | N/A | |||||||
| How the index is calculated | ||||||||||
| The Newsroom Diversity Index is the non-white percentage of the newsroom staff | ||||||||||
| divided by the non-white percentage of residents in the circulation area. | ||||||||||
| (Parity = 100.) | ||||||||||
| Company index | ||||||||||
| This newspaper's owner, Horvitz Newspapers (Wa.), | ||||||||||
| has a companywide, circulation-weighted Diversity Index of 54. | ||||||||||
| See the notes and definitions section below for the sources of these figures. | ||||||||||
| Peer group comparison | ||||||||||
| for Peninsula Daily News, Port Angeles | ||||||||||
| This paper | ||||||||||
| Peer group | ||||||||||
| The median Diversity Index is 33 for all newspapers | ||||||||||
| reporting in this circulation category of 10,001 to 25,000 daily sales. | ||||||||||
| An example of a newspaper of similar circulation, in an area of similar level of non-white residents, but one that has a relatively high Diversity Index, is The Herald, Sharon, Pennsylvania, with a 8 percent non-white staff in a community that is 7.3 percent non-white. Its index is 110. | ||||||||||
| FYI, in circulation, this newspaper's average weekday circulation of | ||||||||||
| approximately 17,167 ranks 548 out of 1,410 daily newspapers in the US. | ||||||||||
| See the notes and definitions section below for the sources of these figures. | ||||||||||
| Details on race/ethnicity | ||||||||||
| in the circulation area | ||||||||||
| and the home county | ||||||||||
| of Peninsula Daily News, Port Angeles | ||||||||||
| Circulation area | ||||||||||
| Race/ethnicity | % of population | Number of residents | 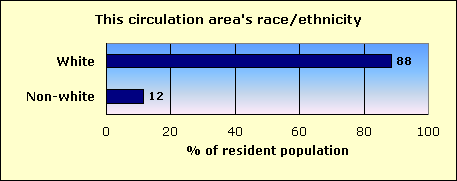
|
|||||||
| Hispanic | 3.0 | 2,738 | ||||||||
| Black | 0.7 | 620 | ||||||||
| Asian and Pacific Islander | 1.3 | 1,161 | ||||||||
| Native-American | 4.1 | 3,689 | ||||||||
| Other non-white | 0.2 | 143 | ||||||||
| Multi-racial | 2.3 | 2,073 | ||||||||
| Non-white | 11.5 | 10,424 | ||||||||
| White | 88.5 | 79,980 | ||||||||
| Total | 90,404 | |||||||||
| Home county: Clallam | ||||||||||
| Race/ethnicity | % of population | Number of residents | 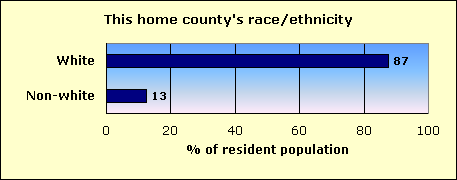
|
|||||||
| Hispanic | 3.4 | 2,203 | ||||||||
| Black | 0.8 | 517 | ||||||||
| Asian and Pacific Islander | 1.3 | 827 | ||||||||
| Native-American | 4.8 | 3,121 | ||||||||
| Other non-white | 0.1 | 73 | ||||||||
| Multi-racial | 2.1 | 1,371 | ||||||||
| Non-white | 12.6 | 8,112 | ||||||||
| White | 87.4 | 56,413 | ||||||||
| Total | 64,525 | |||||||||
| The home county of this newspaper is Clallam. | ||||||||||
| About this report | ||||||||||
| This third annual report for the Knight Foundation adds context to an annual survey by the American Society of Newspaper Editors. ASNE has set a goal that | ||||||||||
| every newspaper, to help it know its community and gather the news, should employ at least one non-white journalist, and that newspapers should strive to | ||||||||||
| employ non-whites in proportion to their share of the community. ASNE's report, at www.asne.org, shows each newspaper's non-white employment, but does | ||||||||||
| not disclose how closely that employment mirrors the newspaper's circulation area. | ||||||||||
| That gap is filled by the report you are reading now. This report was not done by ASNE, but was done for the Knight Foundation by Bill Dedman and | ||||||||||
| Stephen K. Doig. It shows how close each newspaper is to ASNE's goal, by comparing the newsroom staffing with the circulation area population. | ||||||||||
| The full report is at www.powerreporting.com/knight. | ||||||||||
| Notes and definitions | ||||||||||
| 1. The Newsroom Diversity Index is the non-white percentage of the newsroom staff divided by the non-white percentage of the circulation area's residents. Parity = 100. | ||||||||||
| 2. Source for staffing: Survey by American Society of Newspaper Editors, April 2005. Newspapers report non-white staff as of the end of the previous year. | ||||||||||
| 3. Following ASNE's definition, newsroom staff includes only supervisors, reporters, editors, copy/layout editors and photographers. | ||||||||||
| 4. Also following ASNE's definition, "whites," "blacks," etc., exclude Hispanics, who are counted in a separate category. | ||||||||||
| 5. Source for boundaries of this newspaper's circulation area: ZIP Code circulation data, Audit Bureau of Circulations, latest available. | ||||||||||
| 6. A paper may define its circulation area differently for marketing efforts, or news coverage, or to set advertising rates. | ||||||||||
| 7. If ZIP Codes or counties are used, this report applies a threshold: 10 percent household penetration is required to include an area in the circulation area. | ||||||||||
| 8. Source for the demographics of residents of that circulation area: US Census 2000. | ||||||||||
| 9. Source for total circulation: Editor & Publisher magazine, Monday-Friday average at year-end 2004. | ||||||||||
| 10. Staff of non-English publications, such as the Miami Herald's El Nuevo Herald, are excluded from the ASNE staffing survey for the first time this year. | ||||||||||
| Demographics of ZIP Codes | ||||||||||
| where sales were reported by | ||||||||||
| Peninsula Daily News, Port Angeles | ||||||||||
| Note that some ZIP Codes listed here may not have been included in determining the newspaper's circulation area. In calculating the Diversity Index, a | ||||||||||
| ZIP Code was included only if the household penetration was at least 10 percent. Any lower-penetration ZIP Codes are also listed here for your information. | ||||||||||
| Also, if the newspaper reported more than 300 ZIP Codes, only the top 300 in weekday sales are listed here. | ||||||||||
| ZIP / City / State / Approx. distance in miles from the newspaper's home office | Weekday sales | Households | Penetration % (daily sales per 100 households) | Median household income | Non-white % of population |
Hispanic % of population |
Black % of population |
Native % of population |
Asian % of population |
|
| 98362 / Sol Duc Hot Spri / WA / 0 mi. | 5,653 | 9,253 | 61.1 | $35,721 | 7.9 | 2.0 | 0.4 | 2.3 | 1.1 | |
| 98382 / Sequim / WA / 13.8 mi. | 5,119 | 9,848 | 52.0 | $37,392 | 7.0 | 2.3 | 0.2 | 1.4 | 1.4 | |
| 98363 / Prt Angeles / WA / 5.6 mi. | 2,465 | 4,924 | 50.1 | $37,791 | 12.7 | 2.2 | 0.5 | 6.0 | 1.2 | |
| 98368 / Townsend / WA / 26.3 mi. | 1,485 | 5,969 | 24.9 | $38,100 | 7.3 | 1.9 | 0.5 | 1.1 | 1.4 | |
| 98331 / Upper Hoh / WA / 42.7 mi. | 687 | 2,184 | 31.5 | $35,802 | 24.5 | 12.8 | 1.3 | 7.1 | 1.5 | |
| 98339 / Port Hadlock / WA / 29 mi. | 239 | 1,415 | 16.9 | $32,645 | 11.2 | 2.6 | 0.2 | 2.3 | 1.6 | |
| 98365 / Port Ludlow / WA / 34.1 mi. | 221 | 1,687 | 13.1 | $47,229 | 6.2 | 1.9 | 0.6 | 0.8 | 1.3 | |
| 98325 / Shine / WA / 29 mi. | 175 | 502 | 34.9 | $43,140 | 9.5 | 1.9 | 0.1 | 1.1 | 1.1 | |
| 98357 / Tatoosh Island / WA / 54.2 mi. | 175 | 471 | 37.2 | $24,091 | 87.5 | 6.5 | 0.2 | 75.6 | 0.1 | |
| 98326 / Ozette / WA / 37.1 mi. | 162 | 238 | 68.1 | $30,476 | 19.5 | 10.2 | 0.4 | 4.2 | 0.6 | |
| 98376 / Quilcene / WA / 31.5 mi. | 114 | 760 | 15.0 | $39,896 | 10.6 | 1.4 | 0.7 | 2.2 | 1.0 | |
| 98320 / Brinnon / WA / 34.5 mi. | 103 | 579 | 17.8 | $28,167 | 9.9 | 1.9 | 0.3 | 1.6 | 0.8 | |
| 98350 / La Push / WA / 53.8 mi. | 96 | 116 | 82.8 | $21,750 | 89.5 | 5.4 | 0.5 | 78.7 | 0.0 | |
| 98358 / Nordland / WA / 31.5 mi. | 73 | 395 | 18.5 | $38,182 | 3.7 | 1.4 | 0.0 | 0.4 | 0.5 | |
| 98305 / Sappho / WA / 41.7 mi. | 61 | 177 | 34.5 | $30,938 | 6.4 | 3.2 | 0.3 | 0.7 | 0.0 | |
| 98381 / Sekiu / WA / 39.3 mi. | 46 | 263 | 17.5 | $32,443 | 33.7 | 7.2 | 16.3 | 4.5 | 3.4 | |
| File | wa_peninsula_daily_news__port_angeles | |||||||||
| Time | 5/19/05 7:34 PM | |||||||||
| Page | 547 | |||||||||
| Member | 148950 | |||||||||