
|
| Comparing the racial diversity of the journalists | ||||||||||
| at America's daily newspapers | ||||||||||
| with the communities that they serve | ||||||||||
| Newsroom diversity report for | ||||||||||
| King County Journal, Bellevue-Kent | ||||||||||
| Kent, Washington | ||||||||||
| Owner: Horvitz Newspapers (Wa.) | ||||||||||
| From a report for the Knight Foundation | ||||||||||
| by Bill Dedman and Stephen K. Doig, June 2005 | ||||||||||
| Click here to read the national report or to select another newspaper | ||||||||||
| Year | Non-white % of newsroom staff | 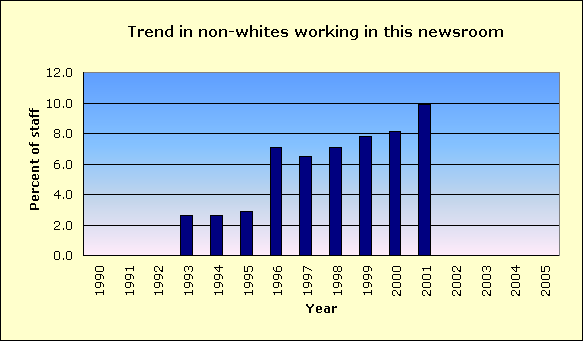
|
||||||||
| 2005 | Did not report | |||||||||
| 2004 | Did not report | |||||||||
| 2003 | Did not report | |||||||||
| 2002 | Did not report | |||||||||
| 2001 | 9.9 | |||||||||
| 2000 | 8.1 | |||||||||
| 1999 | 7.8 | |||||||||
| 1998 | 7.1 | |||||||||
| 1997 | 6.5 | |||||||||
| 1996 | 7.1 | |||||||||
| 1995 | 2.9 | |||||||||
| 1994 | 2.6 | |||||||||
| 1993 | 2.6 | |||||||||
| 1992 | 0.0 | |||||||||
| 1991 | Did not report | |||||||||
| 1990 | Did not report | |||||||||
| The latest year at peak is | 2001 | |||||||||
| See the notes and definitions section below for the sources of these figures. | ||||||||||
| Newsroom Diversity Index | ||||||||||
| for King County Journal, Bellevue-Kent | ||||||||||
| Year | Non-white % of newsroom staff | Non-white % of circulation area | Newsroom Diversity Index (parity=100) | |||||||
| 2005 | N/A | 20.7 | N/A | |||||||
| 2004 | N/A | 20.7 | N/A | |||||||
| How the index is calculated | ||||||||||
| The Newsroom Diversity Index is the non-white percentage of the newsroom staff | ||||||||||
| divided by the non-white percentage of residents in the circulation area. | ||||||||||
| (Parity = 100.) | ||||||||||
| Company index | ||||||||||
| This newspaper's owner, Horvitz Newspapers (Wa.), | ||||||||||
| has a companywide, circulation-weighted Diversity Index of 54. | ||||||||||
| See the notes and definitions section below for the sources of these figures. | ||||||||||
| Peer group comparison | ||||||||||
| for King County Journal, Bellevue-Kent | ||||||||||
| This paper | ||||||||||
| Peer group | ||||||||||
| The median Diversity Index is 44 for all newspapers | ||||||||||
| reporting in this circulation category of 25,001 to 50,000 daily sales. | ||||||||||
| An example of a newspaper of similar circulation, in an area of similar level of non-white residents, but one that has a relatively high Diversity Index, is The Jackson Sun, Tennessee, with a 37.5 percent non-white staff in a community that is 24.7 percent non-white. Its index is 152. | ||||||||||
| FYI, in circulation, this newspaper's average weekday circulation of | ||||||||||
| approximately 42,042 ranks 248 out of 1,410 daily newspapers in the US. | ||||||||||
| See the notes and definitions section below for the sources of these figures. | ||||||||||
| Details on race/ethnicity | ||||||||||
| in the circulation area | ||||||||||
| and the home county | ||||||||||
| of King County Journal, Bellevue-Kent | ||||||||||
| Circulation area | ||||||||||
| Race/ethnicity | % of population | Number of residents | 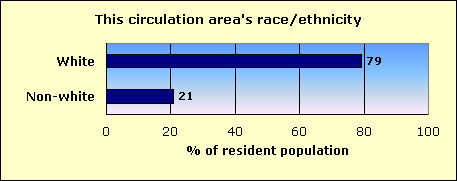
|
|||||||
| Hispanic | 5.0 | 28,426 | ||||||||
| Black | 2.6 | 14,990 | ||||||||
| Asian and Pacific Islander | 9.3 | 53,024 | ||||||||
| Native-American | 0.7 | 3,852 | ||||||||
| Other non-white | 0.2 | 1,391 | ||||||||
| Multi-racial | 2.9 | 16,444 | ||||||||
| Non-white | 20.7 | 118,127 | ||||||||
| White | 79.3 | 453,070 | ||||||||
| Total | 571,197 | |||||||||
| Home county: King | ||||||||||
| Race/ethnicity | % of population | Number of residents | 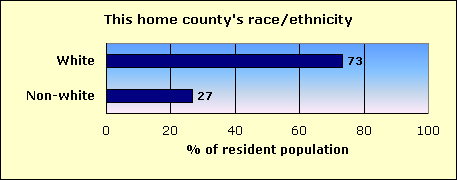
|
|||||||
| Hispanic | 5.5 | 95,242 | ||||||||
| Black | 5.3 | 91,798 | ||||||||
| Asian and Pacific Islander | 11.3 | 195,352 | ||||||||
| Native-American | 0.8 | 14,278 | ||||||||
| Other non-white | 0.3 | 4,577 | ||||||||
| Multi-racial | 3.5 | 60,660 | ||||||||
| Non-white | 26.6 | 461,907 | ||||||||
| White | 73.4 | 1,275,127 | ||||||||
| Total | 1,737,034 | |||||||||
| The home county of this newspaper is King. | ||||||||||
| About this report | ||||||||||
| This third annual report for the Knight Foundation adds context to an annual survey by the American Society of Newspaper Editors. ASNE has set a goal that | ||||||||||
| every newspaper, to help it know its community and gather the news, should employ at least one non-white journalist, and that newspapers should strive to | ||||||||||
| employ non-whites in proportion to their share of the community. ASNE's report, at www.asne.org, shows each newspaper's non-white employment, but does | ||||||||||
| not disclose how closely that employment mirrors the newspaper's circulation area. | ||||||||||
| That gap is filled by the report you are reading now. This report was not done by ASNE, but was done for the Knight Foundation by Bill Dedman and | ||||||||||
| Stephen K. Doig. It shows how close each newspaper is to ASNE's goal, by comparing the newsroom staffing with the circulation area population. | ||||||||||
| The full report is at www.powerreporting.com/knight. | ||||||||||
| Notes and definitions | ||||||||||
| 1. The Newsroom Diversity Index is the non-white percentage of the newsroom staff divided by the non-white percentage of the circulation area's residents. Parity = 100. | ||||||||||
| 2. Source for staffing: Survey by American Society of Newspaper Editors, April 2005. Newspapers report non-white staff as of the end of the previous year. | ||||||||||
| 3. Following ASNE's definition, newsroom staff includes only supervisors, reporters, editors, copy/layout editors and photographers. | ||||||||||
| 4. Also following ASNE's definition, "whites," "blacks," etc., exclude Hispanics, who are counted in a separate category. | ||||||||||
| 5. Source for boundaries of this newspaper's circulation area: ZIP Code circulation data, Audit Bureau of Circulations, latest available. | ||||||||||
| 6. A paper may define its circulation area differently for marketing efforts, or news coverage, or to set advertising rates. | ||||||||||
| 7. If ZIP Codes or counties are used, this report applies a threshold: 10 percent household penetration is required to include an area in the circulation area. | ||||||||||
| 8. Source for the demographics of residents of that circulation area: US Census 2000. | ||||||||||
| 9. Source for total circulation: Editor & Publisher magazine, Monday-Friday average at year-end 2004. | ||||||||||
| 10. Staff of non-English publications, such as the Miami Herald's El Nuevo Herald, are excluded from the ASNE staffing survey for the first time this year. | ||||||||||
| Demographics of ZIP Codes | ||||||||||
| where sales were reported by | ||||||||||
| King County Journal, Bellevue-Kent | ||||||||||
| Note that some ZIP Codes listed here may not have been included in determining the newspaper's circulation area. In calculating the Diversity Index, a | ||||||||||
| ZIP Code was included only if the household penetration was at least 10 percent. Any lower-penetration ZIP Codes are also listed here for your information. | ||||||||||
| Also, if the newspaper reported more than 300 ZIP Codes, only the top 300 in weekday sales are listed here. | ||||||||||
| ZIP / City / State / Approx. distance in miles from the newspaper's home office | Weekday sales | Households | Penetration % (daily sales per 100 households) | Median household income | Non-white % of population |
Hispanic % of population |
Black % of population |
Native % of population |
Asian % of population |
|
| 98042 / Lake Sawyer / WA / 17 mi. | 3,242 | 12,805 | 25.3 | $66,051 | 13.8 | 3.5 | 2.1 | 0.8 | 4.3 | |
| 98052 / Redmond / WA / 5.4 mi. | 2,684 | 20,672 | 13.0 | $68,923 | 22.7 | 5.5 | 1.4 | 0.4 | 12.5 | |
| 98002 / Auburn / WA / 20.5 mi. | 2,396 | 12,557 | 19.1 | $36,991 | 20.1 | 8.1 | 2.3 | 2.1 | 3.7 | |
| 98004 / Yarrow Point / WA / 0.2 mi. | 2,260 | 10,497 | 21.5 | $63,358 | 16.3 | 3.1 | 1.2 | 0.2 | 9.6 | |
| 98031 / Kent / WA / 15 mi. | 2,071 | 23,064 | 9.0 | $50,958 | 32.3 | 6.1 | 7.3 | 0.8 | 13.0 | |
| 98058 / Renton / WA / 11.6 mi. | 1,874 | 13,519 | 13.9 | $63,680 | 25.1 | 3.6 | 4.9 | 0.6 | 12.2 | |
| 98006 / Newport Hills / WA / 4.3 mi. | 1,799 | 13,046 | 13.8 | $81,929 | 26.6 | 2.7 | 1.6 | 0.3 | 19.2 | |
| 98034 / Totem Lake / WA / 6.5 mi. | 1,601 | 16,343 | 9.8 | $60,043 | 20.7 | 5.3 | 1.8 | 0.5 | 9.7 | |
| 98092 / Auburn / WA / 21.7 mi. | 1,589 | 8,721 | 18.2 | $62,478 | 17.4 | 4.3 | 1.8 | 4.3 | 3.5 | |
| 98008 / Bellevue / WA / 3.9 mi. | 1,567 | 9,082 | 17.3 | $67,391 | 25.1 | 5.8 | 1.8 | 0.4 | 14.1 | |
| 98005 / Bellevue / WA / 1.6 mi. | 1,553 | 7,565 | 20.5 | $60,173 | 26.8 | 5.1 | 1.9 | 0.3 | 16.7 | |
| 98032 / Woodmont Beach / WA / 14.7 mi. | 1,506 | 12,404 | 12.1 | $42,042 | 34.3 | 10.8 | 8.9 | 1.0 | 8.9 | |
| 98055 / Renton / WA / 10.3 mi. | 1,470 | 11,735 | 12.5 | $42,758 | 39.2 | 6.6 | 11.2 | 0.6 | 16.2 | |
| 98033 / Totem Lake / WA / 4.5 mi. | 1,376 | 13,661 | 10.1 | $69,073 | 14.1 | 3.2 | 1.1 | 0.5 | 6.8 | |
| 98007 / Eastgate / WA / 2.8 mi. | 1,299 | 10,233 | 12.7 | $48,606 | 39.6 | 9.8 | 2.8 | 0.3 | 22.9 | |
| 98059 / Renton / WA / 8.1 mi. | 1,296 | 10,745 | 12.1 | $61,361 | 20.9 | 5.4 | 2.5 | 0.7 | 9.3 | |
| 98072 / Woodinville / WA / 9.6 mi. | 1,216 | 11,955 | 10.2 | $82,922 | 12.2 | 4.1 | 0.7 | 0.3 | 4.5 | |
| 98038 / Wilderness Villa / WA / 16.2 mi. | 1,206 | 7,723 | 15.6 | $68,180 | 9.4 | 2.9 | 0.9 | 0.6 | 2.1 | |
| 98056 / Renton / WA / 7.1 mi. | 1,100 | 10,287 | 10.7 | $53,608 | 27.8 | 6.6 | 4.8 | 0.7 | 12.0 | |
| 98022 / Wabash / WA / 33.3 mi. | 1,089 | 7,966 | 13.7 | $54,118 | 8.2 | 3.7 | 0.3 | 1.4 | 0.8 | |
| 98027 / Pine Lake / WA / 8.1 mi. | 1,050 | 8,772 | 12.0 | $70,085 | 12.5 | 3.4 | 0.8 | 0.5 | 5.2 | |
| 98001 / Federal Way / WA / 20.2 mi. | 755 | 8,924 | 8.5 | $60,534 | 17.2 | 4.2 | 2.6 | 1.0 | 6.2 | |
| 98011 / Queensgate / WA / 8.7 mi. | 609 | 10,456 | 5.8 | $61,329 | 15.5 | 4.7 | 1.3 | 0.6 | 6.0 | |
| 98045 / North Bend / WA / 21.5 mi. | 585 | 5,068 | 11.5 | $65,674 | 7.9 | 2.7 | 0.5 | 0.9 | 1.8 | |
| 98178 / Tukwila / WA / 8.3 mi. | 495 | 8,388 | 5.9 | $47,461 | 60.7 | 4.3 | 26.0 | 0.7 | 24.2 | |
| 98040 / Mercer Island / WA / 3.7 mi. | 460 | 8,437 | 5.5 | $91,904 | 17.2 | 1.9 | 1.1 | 0.2 | 11.9 | |
| 98029 / Issaquah / WA / 9.6 mi. | 441 | 9,815 | 4.5 | $91,146 | 16.5 | 2.5 | 0.8 | 0.2 | 10.5 | |
| 98053 / Redmond / WA / 8.7 mi. | 403 | 10,287 | 3.9 | $96,028 | 12.7 | 2.4 | 0.8 | 0.3 | 6.6 | |
| 98014 / Lake Joy / WA / 12.9 mi. | 305 | 2,378 | 12.8 | $66,841 | 8.1 | 2.9 | 0.1 | 1.1 | 1.9 | |
| 98039 / Medina / WA / 1.4 mi. | 293 | 1,126 | 26.0 | $132,665 | 8.6 | 1.4 | 0.2 | 0.3 | 5.1 | |
| 98019 / Duvall / WA / 17.2 mi. | 274 | 2,831 | 9.7 | $72,438 | 8.5 | 4.0 | 0.5 | 0.4 | 1.7 | |
| 98024 / Spring Glen / WA / 13.6 mi. | 263 | 1,724 | 15.3 | $62,076 | 9.0 | 3.0 | 0.9 | 1.1 | 1.3 | |
| 98003 / Federal Way / WA / 20.2 mi. | 240 | 16,896 | 1.4 | $43,027 | 35.0 | 8.6 | 8.6 | 0.8 | 12.1 | |
| 98012 / Mill Creek / WA / 14.3 mi. | 239 | 14,238 | 1.7 | $65,730 | 16.8 | 3.9 | 1.2 | 0.6 | 8.5 | |
| 98010 / Morganville / WA / 21.7 mi. | 232 | 1,616 | 14.4 | $66,709 | 7.8 | 2.4 | 0.1 | 1.4 | 1.1 | |
| 98028 / Kenmore / WA / 9 mi. | 222 | 7,125 | 3.1 | $61,813 | 15.1 | 3.6 | 1.3 | 0.4 | 7.0 | |
| 98047 / Pacific / WA / 22.8 mi. | 212 | 1,862 | 11.4 | $45,505 | 17.9 | 6.7 | 1.2 | 1.5 | 5.0 | |
| 98051 / Ravensdale / WA / 21.2 mi. | 196 | 1,046 | 18.7 | $56,414 | 5.3 | 1.5 | 0.6 | 0.9 | 0.3 | |
| 98188 / Tukwila / WA / 11.7 mi. | 192 | 9,694 | 2.0 | $40,618 | 43.2 | 11.7 | 10.8 | 1.1 | 13.9 | |
| 98390 / Sumner / WA / 27.6 mi. | 183 | 15,999 | 1.1 | $56,175 | 9.0 | 3.5 | 0.6 | 1.0 | 1.5 | |
| 98065 / Snoqualmie / WA / 17.6 mi. | 178 | 1,428 | 12.5 | $60,658 | 10.0 | 3.2 | 0.6 | 1.8 | 1.8 | |
| 98198 / Seattle / WA / 14.6 mi. | 137 | 12,653 | 1.1 | $46,628 | 32.6 | 8.8 | 8.2 | 1.0 | 10.1 | |
| 98168 / Tukwila / WA / 9.4 mi. | 88 | 11,319 | 0.8 | $41,097 | 41.3 | 13.7 | 7.6 | 1.4 | 13.5 | |
| 98021 / Thrashers Corner / WA / 11.2 mi. | 66 | 7,524 | 0.9 | $63,630 | 13.2 | 3.1 | 1.0 | 0.5 | 5.8 | |
| 98101 / Times Square / WA / 5.7 mi. | 31 | 5,924 | 0.5 | $26,995 | 29.7 | 5.1 | 10.3 | 1.9 | 8.6 | |
| File | wa_king_county_journal__bellevue-kent | |||||||||
| Time | 5/20/05 9:54 PM | |||||||||
| Page | 248 | |||||||||
| Member | 148590 | |||||||||