
|
| Comparing the racial diversity of the journalists | ||||||||||
| at America's daily newspapers | ||||||||||
| with the communities that they serve | ||||||||||
| Newsroom diversity report for | ||||||||||
| The Spectrum, St. George | ||||||||||
| St. George, Utah | ||||||||||
| Owner: Gannett Co. (Va.) | ||||||||||
| From a report for the Knight Foundation | ||||||||||
| by Bill Dedman and Stephen K. Doig, June 2005 | ||||||||||
| Click here to read the national report or to select another newspaper | ||||||||||
| Year | Non-white % of newsroom staff | 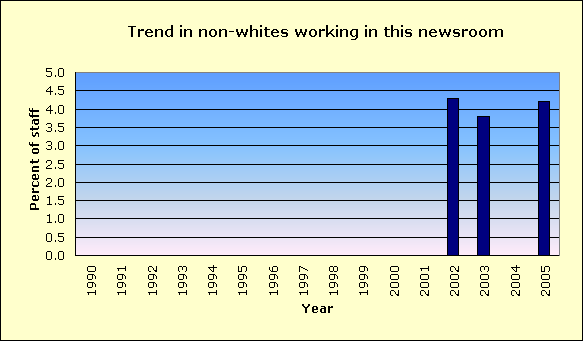
|
||||||||
| 2005 | 4.2 | |||||||||
| 2004 | 0.0 | |||||||||
| 2003 | 3.8 | |||||||||
| 2002 | 4.3 | |||||||||
| 2001 | 0.0 | |||||||||
| 2000 | 0.0 | |||||||||
| 1999 | 0.0 | |||||||||
| 1998 | Did not report | |||||||||
| 1997 | Did not report | |||||||||
| 1996 | Did not report | |||||||||
| 1995 | Did not report | |||||||||
| 1994 | Did not report | |||||||||
| 1993 | Did not report | |||||||||
| 1992 | 0.0 | |||||||||
| 1991 | Did not report | |||||||||
| 1990 | 0.0 | |||||||||
| The latest year at peak is | 2002 | |||||||||
| See the notes and definitions section below for the sources of these figures. | ||||||||||
| Newsroom Diversity Index | ||||||||||
| for The Spectrum, St. George | ||||||||||
| Year | Non-white % of newsroom staff | Non-white % of circulation area | Newsroom Diversity Index (parity=100) | |||||||
| 2005 | 4.2 | 10.1 | 42 | |||||||
| 2004 | 0.0 | 10.1 | 0 | |||||||
| How the index is calculated | ||||||||||
| The Newsroom Diversity Index is the non-white percentage of the newsroom staff | ||||||||||
| divided by the non-white percentage of residents in the circulation area. | ||||||||||
| (Parity = 100.) | ||||||||||
| Company index | ||||||||||
| This newspaper's owner, Gannett Co. (Va.), | ||||||||||
| has a companywide, circulation-weighted Diversity Index of 89. | ||||||||||
| See the notes and definitions section below for the sources of these figures. | ||||||||||
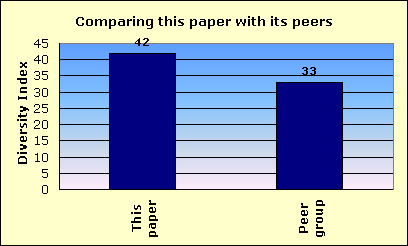
| Peer group comparison | ||||||||||
| for The Spectrum, St. George | ||||||||||
 |
||||||||||
| This newspaper's Newsroom Diversity Index is 42. | This paper | |||||||||
| Peer group | ||||||||||
| Compare that with 33, which is the median Diversity Index for all newspapers | ||||||||||
| reporting in this circulation category of 10,001 to 25,000 daily sales. | ||||||||||
| In that group, this newspaper's Diversity Index ranks 105 out of 259 | ||||||||||
| newspapers reporting in the category of 10,001 to 25,000 daily sales. | ||||||||||
| An example of a newspaper of similar circulation, in an area of similar level of non-white residents, but one that has a relatively high Diversity Index, is The Herald, Sharon, Pennsylvania, with a 8 percent non-white staff in a community that is 7.3 percent non-white. Its index is 110. | ||||||||||
| FYI, in circulation, this newspaper's average weekday circulation of | ||||||||||
| approximately 21,814 ranks 440 out of 1,410 daily newspapers in the US. | ||||||||||
| See the notes and definitions section below for the sources of these figures. | ||||||||||
| Details on race/ethnicity | ||||||||||
| in the circulation area | ||||||||||
| and the home county | ||||||||||
| of The Spectrum, St. George | ||||||||||
| Circulation area | ||||||||||
| Race/ethnicity | % of population | Number of residents | 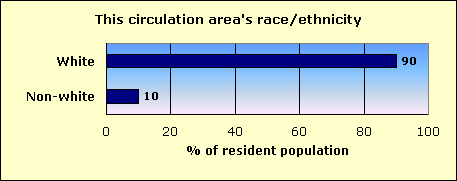
|
|||||||
| Hispanic | 6.2 | 9,486 | ||||||||
| Black | 0.2 | 375 | ||||||||
| Asian and Pacific Islander | 0.9 | 1,319 | ||||||||
| Native-American | 1.5 | 2,368 | ||||||||
| Other non-white | 0.1 | 137 | ||||||||
| Multi-racial | 1.2 | 1,801 | ||||||||
| Non-white | 10.1 | 15,486 | ||||||||
| White | 89.9 | 138,370 | ||||||||
| Total | 153,856 | |||||||||
| Home county: Washington | ||||||||||
| Race/ethnicity | % of population | Number of residents | 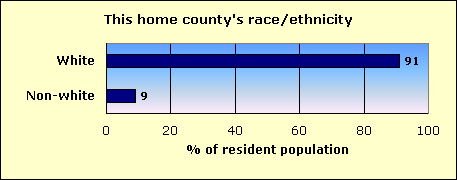
|
|||||||
| Hispanic | 5.2 | 4,727 | ||||||||
| Black | 0.2 | 174 | ||||||||
| Asian and Pacific Islander | 0.9 | 768 | ||||||||
| Native-American | 1.4 | 1,229 | ||||||||
| Other non-white | 0.1 | 87 | ||||||||
| Multi-racial | 1.2 | 1,076 | ||||||||
| Non-white | 8.9 | 8,061 | ||||||||
| White | 91.1 | 82,293 | ||||||||
| Total | 90,354 | |||||||||
| The home county of this newspaper is Washington. | ||||||||||
| About this report | ||||||||||
| This third annual report for the Knight Foundation adds context to an annual survey by the American Society of Newspaper Editors. ASNE has set a goal that | ||||||||||
| every newspaper, to help it know its community and gather the news, should employ at least one non-white journalist, and that newspapers should strive to | ||||||||||
| employ non-whites in proportion to their share of the community. ASNE's report, at www.asne.org, shows each newspaper's non-white employment, but does | ||||||||||
| not disclose how closely that employment mirrors the newspaper's circulation area. | ||||||||||
| That gap is filled by the report you are reading now. This report was not done by ASNE, but was done for the Knight Foundation by Bill Dedman and | ||||||||||
| Stephen K. Doig. It shows how close each newspaper is to ASNE's goal, by comparing the newsroom staffing with the circulation area population. | ||||||||||
| The full report is at www.powerreporting.com/knight. | ||||||||||
| Notes and definitions | ||||||||||
| 1. The Newsroom Diversity Index is the non-white percentage of the newsroom staff divided by the non-white percentage of the circulation area's residents. Parity = 100. | ||||||||||
| 2. Source for staffing: Survey by American Society of Newspaper Editors, April 2005. Newspapers report non-white staff as of the end of the previous year. | ||||||||||
| 3. Following ASNE's definition, newsroom staff includes only supervisors, reporters, editors, copy/layout editors and photographers. | ||||||||||
| 4. Also following ASNE's definition, "whites," "blacks," etc., exclude Hispanics, who are counted in a separate category. | ||||||||||
| 5. Source for boundaries of this newspaper's circulation area: ZIP Code circulation data, Audit Bureau of Circulations, latest available. | ||||||||||
| 6. A paper may define its circulation area differently for marketing efforts, or news coverage, or to set advertising rates. | ||||||||||
| 7. If ZIP Codes or counties are used, this report applies a threshold: 10 percent household penetration is required to include an area in the circulation area. | ||||||||||
| 8. Source for the demographics of residents of that circulation area: US Census 2000. | ||||||||||
| 9. Source for total circulation: Editor & Publisher magazine, Monday-Friday average at year-end 2004. | ||||||||||
| 10. Staff of non-English publications, such as the Miami Herald's El Nuevo Herald, are excluded from the ASNE staffing survey for the first time this year. | ||||||||||
| Demographics of ZIP Codes | ||||||||||
| where sales were reported by | ||||||||||
| The Spectrum, St. George | ||||||||||
| Note that some ZIP Codes listed here may not have been included in determining the newspaper's circulation area. In calculating the Diversity Index, a | ||||||||||
| ZIP Code was included only if the household penetration was at least 10 percent. Any lower-penetration ZIP Codes are also listed here for your information. | ||||||||||
| Also, if the newspaper reported more than 300 ZIP Codes, only the top 300 in weekday sales are listed here. | ||||||||||
| ZIP / City / State / Approx. distance in miles from the newspaper's home office | Weekday sales | Households | Penetration % (daily sales per 100 households) | Median household income | Non-white % of population |
Hispanic % of population |
Black % of population |
Native % of population |
Asian % of population |
|
| 84770 / Saint George / UT / 0 mi. | 4,868 | 10,808 | 45.0 | $32,967 | 13.3 | 8.5 | 0.3 | 2.0 | 1.1 | |
| 84790 / Saint George / UT / 11.9 mi. | 4,539 | 7,068 | 64.2 | $41,811 | 7.0 | 3.8 | 0.1 | 0.7 | 1.1 | |
| 84720 / Cedar City / UT / 53.8 mi. | 3,812 | 9,075 | 42.0 | $33,150 | 8.9 | 3.9 | 0.3 | 2.3 | 1.1 | |
| 84737 / Hurricane / UT / 36.8 mi. | 1,537 | 3,830 | 40.1 | $33,765 | 5.9 | 2.9 | 0.1 | 0.9 | 0.7 | |
| 84780 / Washington / UT / 17.8 mi. | 1,413 | 2,763 | 51.1 | $36,743 | 7.7 | 4.6 | 0.4 | 1.5 | 0.4 | |
| 84738 / Ivins / UT / 8.9 mi. | 805 | 1,411 | 57.1 | $40,915 | 7.6 | 4.1 | 0.1 | 1.0 | 0.7 | |
| 84765 / Santa Clara / UT / 7.8 mi. | 753 | 1,186 | 63.5 | $53,079 | 4.0 | 1.9 | 0.2 | 0.3 | 0.6 | |
| 84741 / Kanab / UT / 111.9 mi. | 480 | 1,818 | 26.4 | $34,339 | 5.7 | 2.3 | 0.0 | 1.7 | 0.3 | |
| 84761 / Parowan / UT / 70.9 mi. | 433 | 940 | 46.1 | $32,578 | 5.2 | 3.3 | 0.0 | 0.5 | 0.3 | |
| 89027 / Mesquite / NV / 27.7 mi. | 360 | 3,524 | 10.2 | $40,392 | 28.5 | 24.7 | 0.5 | 0.7 | 1.3 | |
| 84713 / Beaver / UT / 106.9 mi. | 337 | 1,188 | 28.4 | $33,179 | 8.4 | 5.4 | 0.4 | 0.9 | 0.5 | |
| 84782 / Veyo / UT / 16.7 mi. | 326 | 238 | 137.0 | $45,990 | 4.4 | 2.1 | 0.0 | 0.7 | 0.3 | |
| 84745 / La Verkin / UT / 29.3 mi. | 324 | 1,055 | 30.7 | $35,949 | 8.0 | 4.6 | 0.1 | 1.2 | 0.3 | |
| 86021 / Colorado City / AZ / 46.1 mi. | 239 | 570 | 41.9 | $31,801 | 3.5 | 2.4 | 0.2 | 0.0 | 0.3 | |
| 84725 / Enterprise / UT / 30.8 mi. | 182 | 420 | 43.3 | $35,197 | 5.1 | 2.0 | 0.0 | 2.2 | 0.2 | |
| 84759 / Panguitch / UT / 86.6 mi. | 180 | 642 | 28.0 | $35,592 | 6.3 | 2.8 | 0.4 | 2.3 | 0.2 | |
| 84751 / Milford / UT / 87.7 mi. | 146 | 491 | 29.7 | $37,019 | 10.2 | 5.7 | 0.1 | 1.4 | 1.3 | |
| 84774 / Toquerville / UT / 28.9 mi. | 123 | 107 | 115.0 | $30,833 | 2.9 | 2.3 | 0.0 | 0.3 | 0.0 | |
| 84757 / New Harmony / UT / 36 mi. | 111 | 305 | 36.4 | $48,000 | 6.2 | 4.7 | 0.0 | 0.3 | 0.0 | |
| 84752 / Minersville / UT / 88.6 mi. | 107 | 258 | 41.5 | $36,250 | 6.8 | 6.1 | 0.0 | 0.0 | 0.1 | |
| 86022 / Fredonia / AZ / 71 mi. | 96 | 602 | 15.9 | $26,563 | 19.3 | 2.2 | 0.6 | 14.8 | 0.1 | |
| 84760 / Paragonah / UT / 84.2 mi. | 93 | 208 | 44.7 | $32,604 | 3.7 | 3.1 | 0.3 | 0.2 | 0.2 | |
| 86432 / Littlefield / AZ / 49.5 mi. | 81 | 410 | 19.8 | $30,707 | 27.2 | 24.4 | 0.0 | 1.0 | 0.2 | |
| 84779 / Virgin / UT / 33.3 mi. | 58 | 221 | 26.2 | $36,172 | 7.2 | 4.5 | 0.3 | 0.3 | 1.0 | |
| 84758 / Orderville / UT / 59.6 mi. | 52 | 176 | 29.5 | $35,556 | 2.8 | 1.7 | 0.0 | 0.8 | 0.0 | |
| 89042 / Panaca / NV / 56 mi. | 43 | 289 | 14.9 | $30,455 | 5.5 | 3.4 | 0.1 | 0.7 | 0.4 | |
| 84729 / Glendale / UT / 65.7 mi. | 40 | 117 | 34.2 | $35,156 | 5.0 | 4.2 | 0.0 | 0.6 | 0.0 | |
| 84772 / Summit / UT / 68.9 mi. | 37 | 63 | 58.7 | $42,857 | 10.5 | 7.9 | 0.0 | 2.6 | 0.0 | |
| 84776 / Tropic / UT / 100.1 mi. | 36 | 162 | 22.2 | $42,321 | 4.9 | 2.3 | 0.0 | 0.4 | 0.2 | |
| 89007 / Bunkerville / NV / 30.8 mi. | 32 | 258 | 12.4 | $45,076 | 30.1 | 24.9 | 0.7 | 0.0 | 2.5 | |
| File | ut_the_spectrum__st_george | |||||||||
| Time | 5/14/05 1:39 PM | |||||||||
| Page | 440 | |||||||||
| Member | 147360 | |||||||||