
|
| Comparing the racial diversity of the journalists | ||||||||||
| at America's daily newspapers | ||||||||||
| with the communities that they serve | ||||||||||
| Newsroom diversity report for | ||||||||||
| The Monitor, McAllen | ||||||||||
| McAllen, Texas | ||||||||||
| Owner: Freedom Communications (Ca.) | ||||||||||
| From a report for the Knight Foundation | ||||||||||
| by Bill Dedman and Stephen K. Doig, June 2005 | ||||||||||
| Click here to read the national report or to select another newspaper | ||||||||||
| Year | Non-white % of newsroom staff | 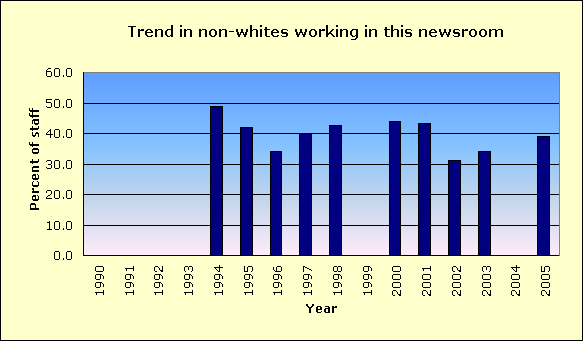
|
||||||||
| 2005 | 39.1 | |||||||||
| 2004 | Did not report | |||||||||
| 2003 | 34.0 | |||||||||
| 2002 | 31.1 | |||||||||
| 2001 | 43.2 | |||||||||
| 2000 | 43.8 | |||||||||
| 1999 | Did not report | |||||||||
| 1998 | 42.5 | |||||||||
| 1997 | 40.0 | |||||||||
| 1996 | 34.2 | |||||||||
| 1995 | 42.1 | |||||||||
| 1994 | 48.7 | |||||||||
| 1993 | Did not report | |||||||||
| 1992 | Did not report | |||||||||
| 1991 | Did not report | |||||||||
| 1990 | Did not report | |||||||||
| The latest year at peak is | 1994 | |||||||||
| See the notes and definitions section below for the sources of these figures. | ||||||||||
| Newsroom Diversity Index | ||||||||||
| for The Monitor, McAllen | ||||||||||
| Year | Non-white % of newsroom staff | Non-white % of circulation area | Newsroom Diversity Index (parity=100) | |||||||
| 2005 | 39.1 | 89.6 | 44 | |||||||
| 2004 | N/A | 89.1 | N/A | |||||||
| How the index is calculated | ||||||||||
| The Newsroom Diversity Index is the non-white percentage of the newsroom staff | ||||||||||
| divided by the non-white percentage of residents in the circulation area. | ||||||||||
| (Parity = 100.) | ||||||||||
| Company index | ||||||||||
| This newspaper's owner, Freedom Communications (Ca.), | ||||||||||
| has a companywide, circulation-weighted Diversity Index of 59. | ||||||||||
| See the notes and definitions section below for the sources of these figures. | ||||||||||
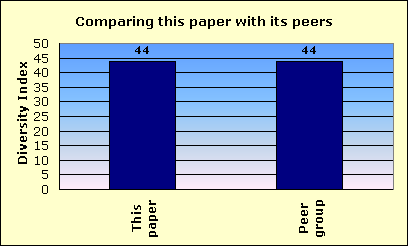
| Peer group comparison | ||||||||||
| for The Monitor, McAllen | ||||||||||
 |
||||||||||
| This newspaper's Newsroom Diversity Index is 44. | This paper | |||||||||
| Peer group | ||||||||||
| Compare that with 44, which is the median Diversity Index for all newspapers | ||||||||||
| reporting in this circulation category of 25,001 to 50,000 daily sales. | ||||||||||
| In that group, this newspaper's Diversity Index ranks 71 out of 140 | ||||||||||
| newspapers reporting in the category of 25,001 to 50,000 daily sales. | ||||||||||
| FYI, in circulation, this newspaper's average weekday circulation of | ||||||||||
| approximately 38,098 ranks 273 out of 1,410 daily newspapers in the US. | ||||||||||
| See the notes and definitions section below for the sources of these figures. | ||||||||||
| Details on race/ethnicity | ||||||||||
| in the circulation area | ||||||||||
| and the home county | ||||||||||
| of The Monitor, McAllen | ||||||||||
| Circulation area | ||||||||||
| Race/ethnicity | % of population | Number of residents | 
|
|||||||
| Hispanic | 87.8 | 462,514 | ||||||||
| Black | 0.4 | 1,904 | ||||||||
| Asian and Pacific Islander | 0.6 | 3,235 | ||||||||
| Native-American | 0.1 | 414 | ||||||||
| Other non-white | 0.0 | 158 | ||||||||
| Multi-racial | 0.2 | 1,141 | ||||||||
| Non-white | 89.1 | 469,366 | ||||||||
| White | 10.9 | 57,259 | ||||||||
| Total | 526,625 | |||||||||
| Home county: Hidalgo | ||||||||||
| Race/ethnicity | % of population | Number of residents | 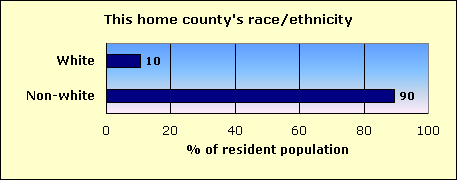
|
|||||||
| Hispanic | 88.4 | 503,100 | ||||||||
| Black | 0.3 | 1,934 | ||||||||
| Asian and Pacific Islander | 0.6 | 3,244 | ||||||||
| Native-American | 0.1 | 428 | ||||||||
| Other non-white | 0.0 | 171 | ||||||||
| Multi-racial | 0.2 | 1,163 | ||||||||
| Non-white | 89.6 | 510,040 | ||||||||
| White | 10.4 | 59,423 | ||||||||
| Total | 569,463 | |||||||||
| The home county of this newspaper is Hidalgo. | ||||||||||
| About this report | ||||||||||
| This third annual report for the Knight Foundation adds context to an annual survey by the American Society of Newspaper Editors. ASNE has set a goal that | ||||||||||
| every newspaper, to help it know its community and gather the news, should employ at least one non-white journalist, and that newspapers should strive to | ||||||||||
| employ non-whites in proportion to their share of the community. ASNE's report, at www.asne.org, shows each newspaper's non-white employment, but does | ||||||||||
| not disclose how closely that employment mirrors the newspaper's circulation area. | ||||||||||
| That gap is filled by the report you are reading now. This report was not done by ASNE, but was done for the Knight Foundation by Bill Dedman and | ||||||||||
| Stephen K. Doig. It shows how close each newspaper is to ASNE's goal, by comparing the newsroom staffing with the circulation area population. | ||||||||||
| The full report is at www.powerreporting.com/knight. | ||||||||||
| Notes and definitions | ||||||||||
| 1. The Newsroom Diversity Index is the non-white percentage of the newsroom staff divided by the non-white percentage of the circulation area's residents. Parity = 100. | ||||||||||
| 2. Source for staffing: Survey by American Society of Newspaper Editors, April 2005. Newspapers report non-white staff as of the end of the previous year. | ||||||||||
| 3. Following ASNE's definition, newsroom staff includes only supervisors, reporters, editors, copy/layout editors and photographers. | ||||||||||
| 4. Also following ASNE's definition, "whites," "blacks," etc., exclude Hispanics, who are counted in a separate category. | ||||||||||
| 5. Source for boundaries of this newspaper's circulation area: ZIP Code circulation data, Audit Bureau of Circulations, latest available. | ||||||||||
| 6. A paper may define its circulation area differently for marketing efforts, or news coverage, or to set advertising rates. | ||||||||||
| 7. If ZIP Codes or counties are used, this report applies a threshold: 10 percent household penetration is required to include an area in the circulation area. | ||||||||||
| 8. Source for the demographics of residents of that circulation area: US Census 2000. | ||||||||||
| 9. Source for total circulation: Editor & Publisher magazine, Monday-Friday average at year-end 2004. | ||||||||||
| 10. Staff of non-English publications, such as the Miami Herald's El Nuevo Herald, are excluded from the ASNE staffing survey for the first time this year. | ||||||||||
| Demographics of ZIP Codes | ||||||||||
| where sales were reported by | ||||||||||
| The Monitor, McAllen | ||||||||||
| Note that some ZIP Codes listed here may not have been included in determining the newspaper's circulation area. In calculating the Diversity Index, a | ||||||||||
| ZIP Code was included only if the household penetration was at least 10 percent. Any lower-penetration ZIP Codes are also listed here for your information. | ||||||||||
| Also, if the newspaper reported more than 300 ZIP Codes, only the top 300 in weekday sales are listed here. | ||||||||||
| ZIP / City / State / Approx. distance in miles from the newspaper's home office | Weekday sales | Households | Penetration % (daily sales per 100 households) | Median household income | Non-white % of population |
Hispanic % of population |
Black % of population |
Native % of population |
Asian % of population |
|
| 78572 / Sharyland / TX / 5.5 mi. | 10,446 | 30,678 | 34.1 | $23,799 | 89.1 | 88.4 | 0.1 | 0.1 | 0.3 | |
| 78501 / McAllen / TX / 0.9 mi. | 5,667 | 18,696 | 30.3 | $26,701 | 85.9 | 84.0 | 0.4 | 0.1 | 1.2 | |
| 78539 / San Juan Communi / TX / 7.4 mi. | 5,380 | 23,220 | 23.2 | $25,402 | 91.7 | 89.7 | 1.2 | 0.1 | 0.4 | |
| 78577 / Pharr / TX / 2.9 mi. | 3,424 | 13,010 | 26.3 | $24,216 | 91.3 | 90.7 | 0.1 | 0.1 | 0.2 | |
| 78504 / McAllen / TX / 3.5 mi. | 3,338 | 10,617 | 31.4 | $51,923 | 72.1 | 66.9 | 0.7 | 0.1 | 3.5 | |
| 78537 / La Tijera / TX / 10.6 mi. | 2,492 | 8,327 | 29.9 | $21,675 | 89.0 | 88.6 | 0.1 | 0.1 | 0.1 | |
| 78516 / El Gato / TX / 6.8 mi. | 2,309 | 7,193 | 32.1 | $21,378 | 85.5 | 85.1 | 0.1 | 0.1 | 0.1 | |
| 78596 / Weslaco / TX / 14.5 mi. | 2,290 | 14,088 | 16.3 | $24,628 | 89.3 | 88.3 | 0.1 | 0.1 | 0.7 | |
| 78589 / San Juan / TX / 4.3 mi. | 1,597 | 7,246 | 22.0 | $22,627 | 95.8 | 95.4 | 0.1 | 0.1 | 0.1 | |
| 78503 / McAllen / TX / 1.7 mi. | 1,294 | 4,564 | 28.4 | $30,005 | 93.0 | 91.3 | 0.3 | 0.1 | 1.1 | |
| 78582 / Villareales / TX / 36.2 mi. | 962 | 8,884 | 10.8 | $17,238 | 98.1 | 97.4 | 0.0 | 0.1 | 0.5 | |
| 78570 / Thayer / TX / 18.5 mi. | 515 | 7,759 | 6.6 | $21,053 | 93.6 | 93.4 | 0.1 | 0.0 | 0.0 | |
| 78543 / Engelman / TX / 15.3 mi. | 378 | 2,133 | 17.7 | $18,973 | 97.6 | 97.4 | 0.0 | 0.1 | 0.0 | |
| 78538 / Monte Alto / TX / 16.7 mi. | 305 | 1,983 | 15.4 | $19,861 | 94.3 | 93.9 | 0.2 | 0.0 | 0.0 | |
| 78557 / Hidalgo / TX / 6.4 mi. | 294 | 1,849 | 15.9 | $19,397 | 98.1 | 97.8 | 0.1 | 0.0 | 0.1 | |
| 78576 / Penitas / TX / 11.7 mi. | 240 | 808 | 29.7 | $17,925 | 98.8 | 98.6 | 0.0 | 0.1 | 0.0 | |
| 78584 / Roma / TX / 35.3 mi. | 172 | 4,641 | 3.7 | $15,228 | 97.9 | 97.9 | 0.0 | 0.0 | 0.0 | |
| 78550 / Stuart Place / TX / 31.7 mi. | 121 | 16,555 | 0.7 | $29,223 | 76.5 | 74.3 | 0.7 | 0.2 | 0.9 | |
| 78355 / Flowella / TX / 66.1 mi. | 118 | 2,586 | 4.6 | $17,886 | 91.5 | 91.0 | 0.1 | 0.1 | 0.2 | |
| 78595 / Sullivan City / TX / 19.2 mi. | 104 | 1,280 | 8.1 | $16,980 | 98.9 | 98.9 | 0.0 | 0.0 | 0.0 | |
| 78560 / La Joya / TX / 11.7 mi. | 94 | 991 | 9.5 | $22,415 | 98.0 | 97.4 | 0.0 | 0.1 | 0.4 | |
| 78597 / South Padre Isla / TX / 62.1 mi. | 94 | 1,418 | 6.6 | $41,794 | 23.6 | 21.5 | 0.5 | 0.4 | 0.3 | |
| 78579 / Progreso / TX / 14.3 mi. | 68 | 721 | 9.4 | $18,836 | 98.7 | 98.6 | 0.0 | 0.0 | 0.1 | |
| 78548 / Grulla / TX / 23.9 mi. | 42 | 466 | 9.0 | $15,233 | 98.4 | 98.1 | 0.1 | 0.1 | 0.0 | |
| 78562 / La Villa / TX / 18.8 mi. | 36 | 498 | 7.2 | $19,737 | 98.0 | 97.9 | 0.0 | 0.0 | 0.0 | |
| File | tx_the_monitor__mcallen | |||||||||
| Time | 5/20/05 9:16 PM | |||||||||
| Page | 273 | |||||||||
| Member | 145850 | |||||||||