
|
| Comparing the racial diversity of the journalists | ||||||||||
| at America's daily newspapers | ||||||||||
| with the communities that they serve | ||||||||||
| Newsroom diversity report for | ||||||||||
| Houston Chronicle | ||||||||||
| Houston, Texas | ||||||||||
| Owner: Hearst Newspapers (N.Y.) | ||||||||||
| From a report for the Knight Foundation | ||||||||||
| by Bill Dedman and Stephen K. Doig, June 2005 | ||||||||||
| Click here to read the national report or to select another newspaper | ||||||||||
| Year | Non-white % of newsroom staff | 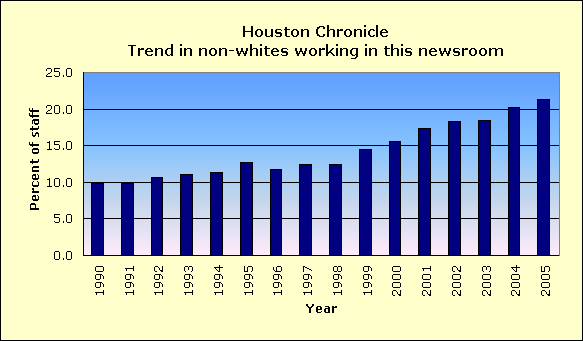
|
||||||||
| 2005 | 21.3 | |||||||||
| 2004 | 20.2 | |||||||||
| 2003 | 18.4 | |||||||||
| 2002 | 18.3 | |||||||||
| 2001 | 17.3 | |||||||||
| 2000 | 15.6 | |||||||||
| 1999 | 14.5 | |||||||||
| 1998 | 12.4 | |||||||||
| 1997 | 12.5 | |||||||||
| 1996 | 11.7 | |||||||||
| 1995 | 12.7 | |||||||||
| 1994 | 11.4 | |||||||||
| 1993 | 11.1 | |||||||||
| 1992 | 10.7 | |||||||||
| 1991 | 9.9 | |||||||||
| 1990 | 9.8 | |||||||||
| The latest year at peak is | 2005 | |||||||||
| See the notes and definitions section below for the sources of these figures. | ||||||||||
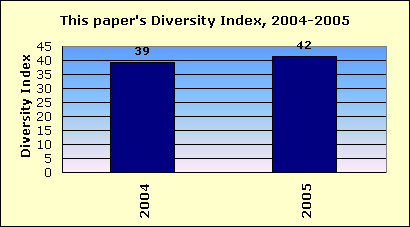
| Newsroom Diversity Index | ||||||||||
| for Houston Chronicle | ||||||||||
 |
||||||||||
| Year | Non-white % of newsroom staff | Non-white % of circulation area | Newsroom Diversity Index (parity=100) | |||||||
| 2005 | 21.3 | 51.2 | 42 | |||||||
| 2004 | 20.2 | 51.2 | 39 | |||||||
| How the index is calculated | ||||||||||
| The Newsroom Diversity Index is the non-white percentage of the newsroom staff | ||||||||||
| divided by the non-white percentage of residents in the circulation area. | ||||||||||
| (Parity = 100.) | ||||||||||
| Company index | ||||||||||
| This newspaper's owner, Hearst Newspapers (N.Y.), | ||||||||||
| has a companywide, circulation-weighted Diversity Index of 45. | ||||||||||
| See the notes and definitions section below for the sources of these figures. | ||||||||||
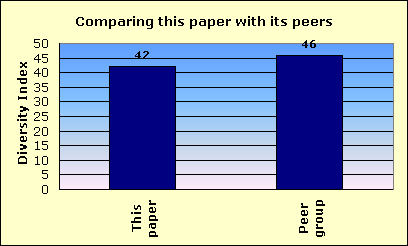
| Peer group comparison | ||||||||||
| for Houston Chronicle | ||||||||||
 |
||||||||||
| This newspaper's Newsroom Diversity Index is 42. | This paper | |||||||||
| Peer group | ||||||||||
| Compare that with 46, which is the median Diversity Index for all newspapers | ||||||||||
| reporting in this circulation category of more than 500,000 daily sales. | ||||||||||
| In that group, this newspaper's Diversity Index ranks 6 out of 10 | ||||||||||
| newspapers reporting in the category of more than 500,000 daily sales. | ||||||||||
| FYI, in circulation, this newspaper's average weekday circulation of | ||||||||||
| approximately 554,783 ranks 9 out of 1,410 daily newspapers in the US. | ||||||||||
| See the notes and definitions section below for the sources of these figures. | ||||||||||
| Details on race/ethnicity | ||||||||||
| in the circulation area | ||||||||||
| and the home county | ||||||||||
| of Houston Chronicle | ||||||||||
| Circulation area | ||||||||||
| Race/ethnicity | % of population | Number of residents | 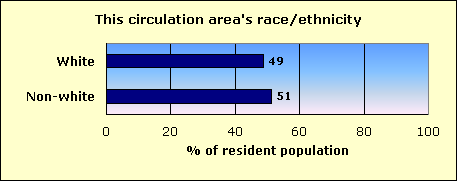
|
|||||||
| Hispanic | 28.1 | 1,318,426 | ||||||||
| Black | 16.7 | 784,890 | ||||||||
| Asian and Pacific Islander | 4.8 | 225,708 | ||||||||
| Native-American | 0.3 | 11,529 | ||||||||
| Other non-white | 0.1 | 5,801 | ||||||||
| Multi-racial | 1.2 | 57,178 | ||||||||
| Non-white | 51.2 | 2,403,532 | ||||||||
| White | 48.8 | 2,289,881 | ||||||||
| Total | 4,693,413 | |||||||||
| Home county: Harris | ||||||||||
| Race/ethnicity | % of population | Number of residents | 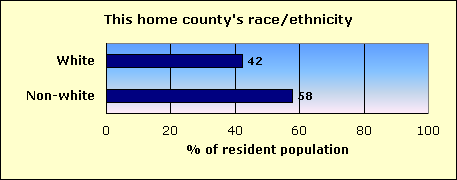
|
|||||||
| Hispanic | 32.9 | 1,119,751 | ||||||||
| Black | 18.2 | 619,694 | ||||||||
| Asian and Pacific Islander | 5.1 | 174,418 | ||||||||
| Native-American | 0.2 | 7,103 | ||||||||
| Other non-white | 0.1 | 4,499 | ||||||||
| Multi-racial | 1.3 | 42,849 | ||||||||
| Non-white | 57.9 | 1,968,314 | ||||||||
| White | 42.1 | 1,432,264 | ||||||||
| Total | 3,400,578 | |||||||||
| The home county of this newspaper is Harris. | ||||||||||
| About this report | ||||||||||
| This third annual report for the Knight Foundation adds context to an annual survey by the American Society of Newspaper Editors. ASNE has set a goal that | ||||||||||
| every newspaper, to help it know its community and gather the news, should employ at least one non-white journalist, and that newspapers should strive to | ||||||||||
| employ non-whites in proportion to their share of the community. ASNE's report, at www.asne.org, shows each newspaper's non-white employment, but does | ||||||||||
| not disclose how closely that employment mirrors the newspaper's circulation area. | ||||||||||
| That gap is filled by the report you are reading now. This report was not done by ASNE, but was done for the Knight Foundation by Bill Dedman and | ||||||||||
| Stephen K. Doig. It shows how close each newspaper is to ASNE's goal, by comparing the newsroom staffing with the circulation area population. | ||||||||||
| The full report is at www.powerreporting.com/knight. | ||||||||||
| Notes and definitions | ||||||||||
| 1. The Newsroom Diversity Index is the non-white percentage of the newsroom staff divided by the non-white percentage of the circulation area's residents. Parity = 100. | ||||||||||
| 2. Source for staffing: Survey by American Society of Newspaper Editors, April 2005. Newspapers report non-white staff as of the end of the previous year. | ||||||||||
| 3. Following ASNE's definition, newsroom staff includes only supervisors, reporters, editors, copy/layout editors and photographers. | ||||||||||
| 4. Also following ASNE's definition, "whites," "blacks," etc., exclude Hispanics, who are counted in a separate category. | ||||||||||
| 5. Source for boundaries of this newspaper's circulation area: ZIP Code circulation data, Audit Bureau of Circulations, latest available. | ||||||||||
| 6. A paper may define its circulation area differently for marketing efforts, or news coverage, or to set advertising rates. | ||||||||||
| 7. If ZIP Codes or counties are used, this report applies a threshold: 10 percent household penetration is required to include an area in the circulation area. | ||||||||||
| 8. Source for the demographics of residents of that circulation area: US Census 2000. | ||||||||||
| 9. Source for total circulation: Editor & Publisher magazine, Monday-Friday average at year-end 2004. | ||||||||||
| 10. Staff of non-English publications, such as the Miami Herald's El Nuevo Herald, are excluded from the ASNE staffing survey for the first time this year. | ||||||||||
| Demographics of ZIP Codes | ||||||||||
| where sales were reported by | ||||||||||
| Houston Chronicle | ||||||||||
| Note that some ZIP Codes listed here may not have been included in determining the newspaper's circulation area. In calculating the Diversity Index, a | ||||||||||
| ZIP Code was included only if the household penetration was at least 10 percent. Any lower-penetration ZIP Codes are also listed here for your information. | ||||||||||
| Also, if the newspaper reported more than 300 ZIP Codes, only the top 300 in weekday sales are listed here. | ||||||||||
| ZIP / City / State / Approx. distance in miles from the newspaper's home office | Weekday sales | Households | Penetration % (daily sales per 100 households) | Median household income | Non-white % of population |
Hispanic % of population |
Black % of population |
Native % of population |
Asian % of population |
|
| 77002 / Houston / TX / 0 mi. | 10,639 | 1,776 | 599.0 | $35,588 | 64.3 | 22.0 | 40.4 | 0.1 | 1.3 | |
| 77024 / Houston / TX / 9.2 mi. | 8,544 | 14,025 | 60.9 | $82,620 | 15.9 | 5.5 | 0.8 | 0.1 | 8.2 | |
| 77450 / Katy / TX / 23.2 mi. | 8,113 | 15,577 | 52.1 | $83,078 | 21.7 | 10.7 | 3.4 | 0.2 | 6.0 | |
| 77479 / Sugar Land / TX / 20.5 mi. | 7,890 | 16,512 | 47.8 | $96,118 | 40.0 | 7.6 | 6.3 | 0.2 | 23.7 | |
| 77009 / Houston / TX / 2.5 mi. | 7,151 | 14,247 | 50.2 | $32,995 | 79.8 | 72.7 | 5.8 | 0.2 | 0.6 | |
| 77379 / Spring / TX / 21.9 mi. | 7,047 | 15,101 | 46.7 | $82,706 | 19.5 | 8.9 | 3.9 | 0.2 | 5.2 | |
| 77478 / Sugar Land / TX / 18.2 mi. | 6,882 | 17,052 | 40.4 | $70,561 | 45.6 | 14.7 | 8.8 | 0.2 | 19.7 | |
| 77096 / Houston / TX / 9.1 mi. | 6,591 | 14,178 | 46.5 | $46,140 | 41.0 | 14.5 | 19.1 | 0.1 | 5.8 | |
| 77077 / Houston / TX / 15.1 mi. | 6,369 | 20,101 | 31.7 | $52,667 | 34.6 | 14.8 | 9.2 | 0.2 | 7.7 | |
| 77079 / Houston / TX / 14.5 mi. | 6,286 | 11,977 | 52.5 | $70,587 | 23.4 | 9.8 | 2.9 | 0.2 | 8.7 | |
| 77021 / Houston / TX / 4.3 mi. | 6,153 | 8,745 | 70.4 | $21,950 | 96.4 | 12.0 | 82.3 | 0.1 | 1.2 | |
| 77429 / Cypress / TX / 25 mi. | 6,102 | 14,090 | 43.3 | $78,527 | 16.1 | 9.1 | 3.0 | 0.2 | 2.6 | |
| 77084 / Houston / TX / 18.8 mi. | 6,055 | 21,932 | 27.6 | $53,075 | 41.5 | 24.3 | 8.9 | 0.3 | 5.9 | |
| 77381 / Spring / TX / 29.7 mi. | 5,942 | 12,294 | 48.3 | $91,488 | 11.4 | 5.9 | 1.6 | 0.3 | 2.6 | |
| 77004 / Houston / TX / 2.4 mi. | 5,702 | 11,614 | 49.1 | $20,840 | 88.2 | 11.8 | 71.9 | 0.2 | 2.9 | |
| 77095 / Houston / TX / 20.4 mi. | 5,620 | 13,302 | 42.2 | $76,814 | 28.2 | 12.3 | 6.5 | 0.3 | 7.5 | |
| 77057 / Houston / TX / 7.6 mi. | 5,608 | 20,060 | 28.0 | $46,563 | 34.8 | 22.6 | 4.6 | 0.2 | 5.2 | |
| 77008 / Houston / TX / 4.3 mi. | 5,603 | 12,541 | 44.7 | $39,926 | 49.9 | 43.2 | 4.2 | 0.3 | 1.1 | |
| 77005 / Houston / TX / 4.6 mi. | 5,488 | 9,469 | 58.0 | $104,035 | 13.5 | 5.6 | 1.2 | 0.1 | 5.3 | |
| 77546 / Friendswood / TX / 20 mi. | 5,362 | 13,276 | 40.4 | $70,773 | 20.5 | 9.9 | 4.3 | 0.3 | 4.6 | |
| 77020 / Houston / TX / 3.1 mi. | 5,339 | 8,269 | 64.6 | $21,864 | 96.0 | 65.2 | 30.2 | 0.2 | 0.2 | |
| 77070 / Houston / TX / 19.8 mi. | 5,329 | 12,050 | 44.2 | $60,887 | 24.5 | 12.6 | 5.6 | 0.2 | 4.7 | |
| 77036 / Houston / TX / 11.2 mi. | 5,232 | 28,311 | 18.5 | $26,931 | 85.8 | 44.7 | 24.4 | 0.2 | 14.8 | |
| 77469 / Richmond / TX / 27.2 mi. | 5,084 | 13,350 | 38.1 | $59,318 | 44.9 | 30.0 | 12.1 | 0.2 | 1.7 | |
| 77055 / Houston / TX / 8.2 mi. | 5,077 | 13,980 | 36.3 | $36,760 | 65.1 | 56.8 | 3.7 | 0.2 | 3.5 | |
| 77340 / Huntsville / TX / 66.4 mi. | 4,933 | 8,758 | 56.3 | $30,382 | 34.5 | 13.3 | 18.6 | 0.3 | 1.2 | |
| 77459 / Missouri City / TX / 17.8 mi. | 4,932 | 10,794 | 45.7 | $84,901 | 44.2 | 8.8 | 19.1 | 0.2 | 14.2 | |
| 77056 / Houston / TX / 6.4 mi. | 4,917 | 7,427 | 66.2 | $71,926 | 18.8 | 11.2 | 2.0 | 0.2 | 3.8 | |
| 77573 / League City / TX / 24.4 mi. | 4,695 | 14,639 | 32.1 | $68,458 | 23.5 | 13.4 | 5.1 | 0.3 | 3.3 | |
| 77092 / Houston / TX / 8.5 mi. | 4,549 | 14,169 | 32.1 | $32,095 | 67.1 | 45.7 | 18.6 | 0.2 | 1.5 | |
| 77339 / Humble / TX / 21.7 mi. | 4,530 | 11,432 | 39.6 | $69,242 | 13.3 | 7.8 | 1.9 | 0.3 | 2.2 | |
| 77042 / Houston / TX / 11.9 mi. | 4,506 | 18,111 | 24.9 | $41,683 | 49.4 | 20.9 | 15.8 | 0.2 | 9.6 | |
| 77040 / Houston / TX / 25.4 mi. | 4,500 | 14,554 | 30.9 | $50,183 | 47.9 | 28.6 | 10.8 | 0.2 | 6.9 | |
| 77375 / Tomball / TX / 27.4 mi. | 4,188 | 11,868 | 35.3 | $54,356 | 19.0 | 12.1 | 3.9 | 0.3 | 1.5 | |
| 77026 / Houston / TX / 3.5 mi. | 4,177 | 9,532 | 43.8 | $17,183 | 99.0 | 31.1 | 67.0 | 0.1 | 0.3 | |
| 77345 / Humble / TX / 23.7 mi. | 4,139 | 7,283 | 56.8 | $102,561 | 10.4 | 5.1 | 1.3 | 0.2 | 2.8 | |
| 77018 / Houston / TX / 6 mi. | 4,127 | 10,637 | 38.8 | $42,921 | 44.5 | 31.5 | 10.9 | 0.3 | 0.9 | |
| 77584 / Pearland / TX / 16.1 mi. | 4,025 | 10,207 | 39.4 | $70,113 | 38.0 | 18.4 | 11.0 | 0.3 | 6.8 | |
| 77025 / Houston / TX / 6.6 mi. | 3,987 | 11,075 | 36.0 | $48,232 | 42.6 | 18.1 | 11.9 | 0.1 | 10.5 | |
| 77581 / Pearland / TX / 14.3 mi. | 3,900 | 10,932 | 35.7 | $60,304 | 25.7 | 16.8 | 4.1 | 0.3 | 3.3 | |
| 77063 / Houston / TX / 9.7 mi. | 3,887 | 14,554 | 26.7 | $42,458 | 43.9 | 22.9 | 12.1 | 0.2 | 6.1 | |
| 77346 / Humble / TX / 19.1 mi. | 3,801 | 9,283 | 40.9 | $75,392 | 22.8 | 10.1 | 8.1 | 0.2 | 2.8 | |
| 77015 / Houston / TX / 11.6 mi. | 3,793 | 16,389 | 23.1 | $40,032 | 65.5 | 44.3 | 17.8 | 0.2 | 2.1 | |
| 77065 / Houston / TX / 18.5 mi. | 3,749 | 10,347 | 36.2 | $58,426 | 32.1 | 14.3 | 7.8 | 0.3 | 7.7 | |
| 77062 / Houston / TX / 18.7 mi. | 3,672 | 9,554 | 38.4 | $75,689 | 27.3 | 9.3 | 3.6 | 0.3 | 11.9 | |
| 77373 / Spring / TX / 20.9 mi. | 3,643 | 12,303 | 29.6 | $56,662 | 26.3 | 16.1 | 6.9 | 0.4 | 1.5 | |
| 77388 / Spring / TX / 21.5 mi. | 3,568 | 8,927 | 40.0 | $70,779 | 19.7 | 10.7 | 3.9 | 0.3 | 3.5 | |
| 77520 / Baytown / TX / 28.2 mi. | 3,518 | 15,822 | 22.2 | $39,735 | 48.3 | 36.8 | 9.4 | 0.3 | 0.6 | |
| 77083 / Houston / TX / 17.7 mi. | 3,513 | 15,653 | 22.4 | $52,931 | 74.2 | 26.3 | 23.8 | 0.2 | 21.1 | |
| 77007 / Houston / TX / 3.2 mi. | 3,453 | 9,250 | 37.3 | $37,785 | 64.5 | 54.3 | 7.3 | 0.2 | 1.7 | |
| 77072 / Houston / TX / 13.9 mi. | 3,441 | 15,874 | 21.7 | $33,979 | 84.0 | 35.8 | 27.4 | 0.1 | 18.6 | |
| 77043 / Houston / TX / 13.9 mi. | 3,427 | 8,305 | 41.3 | $45,141 | 54.3 | 39.0 | 5.7 | 0.2 | 7.9 | |
| 77027 / Houston / TX / 5.2 mi. | 3,342 | 8,462 | 39.5 | $60,032 | 17.5 | 9.3 | 2.8 | 0.2 | 3.6 | |
| 77087 / Houston / TX / 6.2 mi. | 3,314 | 10,328 | 32.1 | $30,346 | 89.8 | 72.5 | 15.8 | 0.1 | 0.8 | |
| 77401 / Bellaire / TX / 7 mi. | 3,289 | 6,195 | 53.1 | $87,985 | 16.9 | 7.9 | 1.0 | 0.2 | 6.5 | |
| 77099 / Houston / TX / 14.7 mi. | 3,270 | 14,152 | 23.1 | $38,589 | 81.3 | 25.8 | 30.2 | 0.2 | 22.0 | |
| 77019 / Houston / TX / 3 mi. | 3,265 | 7,888 | 41.4 | $61,899 | 29.5 | 18.9 | 6.2 | 0.3 | 3.1 | |
| 77089 / Houston / TX / 14.3 mi. | 3,252 | 12,174 | 26.7 | $53,123 | 53.9 | 28.6 | 12.5 | 0.2 | 10.8 | |
| 77088 / Houston / TX / 10 mi. | 3,247 | 15,593 | 20.8 | $39,436 | 83.2 | 22.0 | 54.0 | 0.2 | 6.0 | |
| 77571 / La Porte / TX / 19.7 mi. | 3,241 | 11,601 | 27.9 | $56,552 | 28.4 | 19.8 | 5.9 | 0.4 | 1.1 | |
| 77023 / Houston / TX / 3.7 mi. | 3,238 | 9,663 | 33.5 | $29,698 | 89.5 | 86.1 | 1.5 | 0.1 | 1.4 | |
| 77521 / Baytown / TX / 23.8 mi. | 3,234 | 13,748 | 23.5 | $46,864 | 43.2 | 22.7 | 17.6 | 0.3 | 1.4 | |
| 77069 / Houston / TX / 18.5 mi. | 3,211 | 6,807 | 47.2 | $68,662 | 15.3 | 6.0 | 3.6 | 0.2 | 4.4 | |
| 77536 / Deer Park / TX / 15.4 mi. | 3,166 | 9,663 | 32.8 | $61,082 | 19.9 | 16.0 | 1.2 | 0.4 | 1.2 | |
| 77030 / Houston / TX / 4.4 mi. | 3,124 | 5,555 | 56.2 | $53,199 | 34.4 | 9.1 | 5.6 | 0.1 | 17.1 | |
| 77035 / Houston / TX / 10.2 mi. | 3,072 | 14,327 | 21.4 | $35,524 | 75.2 | 31.0 | 37.9 | 0.1 | 4.9 | |
| 77080 / Houston / TX / 10.4 mi. | 3,055 | 15,177 | 20.1 | $34,877 | 67.4 | 56.3 | 5.0 | 0.1 | 5.0 | |
| 77064 / Houston / TX / 15.8 mi. | 3,054 | 11,838 | 25.8 | $60,945 | 49.8 | 26.0 | 9.6 | 0.2 | 12.2 | |
| 77006 / Houston / TX / 2.1 mi. | 3,010 | 10,953 | 27.5 | $41,746 | 30.8 | 20.0 | 4.2 | 0.3 | 4.2 | |
| 77076 / Houston / TX / 7 mi. | 2,955 | 8,510 | 34.7 | $28,270 | 81.0 | 72.3 | 7.6 | 0.2 | 0.5 | |
| 77022 / Houston / TX / 5 mi. | 2,933 | 9,953 | 29.5 | $23,746 | 89.2 | 64.6 | 23.7 | 0.1 | 0.4 | |
| 77586 / Seabrook / TX / 23.6 mi. | 2,894 | 7,762 | 37.3 | $64,139 | 15.2 | 8.5 | 2.2 | 0.4 | 2.7 | |
| 77090 / Houston / TX / 17.9 mi. | 2,862 | 11,491 | 24.9 | $43,965 | 42.5 | 18.4 | 17.2 | 0.3 | 4.5 | |
| 77502 / Pasadena / TX / 11.3 mi. | 2,834 | 11,296 | 25.1 | $38,375 | 53.5 | 50.4 | 1.2 | 0.3 | 0.8 | |
| 77449 / Katy / TX / 23.1 mi. | 2,806 | 12,151 | 23.1 | $59,198 | 39.9 | 25.5 | 8.5 | 0.2 | 3.7 | |
| 77017 / Houston / TX / 8.2 mi. | 2,748 | 9,654 | 28.5 | $31,762 | 81.9 | 74.3 | 2.8 | 0.2 | 4.0 | |
| 77059 / Houston / TX / 18.3 mi. | 2,747 | 5,217 | 52.7 | $104,844 | 25.0 | 6.1 | 2.6 | 0.2 | 14.5 | |
| 77550 / Galveston / TX / 46.8 mi. | 2,745 | 12,329 | 22.3 | $24,457 | 66.4 | 25.3 | 35.8 | 0.3 | 3.5 | |
| 77382 / Spring / TX / 23.8 mi. | 2,689 | 4,605 | 58.4 | $104,372 | 12.7 | 6.7 | 1.2 | 0.2 | 3.5 | |
| 77074 / Houston / TX / 10.4 mi. | 2,653 | 13,853 | 19.2 | $32,238 | 72.8 | 43.3 | 19.9 | 0.2 | 7.1 | |
| 77511 / Alvin / TX / 25.4 mi. | 2,624 | 14,782 | 17.8 | $44,042 | 31.5 | 27.7 | 1.7 | 0.3 | 0.6 | |
| 77032 / Houston / TX / 14.2 mi. | 2,612 | 3,420 | 76.4 | $25,713 | 71.6 | 34.6 | 34.3 | 0.1 | 1.3 | |
| 77033 / Houston / TX / 6.6 mi. | 2,606 | 8,875 | 29.4 | $26,544 | 98.7 | 13.7 | 83.6 | 0.1 | 0.7 | |
| 77082 / Houston / TX / 16 mi. | 2,547 | 15,479 | 16.5 | $45,598 | 59.6 | 22.2 | 19.5 | 0.2 | 14.2 | |
| 77041 / Houston / TX / 14.9 mi. | 2,517 | 7,669 | 32.8 | $56,746 | 61.0 | 36.2 | 9.6 | 0.1 | 13.5 | |
| 77477 / Stafford / TX / 15.2 mi. | 2,496 | 9,662 | 25.8 | $50,413 | 64.5 | 27.2 | 16.3 | 0.3 | 18.4 | |
| 77304 / Conroe / TX / 40.4 mi. | 2,454 | 6,517 | 37.7 | $48,804 | 17.0 | 9.8 | 5.0 | 0.2 | 1.1 | |
| 77098 / Houston / TX / 3.6 mi. | 2,450 | 7,230 | 33.9 | $47,703 | 25.2 | 17.8 | 2.0 | 0.2 | 3.6 | |
| 77058 / Houston / TX / 20.6 mi. | 2,429 | 8,089 | 30.0 | $48,744 | 28.7 | 11.8 | 5.3 | 0.5 | 8.4 | |
| 77380 / Spring / TX / 26.7 mi. | 2,406 | 7,745 | 31.1 | $55,506 | 16.5 | 9.3 | 2.8 | 0.4 | 2.7 | |
| 77061 / Houston / TX / 8.7 mi. | 2,399 | 8,923 | 26.9 | $30,440 | 84.1 | 47.9 | 28.5 | 0.1 | 6.7 | |
| 77489 / Missouri City / TX / 14.3 mi. | 2,347 | 10,099 | 23.2 | $54,066 | 92.8 | 10.4 | 78.4 | 0.1 | 2.6 | |
| 77071 / Houston / TX / 12.1 mi. | 2,291 | 9,303 | 24.6 | $43,444 | 78.1 | 14.3 | 53.4 | 0.1 | 8.5 | |
| 77045 / Houston / TX / 9.1 mi. | 2,215 | 7,462 | 29.7 | $36,543 | 95.5 | 32.9 | 60.9 | 0.2 | 1.0 | |
| 77029 / Houston / TX / 5.8 mi. | 2,169 | 5,763 | 37.6 | $30,308 | 86.4 | 55.2 | 30.4 | 0.2 | 0.1 | |
| 77505 / Pasadena / TX / 15.1 mi. | 2,161 | 7,040 | 30.7 | $60,403 | 29.1 | 21.2 | 1.7 | 0.3 | 4.6 | |
| 77539 / Dickinson / TX / 28.8 mi. | 2,049 | 9,846 | 20.8 | $40,595 | 37.2 | 22.5 | 10.6 | 0.4 | 2.3 | |
| 77356 / Montgomery / TX / 46.4 mi. | 2,047 | 5,969 | 34.3 | $64,670 | 10.1 | 4.0 | 4.4 | 0.4 | 0.7 | |
| 77054 / Houston / TX / 5.7 mi. | 2,038 | 9,303 | 21.9 | $33,799 | 68.6 | 9.6 | 36.6 | 0.2 | 19.2 | |
| 77494 / Katy / TX / 27.6 mi. | 2,023 | 3,669 | 55.1 | $86,488 | 19.2 | 8.4 | 4.0 | 0.3 | 4.9 | |
| 77012 / Houston / TX / 6.4 mi. | 2,018 | 6,717 | 30.0 | $23,910 | 96.3 | 91.7 | 3.0 | 0.1 | 1.1 | |
| 77093 / Houston / TX / 7.3 mi. | 2,001 | 12,369 | 16.2 | $26,270 | 86.5 | 72.6 | 12.8 | 0.2 | 0.4 | |
| 77566 / Lake Jackson / TX / 50 mi. | 1,982 | 10,168 | 19.5 | $61,280 | 21.8 | 14.4 | 3.7 | 0.3 | 2.4 | |
| 77066 / Houston / TX / 16.3 mi. | 1,953 | 8,862 | 22.0 | $55,760 | 63.1 | 27.3 | 21.2 | 0.2 | 12.4 | |
| 77590 / Texas City / TX / 37.5 mi. | 1,918 | 11,103 | 17.3 | $36,343 | 44.3 | 24.3 | 17.8 | 0.4 | 0.7 | |
| 77048 / Houston / TX / 9.7 mi. | 1,896 | 4,727 | 40.1 | $27,391 | 96.5 | 7.7 | 87.6 | 0.1 | 0.4 | |
| 77034 / Houston / TX / 14.5 mi. | 1,886 | 9,637 | 19.6 | $37,521 | 64.4 | 49.2 | 10.0 | 0.2 | 3.6 | |
| 77389 / Spring / TX / 26.5 mi. | 1,834 | 4,306 | 42.6 | $68,617 | 14.2 | 10.4 | 1.8 | 0.3 | 0.7 | |
| 77068 / Houston / TX / 18.6 mi. | 1,809 | 3,408 | 53.1 | $77,724 | 35.9 | 13.6 | 12.9 | 0.2 | 7.2 | |
| 77504 / Pasadena / TX / 12.8 mi. | 1,807 | 7,521 | 24.0 | $36,739 | 41.5 | 35.8 | 2.0 | 0.3 | 2.2 | |
| 77073 / Houston / TX / 16.7 mi. | 1,760 | 5,266 | 33.4 | $40,155 | 47.7 | 25.0 | 16.1 | 0.4 | 4.5 | |
| 77506 / Pasadena / TX / 10.5 mi. | 1,733 | 11,786 | 14.7 | $29,382 | 76.9 | 73.9 | 1.3 | 0.2 | 0.8 | |
| 77016 / Houston / TX / 8.1 mi. | 1,698 | 9,689 | 17.5 | $23,835 | 97.3 | 17.1 | 79.2 | 0.1 | 0.3 | |
| 77338 / Humble / TX / 18.8 mi. | 1,624 | 7,409 | 21.9 | $43,187 | 43.9 | 21.6 | 16.7 | 0.5 | 3.4 | |
| 77081 / Houston / TX / 8 mi. | 1,610 | 17,400 | 9.3 | $26,026 | 86.0 | 71.3 | 8.4 | 0.1 | 4.6 | |
| 77091 / Houston / TX / 7.9 mi. | 1,607 | 8,757 | 18.4 | $25,405 | 90.7 | 21.5 | 67.3 | 0.1 | 0.7 | |
| 77037 / Houston / TX / 9.2 mi. | 1,596 | 5,331 | 29.9 | $34,004 | 70.2 | 64.0 | 2.8 | 0.2 | 2.6 | |
| 77532 / Crosby / TX / 22 mi. | 1,595 | 7,110 | 22.4 | $49,805 | 29.4 | 9.8 | 17.8 | 0.4 | 0.4 | |
| 77493 / Katy / TX / 29.7 mi. | 1,593 | 4,582 | 34.8 | $56,235 | 30.1 | 24.8 | 3.2 | 0.2 | 0.7 | |
| 77351 / Livingston / TX / 73.5 mi. | 1,589 | 10,490 | 15.1 | $31,671 | 24.9 | 8.8 | 12.7 | 2.1 | 0.4 | |
| 77060 / Houston / TX / 12.3 mi. | 1,583 | 11,775 | 13.4 | $27,867 | 85.5 | 55.8 | 27.0 | 0.2 | 1.5 | |
| 77047 / Houston / TX / 10.5 mi. | 1,558 | 3,677 | 42.4 | $35,384 | 90.2 | 17.5 | 71.2 | 0.2 | 0.6 | |
| 77354 / Magnolia / TX / 35 mi. | 1,526 | 5,325 | 28.7 | $53,601 | 13.4 | 9.2 | 2.6 | 0.4 | 0.2 | |
| 77598 / Webster / TX / 20.9 mi. | 1,526 | 9,038 | 16.9 | $39,539 | 38.4 | 21.0 | 9.8 | 0.4 | 5.2 | |
| 77327 / Cleveland / TX / 43.8 mi. | 1,523 | 10,432 | 14.6 | $35,883 | 22.4 | 12.1 | 8.7 | 0.4 | 0.3 | |
| 77075 / Houston / TX / 11.2 mi. | 1,521 | 7,473 | 20.4 | $38,188 | 75.2 | 50.5 | 18.0 | 0.2 | 5.3 | |
| 77053 / Houston / TX / 13.4 mi. | 1,516 | 7,103 | 21.3 | $40,134 | 95.2 | 40.9 | 52.5 | 0.1 | 1.0 | |
| 77530 / Channelview / TX / 14.9 mi. | 1,457 | 8,571 | 17.0 | $42,014 | 53.0 | 37.4 | 12.2 | 0.3 | 1.9 | |
| 77301 / Conroe / TX / 38 mi. | 1,437 | 8,059 | 17.8 | $29,511 | 56.9 | 42.0 | 13.2 | 0.2 | 0.7 | |
| 77039 / Houston / TX / 10.5 mi. | 1,411 | 7,678 | 18.4 | $32,310 | 80.2 | 60.7 | 16.8 | 0.2 | 1.8 | |
| 77031 / Houston / TX / 13.2 mi. | 1,380 | 6,123 | 22.5 | $36,591 | 76.3 | 32.3 | 36.1 | 0.1 | 6.4 | |
| 77028 / Houston / TX / 6.5 mi. | 1,377 | 5,510 | 25.0 | $21,131 | 97.1 | 11.8 | 84.3 | 0.1 | 0.2 | |
| 77386 / Spring / TX / 24.7 mi. | 1,372 | 4,737 | 29.0 | $61,652 | 19.6 | 13.2 | 2.8 | 0.5 | 1.5 | |
| 77503 / Pasadena / TX / 13 mi. | 1,369 | 7,606 | 18.0 | $38,548 | 50.9 | 47.9 | 1.1 | 0.3 | 0.8 | |
| 77011 / Houston / TX / 3.5 mi. | 1,351 | 6,314 | 21.4 | $24,612 | 96.4 | 94.6 | 1.1 | 0.2 | 0.3 | |
| 77094 / Houston / TX / 19.3 mi. | 1,347 | 2,329 | 57.8 | $123,244 | 19.6 | 5.5 | 1.8 | 0.2 | 11.1 | |
| 77014 / Houston / TX / 16.5 mi. | 1,259 | 7,791 | 16.2 | $40,040 | 74.8 | 26.8 | 35.3 | 0.2 | 10.4 | |
| 77471 / Rosenberg / TX / 31.5 mi. | 1,222 | 9,065 | 13.5 | $37,164 | 61.7 | 53.2 | 7.1 | 0.2 | 0.3 | |
| 77414 / Bay City / TX / 64.7 mi. | 1,174 | 8,983 | 13.1 | $32,391 | 47.8 | 29.8 | 16.0 | 0.4 | 0.8 | |
| 77086 / Houston / TX / 13.6 mi. | 1,169 | 5,847 | 20.0 | $38,453 | 77.1 | 39.1 | 25.6 | 0.2 | 10.6 | |
| 77515 / Angleton / TX / 39.9 mi. | 1,157 | 9,441 | 12.3 | $43,603 | 37.5 | 23.5 | 11.7 | 0.4 | 0.9 | |
| 77355 / Magnolia / TX / 39.2 mi. | 1,112 | 4,704 | 23.6 | $54,829 | 12.8 | 10.5 | 0.6 | 0.4 | 0.2 | |
| 77833 / Brenham / TX / 70.6 mi. | 1,104 | 9,340 | 11.8 | $37,276 | 28.2 | 9.4 | 16.6 | 0.2 | 1.4 | |
| 77051 / Houston / TX / 7 mi. | 1,053 | 4,878 | 21.6 | $17,529 | 99.4 | 3.9 | 93.6 | 0.1 | 1.0 | |
| 77587 / South Houston / TX / 10.5 mi. | 1,028 | 4,321 | 23.8 | $31,493 | 80.5 | 78.0 | 0.9 | 0.2 | 0.7 | |
| 77049 / Houston / TX / 13.9 mi. | 1,016 | 5,120 | 19.8 | $37,972 | 69.2 | 37.3 | 27.2 | 0.2 | 3.3 | |
| 77067 / Houston / TX / 14.3 mi. | 990 | 7,903 | 12.5 | $36,856 | 90.9 | 35.8 | 44.4 | 0.1 | 8.9 | |
| 77396 / Humble / TX / 14.5 mi. | 938 | 6,720 | 14.0 | $46,167 | 52.0 | 25.2 | 23.3 | 0.4 | 1.9 | |
| 77488 / Wharton / TX / 51.6 mi. | 924 | 5,609 | 16.5 | $29,263 | 54.1 | 28.5 | 24.2 | 0.2 | 0.6 | |
| 77336 / Huffman / TX / 26.6 mi. | 907 | 3,009 | 30.1 | $51,989 | 9.4 | 6.2 | 0.9 | 0.4 | 0.8 | |
| 77535 / Dayton / TX / 32.2 mi. | 907 | 8,246 | 11.0 | $45,908 | 24.3 | 10.1 | 12.5 | 0.5 | 0.3 | |
| 77418 / Bellville / TX / 56.1 mi. | 882 | 3,366 | 26.2 | $39,407 | 21.3 | 10.1 | 9.7 | 0.3 | 0.3 | |
| 77445 / Hempstead / TX / 48.6 mi. | 879 | 3,637 | 24.2 | $33,253 | 51.8 | 20.5 | 29.8 | 0.2 | 0.4 | |
| 77385 / Conroe / TX / 29.8 mi. | 875 | 3,214 | 27.2 | $52,790 | 22.1 | 12.8 | 7.0 | 0.4 | 1.4 | |
| 77302 / Conroe / TX / 33 mi. | 865 | 4,289 | 20.2 | $46,927 | 10.6 | 7.5 | 1.0 | 0.5 | 0.5 | |
| 77365 / Porter / TX / 25.3 mi. | 851 | 5,520 | 15.4 | $38,996 | 19.0 | 15.8 | 1.3 | 0.4 | 0.5 | |
| 77318 / Willis / TX / 48.5 mi. | 847 | 3,786 | 22.4 | $55,717 | 9.3 | 5.8 | 1.5 | 0.6 | 0.5 | |
| 77038 / Houston / TX / 12 mi. | 819 | 5,920 | 13.8 | $35,325 | 85.3 | 53.1 | 23.7 | 0.3 | 7.0 | |
| 75862 / Trinity / TX / 85.1 mi. | 813 | 3,949 | 20.6 | $28,429 | 18.3 | 4.8 | 12.2 | 0.4 | 0.3 | |
| 77551 / Galveston / TX / 46.1 mi. | 805 | 9,073 | 8.9 | $34,318 | 50.2 | 30.3 | 15.5 | 0.2 | 3.1 | |
| 78934 / Columbus / TX / 71.4 mi. | 782 | 2,572 | 30.4 | $36,050 | 28.5 | 15.0 | 12.1 | 0.2 | 0.3 | |
| 77357 / New Caney / TX / 29.4 mi. | 769 | 5,737 | 13.4 | $39,342 | 15.2 | 11.5 | 1.6 | 0.5 | 0.2 | |
| 77044 / Houston / TX / 14.3 mi. | 766 | 4,177 | 18.3 | $41,231 | 57.2 | 26.9 | 28.0 | 0.3 | 0.9 | |
| 77562 / Highlands / TX / 19.5 mi. | 765 | 3,536 | 21.6 | $43,668 | 20.7 | 13.6 | 5.3 | 0.4 | 0.4 | |
| 77545 / Fresno / TX / 16.7 mi. | 749 | 1,931 | 38.8 | $47,843 | 75.9 | 47.3 | 26.4 | 0.1 | 1.1 | |
| 77575 / Liberty / TX / 43.5 mi. | 743 | 5,122 | 14.5 | $35,479 | 31.0 | 10.6 | 18.3 | 0.4 | 0.4 | |
| 77013 / Houston / TX / 7.8 mi. | 743 | 5,335 | 13.9 | $31,834 | 86.4 | 58.9 | 25.5 | 0.1 | 1.0 | |
| 77565 / Kemah / TX / 25.1 mi. | 733 | 2,762 | 26.5 | $59,180 | 21.4 | 15.2 | 2.9 | 0.4 | 1.7 | |
| 77378 / Willis / TX / 46 mi. | 732 | 3,450 | 21.2 | $35,655 | 32.2 | 19.3 | 11.2 | 0.5 | 0.2 | |
| 77384 / Conroe / TX / 34.1 mi. | 697 | 1,348 | 51.7 | $70,095 | 9.9 | 6.4 | 1.1 | 0.3 | 1.3 | |
| 77474 / Sealy / TX / 50.6 mi. | 684 | 3,859 | 17.7 | $39,355 | 34.2 | 21.4 | 11.5 | 0.2 | 0.3 | |
| 77554 / Galveston / TX / 45.5 mi. | 649 | 3,625 | 17.9 | $51,722 | 19.0 | 10.4 | 4.8 | 0.6 | 2.0 | |
| 77085 / Houston / TX / 11.7 mi. | 604 | 2,226 | 27.1 | $42,256 | 91.6 | 40.7 | 49.3 | 0.2 | 0.9 | |
| 77437 / El Campo / TX / 64.8 mi. | 592 | 5,695 | 10.4 | $31,845 | 45.0 | 35.5 | 8.7 | 0.1 | 0.2 | |
| 77541 / Freeport / TX / 56.7 mi. | 581 | 6,432 | 9.0 | $33,993 | 51.5 | 39.8 | 9.7 | 0.4 | 0.4 | |
| 77578 / Manvel / TX / 19.5 mi. | 575 | 1,884 | 30.5 | $58,708 | 20.8 | 16.2 | 2.8 | 0.2 | 0.8 | |
| 77003 / Houston / TX / 1.3 mi. | 566 | 2,518 | 22.5 | $19,252 | 95.1 | 72.4 | 20.6 | 0.2 | 1.2 | |
| 77078 / Houston / TX / 9.2 mi. | 536 | 4,140 | 12.9 | $27,556 | 94.0 | 23.7 | 69.6 | 0.1 | 0.1 | |
| 77835 / Burton / TX / 80 mi. | 515 | 856 | 60.2 | $32,411 | 23.1 | 5.0 | 16.9 | 0.3 | 0.5 | |
| 77531 / Clute / TX / 48 mi. | 513 | 5,228 | 9.8 | $36,475 | 49.7 | 40.5 | 7.2 | 0.2 | 0.8 | |
| 77447 / Hockley / TX / 33.9 mi. | 471 | 2,754 | 17.1 | $51,628 | 28.1 | 16.1 | 9.6 | 0.3 | 0.5 | |
| 77331 / Coldspring / TX / 58.6 mi. | 461 | 2,444 | 18.9 | $34,042 | 22.3 | 3.0 | 18.1 | 0.2 | 0.2 | |
| 77518 / Bacliff / TX / 28.4 mi. | 457 | 2,568 | 17.8 | $32,382 | 29.6 | 23.4 | 1.7 | 0.5 | 2.9 | |
| 77486 / West Columbia / TX / 43.5 mi. | 453 | 2,764 | 16.4 | $38,984 | 28.5 | 13.8 | 12.8 | 0.3 | 0.3 | |
| 77360 / Onalaska / TX / 73.8 mi. | 440 | 1,812 | 24.3 | $29,684 | 7.1 | 2.9 | 2.5 | 0.3 | 0.3 | |
| 77514 / Anahuac / TX / 49.3 mi. | 439 | 1,946 | 22.6 | $38,594 | 38.5 | 19.1 | 15.9 | 0.3 | 2.2 | |
| 77484 / Waller / TX / 42.1 mi. | 435 | 3,036 | 14.3 | $43,043 | 31.1 | 19.8 | 9.7 | 0.2 | 0.6 | |
| 77568 / La Marque / TX / 35.2 mi. | 430 | 5,134 | 8.4 | $34,455 | 52.5 | 15.5 | 34.9 | 0.3 | 0.5 | |
| 77547 / Galena Park / TX / 7.7 mi. | 426 | 2,695 | 15.8 | $30,731 | 80.2 | 72.0 | 7.2 | 0.2 | 0.3 | |
| 77868 / Navasota / TX / 56.9 mi. | 425 | 4,414 | 9.6 | $32,107 | 51.4 | 22.8 | 27.3 | 0.2 | 0.4 | |
| 77320 / Huntsville / TX / 67.9 mi. | 403 | 8,217 | 4.9 | $32,839 | 45.1 | 15.8 | 27.7 | 0.3 | 0.6 | |
| 77303 / Conroe / TX / 40.6 mi. | 387 | 3,985 | 9.7 | $40,378 | 15.1 | 11.9 | 1.4 | 0.6 | 0.4 | |
| 77441 / Fulshear / TX / 35 mi. | 383 | 771 | 49.7 | $74,135 | 32.1 | 11.1 | 18.4 | 0.3 | 1.3 | |
| 77422 / Brazoria / TX / 59 mi. | 382 | 4,698 | 8.1 | $41,489 | 31.0 | 12.8 | 16.3 | 0.4 | 0.4 | |
| 77372 / Splendora / TX / 35.9 mi. | 371 | 3,457 | 10.7 | $37,634 | 9.3 | 7.2 | 0.2 | 0.5 | 0.2 | |
| 77510 / Santa Fe / TX / 32.3 mi. | 368 | 4,863 | 7.6 | $50,940 | 12.2 | 10.3 | 0.4 | 0.5 | 0.2 | |
| 77563 / Hitchcock / TX / 37.8 mi. | 366 | 3,509 | 10.4 | $35,046 | 40.4 | 14.5 | 24.3 | 0.2 | 0.3 | |
| 77461 / Needville / TX / 37.4 mi. | 359 | 2,779 | 12.9 | $47,551 | 32.2 | 23.7 | 6.7 | 0.2 | 0.5 | |
| 77423 / Brookshire / TX / 37.8 mi. | 353 | 2,259 | 15.6 | $34,596 | 60.3 | 30.6 | 27.5 | 0.4 | 0.3 | |
| 77434 / Eagle Lake / TX / 59.3 mi. | 345 | 1,796 | 19.2 | $27,535 | 67.1 | 36.8 | 29.2 | 0.2 | 0.0 | |
| 77316 / Montgomery / TX / 49.1 mi. | 341 | 3,286 | 10.4 | $43,440 | 12.0 | 7.4 | 2.7 | 0.6 | 0.3 | |
| 77591 / Texas City / TX / 32.8 mi. | 340 | 4,000 | 8.5 | $32,817 | 70.3 | 9.7 | 58.1 | 0.2 | 1.3 | |
| 77583 / Rosharon / TX / 25.1 mi. | 335 | 3,204 | 10.5 | $43,718 | 59.6 | 29.5 | 25.2 | 0.6 | 3.0 | |
| 78962 / Weimar / TX / 81 mi. | 331 | 1,588 | 20.8 | $32,675 | 28.2 | 13.5 | 13.7 | 0.1 | 0.5 | |
| 77435 / East Bernard / TX / 52.6 mi. | 313 | 1,501 | 20.9 | $38,452 | 28.5 | 22.0 | 5.7 | 0.1 | 0.2 | |
| 77480 / Sweeny / TX / 55 mi. | 287 | 2,606 | 11.0 | $45,124 | 25.2 | 12.4 | 11.0 | 0.6 | 0.4 | |
| 77046 / Houston / TX / 4.9 mi. | 283 | 307 | 92.2 | $105,863 | 16.4 | 10.0 | 1.7 | 0.0 | 2.8 | |
| 77371 / Shepherd / TX / 51.5 mi. | 245 | 2,573 | 9.5 | $28,158 | 19.4 | 7.0 | 9.7 | 0.6 | 0.6 | |
| 77364 / Pointblank / TX / 69.6 mi. | 231 | 812 | 28.4 | $27,782 | 23.9 | 2.4 | 20.3 | 0.3 | 0.1 | |
| 77050 / Houston / TX / 11.4 mi. | 227 | 1,286 | 17.7 | $33,449 | 87.9 | 38.2 | 48.8 | 0.1 | 0.2 | |
| 77433 / Cypress / TX / 22.5 mi. | 192 | 1,117 | 17.2 | $49,211 | 49.7 | 32.6 | 11.4 | 0.1 | 4.3 | |
| 77362 / Pinehurst / TX / 32.5 mi. | 177 | 1,115 | 15.9 | $48,514 | 13.3 | 11.0 | 0.6 | 0.8 | 0.1 | |
| 77465 / Palacios / TX / 85.1 mi. | 165 | 2,373 | 7.0 | $32,340 | 57.1 | 42.6 | 3.3 | 0.3 | 10.0 | |
| 77306 / Conroe / TX / 38.5 mi. | 162 | 2,700 | 6.0 | $35,862 | 25.0 | 22.8 | 0.6 | 0.4 | 0.3 | |
| 77665 / Winnie / TX / 62.3 mi. | 149 | 2,408 | 6.2 | $35,395 | 21.3 | 9.7 | 10.1 | 0.3 | 0.3 | |
| 77979 / Port Lavaca / TX / 115.4 mi. | 149 | 5,958 | 2.5 | $36,397 | 52.3 | 45.4 | 3.0 | 0.3 | 3.0 | |
| 77534 / Danbury / TX / 37.8 mi. | 147 | 918 | 16.0 | $49,167 | 16.4 | 14.8 | 0.7 | 0.0 | 0.2 | |
| 77517 / Santa Fe / TX / 30.1 mi. | 131 | 1,612 | 8.1 | $53,877 | 13.7 | 11.6 | 0.3 | 0.5 | 0.4 | |
| 77830 / Anderson / TX / 67.8 mi. | 130 | 916 | 14.2 | $35,625 | 19.3 | 5.3 | 12.5 | 0.4 | 0.1 | |
| 77485 / Wallis / TX / 43.9 mi. | 129 | 894 | 14.4 | $38,389 | 34.9 | 22.7 | 10.8 | 0.2 | 0.1 | |
| 77982 / Port O Connor / TX / 131.6 mi. | 125 | 476 | 26.3 | $35,985 | 21.3 | 17.4 | 0.2 | 0.8 | 2.0 | |
| 77358 / New Waverly / TX / 54.1 mi. | 124 | 1,483 | 8.4 | $30,500 | 29.2 | 5.4 | 22.2 | 0.4 | 0.2 | |
| 77650 / Port Bolivar / TX / 47.6 mi. | 121 | 1,355 | 8.9 | $36,080 | 11.3 | 8.2 | 0.5 | 0.7 | 0.6 | |
| 77426 / Chappell Hill / TX / 59.1 mi. | 120 | 532 | 22.6 | $28,333 | 32.9 | 6.9 | 25.6 | 0.0 | 0.0 | |
| 77457 / Matagorda / TX / 73.3 mi. | 107 | 332 | 32.2 | $24,671 | 12.3 | 6.9 | 1.2 | 1.2 | 0.0 | |
| 77430 / Damon / TX / 40.6 mi. | 105 | 851 | 12.3 | $48,581 | 18.2 | 14.9 | 1.4 | 0.6 | 0.4 | |
| 78933 / Cat Spring / TX / 61.7 mi. | 101 | 305 | 33.1 | $45,417 | 6.3 | 4.7 | 0.4 | 0.1 | 0.3 | |
| 77476 / Simonton / TX / 35.7 mi. | 95 | 435 | 21.8 | $70,694 | 22.8 | 9.1 | 12.4 | 0.4 | 0.3 | |
| 77359 / Oakhurst / TX / 65.1 mi. | 94 | 251 | 37.5 | $31,167 | 24.8 | 3.7 | 20.6 | 0.0 | 0.0 | |
| 77957 / Edna / TX / 95 mi. | 93 | 3,216 | 2.9 | $34,432 | 36.9 | 24.4 | 10.7 | 0.4 | 0.6 | |
| 77368 / Romayor / TX / 57 mi. | 89 | 316 | 28.2 | $32,031 | 16.4 | 6.2 | 6.8 | 0.8 | 0.8 | |
| 77420 / Boling / TX / 49.7 mi. | 89 | 716 | 12.4 | $34,051 | 46.2 | 39.5 | 6.2 | 0.1 | 0.1 | |
| 75939 / Corrigan / TX / 94.3 mi. | 88 | 1,424 | 6.2 | $26,500 | 42.1 | 19.6 | 21.5 | 0.1 | 0.3 | |
| 77363 / Plantersville / TX / 47.6 mi. | 88 | 773 | 11.4 | $34,018 | 14.0 | 7.7 | 4.2 | 0.4 | 0.3 | |
| 77369 / Rye / TX / 59.6 mi. | 87 | 526 | 16.5 | $16,103 | 6.5 | 2.3 | 0.5 | 1.7 | 0.2 | |
| 77442 / Garwood / TX / 72.4 mi. | 84 | 482 | 17.4 | $29,821 | 34.3 | 19.8 | 13.5 | 0.0 | 0.1 | |
| 77326 / Ace / TX / 62.1 mi. | 81 | 59 | 137.3 | $22,500 | 0.7 | 0.0 | 0.0 | 0.0 | 0.0 | |
| 77831 / Bedias / TX / 76.3 mi. | 77 | 997 | 7.7 | $31,280 | 14.7 | 5.8 | 7.5 | 0.2 | 0.0 | |
| 77335 / Goodrich / TX / 63.2 mi. | 73 | 715 | 10.2 | $25,938 | 25.9 | 9.3 | 14.7 | 0.4 | 0.7 | |
| 78950 / New Ulm / TX / 69.3 mi. | 72 | 643 | 11.2 | $40,938 | 17.3 | 6.3 | 9.8 | 0.1 | 0.1 | |
| 77448 / Hungerford / TX / 49.6 mi. | 69 | 178 | 38.8 | $47,132 | 45.0 | 19.2 | 25.4 | 0.0 | 0.0 | |
| 77446 / Prairie View / TX / 43 mi. | 65 | 519 | 12.5 | $27,583 | 98.0 | 1.9 | 95.1 | 0.1 | 0.3 | |
| 77466 / Pattison / TX / 38.7 mi. | 60 | 262 | 22.9 | $46,042 | 49.8 | 36.0 | 11.2 | 0.5 | 0.5 | |
| 77561 / Hardin / TX / 46.2 mi. | 54 | 201 | 26.9 | $41,458 | 7.8 | 7.3 | 0.4 | 0.0 | 0.0 | |
| 75845 / Groveton / TX / 91.6 mi. | 53 | 1,251 | 4.2 | $21,940 | 17.7 | 6.1 | 10.5 | 0.1 | 0.0 | |
| 77577 / Liverpool / TX / 35.1 mi. | 50 | 343 | 14.6 | $43,000 | 9.9 | 6.9 | 0.9 | 0.1 | 0.1 | |
| 77553 / Galveston / TX / 46.3 mi. | 49 | 0 | 0.0 | $0 | 16.3 | 11.4 | 1.6 | 0.7 | 1.5 | |
| 77880 / Washington / TX / 65.2 mi. | 48 | 553 | 8.7 | $33,846 | 48.8 | 2.6 | 45.7 | 0.1 | 0.0 | |
| 77417 / Beasley / TX / 41.8 mi. | 48 | 615 | 7.8 | $32,173 | 52.5 | 34.5 | 15.9 | 0.1 | 0.5 | |
| 77367 / Riverside / TX / 75.6 mi. | 45 | 102 | 44.1 | $20,938 | 26.9 | 6.5 | 19.6 | 0.0 | 0.4 | |
| 77861 / Iola / TX / 79.9 mi. | 37 | 710 | 5.2 | $33,558 | 10.8 | 8.4 | 1.3 | 0.2 | 0.1 | |
| 77482 / Van Vleck / TX / 57.8 mi. | 36 | 772 | 4.7 | $32,384 | 35.4 | 20.3 | 13.7 | 0.2 | 0.1 | |
| 77533 / Daisetta / TX / 49.6 mi. | 32 | 381 | 8.4 | $29,038 | 5.0 | 2.1 | 2.2 | 0.0 | 0.0 | |
| 77538 / Devers / TX / 52.3 mi. | 32 | 300 | 10.7 | $40,500 | 28.5 | 17.7 | 9.9 | 0.0 | 0.1 | |
| 78944 / Industry / TX / 71.7 mi. | 32 | 271 | 11.8 | $43,036 | 13.2 | 6.2 | 3.7 | 0.3 | 0.7 | |
| 77564 / Hull / TX / 49.7 mi. | 30 | 837 | 3.6 | $36,689 | 4.6 | 2.3 | 1.5 | 0.4 | 0.0 | |
| 77873 / Richards / TX / 62.5 mi. | 30 | 411 | 7.3 | $33,750 | 17.7 | 6.5 | 9.9 | 0.7 | 0.2 | |
| 77475 / Sheridan / TX / 80.7 mi. | 29 | 318 | 9.1 | $24,803 | 19.0 | 15.5 | 2.1 | 0.4 | 0.0 | |
| 77464 / Orchard / TX / 35.4 mi. | 26 | 165 | 15.8 | $45,000 | 33.5 | 24.3 | 7.7 | 0.2 | 0.0 | |
| 77582 / Raywood / TX / 45.8 mi. | 24 | 277 | 8.7 | $40,000 | 45.7 | 6.1 | 33.2 | 0.7 | 0.0 | |
| 75936 / Chester / TX / 99 mi. | 22 | 309 | 7.1 | $40,556 | 19.5 | 2.6 | 15.5 | 0.1 | 0.1 | |
| 77456 / Markham / TX / 70.5 mi. | 22 | 462 | 4.8 | $42,450 | 42.2 | 32.8 | 8.5 | 0.0 | 0.1 | |
| 77962 / Ganado / TX / 83.4 mi. | 21 | 1,170 | 1.8 | $35,284 | 33.3 | 29.0 | 3.2 | 0.1 | 0.2 | |
| 77470 / Rock Island / TX / 74.5 mi. | 19 | 121 | 15.7 | $25,446 | 18.1 | 13.0 | 4.4 | 0.0 | 0.3 | |
| 77334 / Dodge / TX / 68.2 mi. | 17 | 75 | 22.7 | $28,750 | 31.0 | 4.4 | 26.1 | 0.0 | 0.0 | |
| File | tx_houston_chronicle | |||||||||
| Time | 5/17/05 6:27 PM | |||||||||
| Page | 9 | |||||||||
| Member | 145950 | |||||||||