
|
| Comparing the racial diversity of the journalists | ||||||||||
| at America's daily newspapers | ||||||||||
| with the communities that they serve | ||||||||||
| Newsroom diversity report for | ||||||||||
| Williamsport Sun-Gazette | ||||||||||
| Williamsport, Pennsylvania | ||||||||||
| Owner: Ogden Newspapers (W.V.) | ||||||||||
| From a report for the Knight Foundation | ||||||||||
| by Bill Dedman and Stephen K. Doig, June 2005 | ||||||||||
| Click here to read the national report or to select another newspaper | ||||||||||
| Year | Non-white % of newsroom staff | |||||||||
| 2005 | Did not report | |||||||||
| 2004 | 0.0 | |||||||||
| 2003 | 0.0 | |||||||||
| 2002 | 0.0 | |||||||||
| 2001 | 0.0 | |||||||||
| 2000 | 0.0 | |||||||||
| 1999 | 0.0 | |||||||||
| 1998 | Did not report | |||||||||
| 1997 | Did not report | |||||||||
| 1996 | Did not report | |||||||||
| 1995 | Did not report | |||||||||
| 1994 | Did not report | |||||||||
| 1993 | 3.8 | |||||||||
| 1992 | 0.0 | |||||||||
| 1991 | Did not report | |||||||||
| 1990 | Did not report | |||||||||
| The latest year at peak is | 1993 | |||||||||
| See the notes and definitions section below for the sources of these figures. | ||||||||||
| Newsroom Diversity Index | ||||||||||
| for Williamsport Sun-Gazette | ||||||||||
| Year | Non-white % of newsroom staff | Non-white % of circulation area | Newsroom Diversity Index (parity=100) | |||||||
| 2005 | N/A | 6.7 | N/A | |||||||
| 2004 | 0.0 | 6.7 | 0 | |||||||
| How the index is calculated | ||||||||||
| The Newsroom Diversity Index is the non-white percentage of the newsroom staff | ||||||||||
| divided by the non-white percentage of residents in the circulation area. | ||||||||||
| (Parity = 100.) | ||||||||||
| Company index | ||||||||||
| This newspaper's owner, Ogden Newspapers (W.V.), | ||||||||||
| has a companywide, circulation-weighted Diversity Index of 12. | ||||||||||
| See the notes and definitions section below for the sources of these figures. | ||||||||||
| Peer group comparison | ||||||||||
| for Williamsport Sun-Gazette | ||||||||||
| This paper | ||||||||||
| Peer group | ||||||||||
| The median Diversity Index is 44 for all newspapers | ||||||||||
| reporting in this circulation category of 25,001 to 50,000 daily sales. | ||||||||||
| An example of a newspaper of similar circulation, in an area of similar level of non-white residents, but one that has a relatively high Diversity Index, is Herald & Review, Decatur, Illinois, with a 11.1 percent non-white staff in a community that is 11 percent non-white. Its index is 101. | ||||||||||
| FYI, in circulation, this newspaper's average weekday circulation of | ||||||||||
| approximately 26,805 ranks 379 out of 1,410 daily newspapers in the US. | ||||||||||
| See the notes and definitions section below for the sources of these figures. | ||||||||||
| Details on race/ethnicity | ||||||||||
| in the circulation area | ||||||||||
| and the home county | ||||||||||
| of Williamsport Sun-Gazette | ||||||||||
| Circulation area | ||||||||||
| Race/ethnicity | % of population | Number of residents | 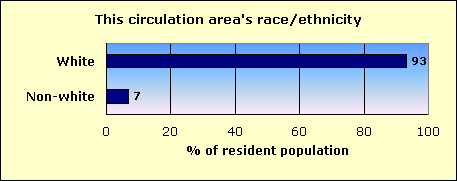
|
|||||||
| Hispanic | 1.2 | 1,987 | ||||||||
| Black | 4.0 | 6,930 | ||||||||
| Asian and Pacific Islander | 0.4 | 755 | ||||||||
| Native-American | 0.2 | 363 | ||||||||
| Other non-white | 0.1 | 96 | ||||||||
| Multi-racial | 0.8 | 1,314 | ||||||||
| Non-white | 6.7 | 11,445 | ||||||||
| White | 93.3 | 159,998 | ||||||||
| Total | 171,443 | |||||||||
| Home county: Lycoming | ||||||||||
| Race/ethnicity | % of population | Number of residents | 
|
|||||||
| Hispanic | 0.7 | 799 | ||||||||
| Black | 4.3 | 5,141 | ||||||||
| Asian and Pacific Islander | 0.4 | 515 | ||||||||
| Native-American | 0.2 | 234 | ||||||||
| Other non-white | 0.1 | 75 | ||||||||
| Multi-racial | 0.8 | 974 | ||||||||
| Non-white | 6.5 | 7,738 | ||||||||
| White | 93.6 | 112,306 | ||||||||
| Total | 120,044 | |||||||||
| The home county of this newspaper is Lycoming. | ||||||||||
| About this report | ||||||||||
| This third annual report for the Knight Foundation adds context to an annual survey by the American Society of Newspaper Editors. ASNE has set a goal that | ||||||||||
| every newspaper, to help it know its community and gather the news, should employ at least one non-white journalist, and that newspapers should strive to | ||||||||||
| employ non-whites in proportion to their share of the community. ASNE's report, at www.asne.org, shows each newspaper's non-white employment, but does | ||||||||||
| not disclose how closely that employment mirrors the newspaper's circulation area. | ||||||||||
| That gap is filled by the report you are reading now. This report was not done by ASNE, but was done for the Knight Foundation by Bill Dedman and | ||||||||||
| Stephen K. Doig. It shows how close each newspaper is to ASNE's goal, by comparing the newsroom staffing with the circulation area population. | ||||||||||
| The full report is at www.powerreporting.com/knight. | ||||||||||
| Notes and definitions | ||||||||||
| 1. The Newsroom Diversity Index is the non-white percentage of the newsroom staff divided by the non-white percentage of the circulation area's residents. Parity = 100. | ||||||||||
| 2. Source for staffing: Survey by American Society of Newspaper Editors, April 2005. Newspapers report non-white staff as of the end of the previous year. | ||||||||||
| 3. Following ASNE's definition, newsroom staff includes only supervisors, reporters, editors, copy/layout editors and photographers. | ||||||||||
| 4. Also following ASNE's definition, "whites," "blacks," etc., exclude Hispanics, who are counted in a separate category. | ||||||||||
| 5. Source for boundaries of this newspaper's circulation area: ZIP Code circulation data, Audit Bureau of Circulations, latest available. | ||||||||||
| 6. A paper may define its circulation area differently for marketing efforts, or news coverage, or to set advertising rates. | ||||||||||
| 7. If ZIP Codes or counties are used, this report applies a threshold: 10 percent household penetration is required to include an area in the circulation area. | ||||||||||
| 8. Source for the demographics of residents of that circulation area: US Census 2000. | ||||||||||
| 9. Source for total circulation: Editor & Publisher magazine, Monday-Friday average at year-end 2004. | ||||||||||
| 10. Staff of non-English publications, such as the Miami Herald's El Nuevo Herald, are excluded from the ASNE staffing survey for the first time this year. | ||||||||||
| Demographics of ZIP Codes | ||||||||||
| where sales were reported by | ||||||||||
| Williamsport Sun-Gazette | ||||||||||
| Note that some ZIP Codes listed here may not have been included in determining the newspaper's circulation area. In calculating the Diversity Index, a | ||||||||||
| ZIP Code was included only if the household penetration was at least 10 percent. Any lower-penetration ZIP Codes are also listed here for your information. | ||||||||||
| Also, if the newspaper reported more than 300 ZIP Codes, only the top 300 in weekday sales are listed here. | ||||||||||
| ZIP / City / State / Approx. distance in miles from the newspaper's home office | Weekday sales | Households | Penetration % (daily sales per 100 households) | Median household income | Non-white % of population |
Hispanic % of population |
Black % of population |
Native % of population |
Asian % of population |
|
| 17701 / Williamsport / PA / 0 mi. | 9,810 | 18,791 | 52.2 | $29,925 | 12.4 | 0.9 | 9.0 | 0.3 | 0.7 | |
| 17754 / Montoursville / PA / 7.2 mi. | 2,955 | 4,806 | 61.5 | $42,374 | 1.7 | 0.5 | 0.3 | 0.1 | 0.4 | |
| 17702 / Williamsport / PA / 1.2 mi. | 2,274 | 4,426 | 51.4 | $35,792 | 1.6 | 0.5 | 0.3 | 0.1 | 0.2 | |
| 17756 / Muncy / PA / 14.5 mi. | 1,988 | 4,338 | 45.8 | $36,199 | 5.7 | 0.9 | 3.8 | 0.2 | 0.3 | |
| 17740 / Jersey Shore / PA / 12.5 mi. | 1,837 | 5,000 | 36.7 | $35,859 | 1.3 | 0.2 | 0.3 | 0.1 | 0.2 | |
| 17737 / Hughesville / PA / 17.6 mi. | 1,074 | 2,437 | 44.1 | $34,418 | 1.3 | 0.4 | 0.2 | 0.2 | 0.1 | |
| 17728 / Cogan Station / PA / 5.8 mi. | 885 | 2,049 | 43.2 | $40,786 | 1.5 | 0.1 | 0.3 | 0.1 | 0.4 | |
| 17752 / Montgomery / PA / 7.5 mi. | 819 | 1,882 | 43.5 | $36,346 | 7.8 | 1.0 | 5.9 | 0.2 | 0.4 | |
| 16901 / Wellsboro / PA / 37.7 mi. | 559 | 4,048 | 13.8 | $32,942 | 2.0 | 0.6 | 0.3 | 0.2 | 0.5 | |
| 17744 / Linden / PA / 7.6 mi. | 529 | 1,258 | 42.1 | $35,614 | 1.7 | 0.3 | 0.6 | 0.1 | 0.2 | |
| 17771 / Trout Run / PA / 12.2 mi. | 498 | 1,353 | 36.8 | $36,659 | 1.3 | 0.5 | 0.2 | 0.2 | 0.1 | |
| 17745 / Lock Haven / PA / 25 mi. | 496 | 7,125 | 7.0 | $28,382 | 2.9 | 0.7 | 0.8 | 0.1 | 0.6 | |
| 17777 / Watsontown / PA / 12.8 mi. | 304 | 2,622 | 11.6 | $35,497 | 1.4 | 0.4 | 0.3 | 0.2 | 0.2 | |
| 16933 / Mansfield / PA / 40.7 mi. | 298 | 2,455 | 12.1 | $32,665 | 4.7 | 0.8 | 2.1 | 0.3 | 0.7 | |
| 17721 / Avis / PA / 16.3 mi. | 286 | 618 | 46.3 | $33,516 | 1.5 | 0.1 | 0.3 | 0.0 | 0.7 | |
| 17810 / Allenwood / PA / 8.8 mi. | 240 | 697 | 34.4 | $39,655 | 46.7 | 16.7 | 26.4 | 0.3 | 1.5 | |
| 17724 / Canton / PA / 29.8 mi. | 232 | 1,964 | 11.8 | $30,504 | 1.7 | 0.3 | 0.7 | 0.1 | 0.1 | |
| 16912 / Blossburg / PA / 27.6 mi. | 199 | 716 | 27.8 | $29,561 | 1.4 | 0.5 | 0.1 | 0.2 | 0.1 | |
| 17751 / Mill Hall / PA / 27 mi. | 191 | 2,599 | 7.3 | $34,282 | 1.1 | 0.3 | 0.2 | 0.1 | 0.3 | |
| 16930 / Liberty / PA / 22.8 mi. | 184 | 462 | 39.8 | $38,839 | 0.8 | 0.4 | 0.0 | 0.1 | 0.0 | |
| 17762 / Picture Rocks / PA / 15.9 mi. | 118 | 274 | 43.1 | $36,375 | 1.6 | 0.0 | 0.0 | 0.3 | 0.4 | |
| 17772 / Turbotville / PA / 17.5 mi. | 115 | 824 | 14.0 | $41,051 | 1.8 | 0.4 | 0.2 | 0.2 | 0.2 | |
| 18614 / Dushore / PA / 35.7 mi. | 113 | 1,089 | 10.4 | $31,344 | 1.9 | 0.5 | 0.0 | 0.8 | 0.1 | |
| 17765 / Roaring Branch / PA / 22.3 mi. | 104 | 373 | 27.9 | $35,526 | 1.7 | 0.1 | 0.1 | 0.5 | 0.1 | |
| 17758 / Muncy Valley / PA / 28.2 mi. | 103 | 413 | 24.9 | $34,191 | 1.3 | 0.3 | 0.1 | 0.0 | 0.1 | |
| 17774 / Unityville / PA / 25.7 mi. | 98 | 442 | 22.2 | $35,417 | 0.2 | 0.0 | 0.1 | 0.0 | 0.0 | |
| 16917 / Covington / PA / 33.8 mi. | 93 | 533 | 17.4 | $32,054 | 2.6 | 0.6 | 0.1 | 0.4 | 0.2 | |
| 16938 / Morris / PA / 25.1 mi. | 90 | 318 | 28.3 | $29,338 | 1.5 | 0.4 | 0.1 | 0.4 | 0.3 | |
| 17837 / Lewisburg / PA / 17.9 mi. | 88 | 5,536 | 1.6 | $41,280 | 11.7 | 3.1 | 5.8 | 0.1 | 1.7 | |
| 17815 / Bloomsburg / PA / 32.8 mi. | 72 | 10,359 | 0.7 | $35,291 | 4.0 | 1.1 | 1.2 | 0.1 | 0.8 | |
| 17821 / Danville / PA / 24.7 mi. | 67 | 7,276 | 0.9 | $38,539 | 3.7 | 0.9 | 0.9 | 0.0 | 1.3 | |
| 17747 / Loganton / PA / 21.7 mi. | 64 | 932 | 6.9 | $34,410 | 1.9 | 0.8 | 0.2 | 0.1 | 0.2 | |
| 17776 / Waterville / PA / 17.3 mi. | 63 | 223 | 28.3 | $35,813 | 1.3 | 0.9 | 0.2 | 0.2 | 0.0 | |
| 17748 / Mc Elhattan / PA / 19.3 mi. | 59 | 36 | 163.9 | $86,178 | 0.9 | 0.0 | 0.0 | 0.0 | 0.9 | |
| 16946 / Tioga / PA / 46.2 mi. | 58 | 958 | 6.1 | $32,689 | 0.9 | 0.2 | 0.1 | 0.2 | 0.0 | |
| 18616 / Forksville / PA / 28.7 mi. | 58 | 287 | 20.2 | $32,292 | 4.4 | 0.5 | 0.8 | 2.3 | 0.3 | |
| 18626 / Laporte / PA / 29.8 mi. | 57 | 108 | 52.8 | $40,417 | 1.0 | 0.0 | 0.3 | 0.6 | 0.0 | |
| 17763 / Ralston / PA / 18.3 mi. | 47 | 105 | 44.8 | $30,357 | 1.9 | 0.0 | 1.2 | 0.8 | 0.0 | |
| 17731 / Eagles Mere / PA / 25.2 mi. | 45 | 158 | 28.5 | $36,111 | 1.3 | 0.3 | 0.0 | 0.0 | 0.0 | |
| 16911 / Arnot / PA / 29.3 mi. | 37 | 138 | 26.8 | $28,571 | 0.0 | 0.0 | 0.0 | 0.0 | 0.0 | |
| 18619 / Hillsgrove / PA / 20.5 mi. | 36 | 124 | 29.0 | $30,781 | 1.4 | 0.4 | 0.0 | 0.0 | 0.4 | |
| 17847 / Milton / PA / 19.3 mi. | 35 | 4,726 | 0.7 | $33,883 | 4.5 | 1.5 | 1.6 | 0.1 | 0.2 | |
| 16920 / Elkland / PA / 52.9 mi. | 26 | 755 | 3.4 | $26,034 | 2.4 | 0.8 | 0.8 | 0.2 | 0.0 | |
| 16822 / Beech Creek / PA / 37.1 mi. | 21 | 817 | 2.6 | $33,413 | 1.5 | 0.3 | 0.1 | 0.2 | 0.3 | |
| 16935 / Middlebury Center / PA / 47.1 mi. | 20 | 478 | 4.2 | $34,083 | 1.9 | 0.9 | 0.0 | 0.2 | 0.1 | |
| 16929 / Lawrenceville / PA / 50.4 mi. | 19 | 858 | 2.2 | $32,800 | 1.1 | 0.5 | 0.1 | 0.1 | 0.1 | |
| 16950 / Westfield / PA / 53.6 mi. | 17 | 1,203 | 1.4 | $29,737 | 1.8 | 0.6 | 0.4 | 0.2 | 0.1 | |
| 16947 / Troy / PA / 39 mi. | 14 | 1,828 | 0.8 | $33,716 | 1.8 | 0.5 | 0.3 | 0.2 | 0.3 | |
| 17764 / Renovo / PA / 40.8 mi. | 10 | 1,178 | 0.8 | $24,325 | 0.9 | 0.2 | 0.2 | 0.2 | 0.1 | |
| File | pa_williamsport_sun-gazette | |||||||||
| Time | 5/21/05 8:45 AM | |||||||||
| Page | 379 | |||||||||
| Member | 142600 | |||||||||