
|
| Comparing the racial diversity of the journalists | ||||||||||
| at America's daily newspapers | ||||||||||
| with the communities that they serve | ||||||||||
| Newsroom diversity report for | ||||||||||
| Philadelphia Daily News | ||||||||||
| Philadelphia, Pennsylvania | ||||||||||
| Owner: Knight Ridder (Calif.) | ||||||||||
| From a report for the Knight Foundation | ||||||||||
| by Bill Dedman and Stephen K. Doig, June 2005 | ||||||||||
| Click here to read the national report or to select another newspaper | ||||||||||
| Year | Non-white % of newsroom staff | 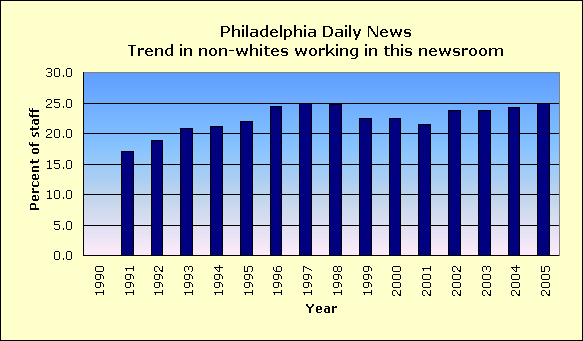
|
||||||||
| 2005 | 25.0 | |||||||||
| 2004 | 24.3 | |||||||||
| 2003 | 23.7 | |||||||||
| 2002 | 23.7 | |||||||||
| 2001 | 21.5 | |||||||||
| 2000 | 22.4 | |||||||||
| 1999 | 22.4 | |||||||||
| 1998 | 24.7 | |||||||||
| 1997 | 25.0 | |||||||||
| 1996 | 24.5 | |||||||||
| 1995 | 21.9 | |||||||||
| 1994 | 21.2 | |||||||||
| 1993 | 20.9 | |||||||||
| 1992 | 18.8 | |||||||||
| 1991 | 17.0 | |||||||||
| 1990 | Did not report | |||||||||
| The latest year at peak is | 2005 | |||||||||
| See the notes and definitions section below for the sources of these figures. | ||||||||||
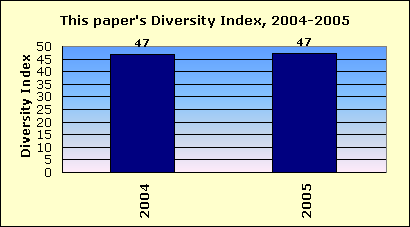
| Newsroom Diversity Index | ||||||||||
| for Philadelphia Daily News | ||||||||||
 |
||||||||||
| Year | Non-white % of newsroom staff | Non-white % of circulation area | Newsroom Diversity Index (parity=100) | |||||||
| 2005 | 25.0 | 53.2 | 47 | |||||||
| 2004 | 24.3 | 51.8 | 47 | |||||||
| How the index is calculated | ||||||||||
| The Newsroom Diversity Index is the non-white percentage of the newsroom staff | ||||||||||
| divided by the non-white percentage of residents in the circulation area. | ||||||||||
| (Parity = 100.) | ||||||||||
| Company index | ||||||||||
| This newspaper's owner, Knight Ridder (Calif.), | ||||||||||
| has a companywide, circulation-weighted Diversity Index of 76. | ||||||||||
| See the notes and definitions section below for the sources of these figures. | ||||||||||
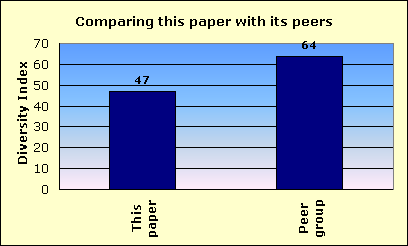
| Peer group comparison | ||||||||||
| for Philadelphia Daily News | ||||||||||
 |
||||||||||
| This newspaper's Newsroom Diversity Index is 47. | This paper | |||||||||
| Peer group | ||||||||||
| Compare that with 64, which is the median Diversity Index for all newspapers | ||||||||||
| reporting in this circulation category of 100,001 to 250,000 daily sales. | ||||||||||
| In that group, this newspaper's Diversity Index ranks 44 out of 58 | ||||||||||
| newspapers reporting in the category of 100,001 to 250,000 daily sales. | ||||||||||
| An example of a newspaper of similar circulation, in an area of similar level of non-white residents, but one that has a relatively high Diversity Index, is San Antonio Express-News, Texas, with a 30.6 percent non-white staff in a community that is 57.9 percent non-white. Its index is 53. | ||||||||||
| FYI, in circulation, this newspaper's average weekday circulation of | ||||||||||
| approximately 135,956 ranks 82 out of 1,410 daily newspapers in the US. | ||||||||||
| See the notes and definitions section below for the sources of these figures. | ||||||||||
| Details on race/ethnicity | ||||||||||
| in the circulation area | ||||||||||
| and the home county | ||||||||||
| of Philadelphia Daily News | ||||||||||
| Circulation area | ||||||||||
| Race/ethnicity | % of population | Number of residents | 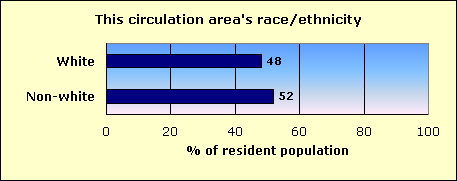
|
|||||||
| Hispanic | 8.2 | 82,966 | ||||||||
| Black | 36.9 | 374,955 | ||||||||
| Asian and Pacific Islander | 4.8 | 49,040 | ||||||||
| Native-American | 0.2 | 1,886 | ||||||||
| Other non-white | 0.2 | 1,775 | ||||||||
| Multi-racial | 1.6 | 16,318 | ||||||||
| Non-white | 51.8 | 526,940 | ||||||||
| White | 48.2 | 489,535 | ||||||||
| Total | 1,016,475 | |||||||||
| Home county: Philadelphia | ||||||||||
| Race/ethnicity | % of population | Number of residents | 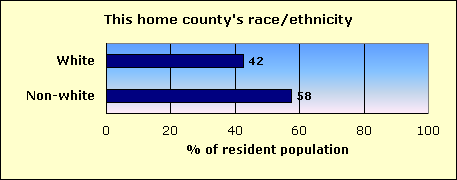
|
|||||||
| Hispanic | 8.5 | 128,928 | ||||||||
| Black | 42.6 | 646,123 | ||||||||
| Asian and Pacific Islander | 4.5 | 67,614 | ||||||||
| Native-American | 0.2 | 2,908 | ||||||||
| Other non-white | 0.2 | 2,856 | ||||||||
| Multi-racial | 1.6 | 24,726 | ||||||||
| Non-white | 57.5 | 873,155 | ||||||||
| White | 42.5 | 644,395 | ||||||||
| Total | 1,517,550 | |||||||||
| The home county of this newspaper is Philadelphia. | ||||||||||
| About this report | ||||||||||
| This third annual report for the Knight Foundation adds context to an annual survey by the American Society of Newspaper Editors. ASNE has set a goal that | ||||||||||
| every newspaper, to help it know its community and gather the news, should employ at least one non-white journalist, and that newspapers should strive to | ||||||||||
| employ non-whites in proportion to their share of the community. ASNE's report, at www.asne.org, shows each newspaper's non-white employment, but does | ||||||||||
| not disclose how closely that employment mirrors the newspaper's circulation area. | ||||||||||
| That gap is filled by the report you are reading now. This report was not done by ASNE, but was done for the Knight Foundation by Bill Dedman and | ||||||||||
| Stephen K. Doig. It shows how close each newspaper is to ASNE's goal, by comparing the newsroom staffing with the circulation area population. | ||||||||||
| The full report is at www.powerreporting.com/knight. | ||||||||||
| Notes and definitions | ||||||||||
| 1. The Newsroom Diversity Index is the non-white percentage of the newsroom staff divided by the non-white percentage of the circulation area's residents. Parity = 100. | ||||||||||
| 2. Source for staffing: Survey by American Society of Newspaper Editors, April 2005. Newspapers report non-white staff as of the end of the previous year. | ||||||||||
| 3. Following ASNE's definition, newsroom staff includes only supervisors, reporters, editors, copy/layout editors and photographers. | ||||||||||
| 4. Also following ASNE's definition, "whites," "blacks," etc., exclude Hispanics, who are counted in a separate category. | ||||||||||
| 5. Source for boundaries of this newspaper's circulation area: ZIP Code circulation data, Audit Bureau of Circulations, latest available. | ||||||||||
| 6. A paper may define its circulation area differently for marketing efforts, or news coverage, or to set advertising rates. | ||||||||||
| 7. If ZIP Codes or counties are used, this report applies a threshold: 10 percent household penetration is required to include an area in the circulation area. | ||||||||||
| 8. Source for the demographics of residents of that circulation area: US Census 2000. | ||||||||||
| 9. Source for total circulation: Editor & Publisher magazine, Monday-Friday average at year-end 2004. | ||||||||||
| 10. Staff of non-English publications, such as the Miami Herald's El Nuevo Herald, are excluded from the ASNE staffing survey for the first time this year. | ||||||||||
| Demographics of ZIP Codes | ||||||||||
| where sales were reported by | ||||||||||
| Philadelphia Daily News | ||||||||||
| Note that some ZIP Codes listed here may not have been included in determining the newspaper's circulation area. In calculating the Diversity Index, a | ||||||||||
| ZIP Code was included only if the household penetration was at least 10 percent. Any lower-penetration ZIP Codes are also listed here for your information. | ||||||||||
| Also, if the newspaper reported more than 300 ZIP Codes, only the top 300 in weekday sales are listed here. | ||||||||||
| ZIP / City / State / Approx. distance in miles from the newspaper's home office | Weekday sales | Households | Penetration % (daily sales per 100 households) | Median household income | Non-white % of population |
Hispanic % of population |
Black % of population |
Native % of population |
Asian % of population |
|
| 19130 / Philadelphia / PA / 3.1 mi. | 5,287 | 11,642 | 45.4 | $38,668 | 44.0 | 7.6 | 30.6 | 0.2 | 3.4 | |
| 19104 / Philadelphia / PA / 4.2 mi. | 4,648 | 17,125 | 27.1 | $16,151 | 68.8 | 3.0 | 50.8 | 0.3 | 12.2 | |
| 19140 / Philadelphia / PA / 0.6 mi. | 3,827 | 18,859 | 20.3 | $20,077 | 96.1 | 34.5 | 58.9 | 0.3 | 1.2 | |
| 19124 / Philadelphia / PA / 2 mi. | 3,800 | 22,349 | 17.0 | $28,574 | 50.6 | 18.8 | 25.2 | 0.2 | 4.3 | |
| 19103 / Philadelphia / PA / 4.3 mi. | 3,329 | 13,490 | 24.7 | $37,959 | 20.0 | 3.6 | 6.5 | 0.1 | 8.1 | |
| 19148 / Philadelphia / PA / 5.5 mi. | 3,225 | 19,157 | 16.8 | $27,097 | 28.4 | 4.8 | 10.3 | 0.1 | 10.8 | |
| 19145 / Philadelphia / PA / 5.9 mi. | 2,702 | 18,107 | 14.9 | $26,655 | 49.2 | 1.8 | 37.0 | 0.1 | 8.8 | |
| 19107 / William Penn Annex West / PA / 3.7 mi. | 2,628 | 6,686 | 39.3 | $24,448 | 39.9 | 3.8 | 11.7 | 0.2 | 21.9 | |
| 19102 / Philadelphia / PA / 3.7 mi. | 2,566 | 2,566 | 100.0 | $35,625 | 24.5 | 3.2 | 7.9 | 0.3 | 10.9 | |
| 19144 / Philadelphia / PA / 2.7 mi. | 2,503 | 19,597 | 12.8 | $27,436 | 85.8 | 1.8 | 80.3 | 0.3 | 1.3 | |
| 19134 / Philadelphia / PA / 1.4 mi. | 2,450 | 19,888 | 12.3 | $20,903 | 48.8 | 32.2 | 12.7 | 0.2 | 2.1 | |
| 19132 / Philadelphia / PA / 1.8 mi. | 2,427 | 15,684 | 15.5 | $18,777 | 99.2 | 1.3 | 96.4 | 0.2 | 0.3 | |
| 19139 / Philadelphia / PA / 5.5 mi. | 2,212 | 17,443 | 12.7 | $21,329 | 97.3 | 1.2 | 93.1 | 0.3 | 1.1 | |
| 19111 / Rhawnhurst / PA / 4.3 mi. | 2,186 | 24,039 | 9.1 | $37,996 | 18.5 | 6.2 | 5.9 | 0.1 | 4.7 | |
| 19141 / Philadelphia / PA / 2 mi. | 2,132 | 12,151 | 17.5 | $28,861 | 91.0 | 2.5 | 82.6 | 0.2 | 3.8 | |
| 19143 / Philadelphia / PA / 6.2 mi. | 2,079 | 26,497 | 7.8 | $25,826 | 94.3 | 1.4 | 89.7 | 0.2 | 1.1 | |
| 19131 / Philadelphia / PA / 4.5 mi. | 2,049 | 19,130 | 10.7 | $30,099 | 82.8 | 1.7 | 76.4 | 0.2 | 2.4 | |
| 19153 / Philadelphia / PA / 9 mi. | 2,012 | 5,226 | 38.5 | $36,872 | 65.0 | 1.9 | 59.1 | 0.2 | 1.8 | |
| 19147 / Philadelphia / PA / 4.5 mi. | 1,851 | 15,857 | 11.7 | $34,431 | 36.2 | 4.9 | 16.6 | 0.2 | 12.1 | |
| 19120 / Philadelphia / PA / 2 mi. | 1,807 | 22,315 | 8.1 | $31,588 | 80.9 | 23.6 | 39.6 | 0.2 | 14.0 | |
| 19136 / Philadelphia / PA / 6 mi. | 1,767 | 13,395 | 13.2 | $35,650 | 25.3 | 4.9 | 18.0 | 0.2 | 1.2 | |
| 19114 / Torresdale South / PA / 7.5 mi. | 1,714 | 13,365 | 12.8 | $41,592 | 13.8 | 3.4 | 6.5 | 0.1 | 2.6 | |
| 19135 / Philadelphia / PA / 4.4 mi. | 1,636 | 12,230 | 13.4 | $34,584 | 9.4 | 3.8 | 3.3 | 0.1 | 0.9 | |
| 19106 / William Penn Annex East / PA / 3.6 mi. | 1,581 | 5,368 | 29.5 | $61,720 | 14.3 | 2.9 | 6.2 | 0.1 | 3.9 | |
| 19082 / Upper Darby / PA / 7.5 mi. | 1,550 | 14,765 | 10.5 | $34,926 | 41.0 | 2.4 | 20.2 | 0.1 | 15.3 | |
| 19146 / Philadelphia / PA / 4.9 mi. | 1,497 | 14,854 | 10.1 | $24,803 | 79.5 | 2.5 | 72.2 | 0.3 | 2.9 | |
| 19154 / Philadelphia / PA / 9 mi. | 1,487 | 12,868 | 11.6 | $51,949 | 12.1 | 3.2 | 5.3 | 0.1 | 2.3 | |
| 19128 / Philadelphia / PA / 5.1 mi. | 1,467 | 15,859 | 9.3 | $43,629 | 12.3 | 1.9 | 6.5 | 0.2 | 2.4 | |
| 19149 / Philadelphia / PA / 3.9 mi. | 1,455 | 18,997 | 7.7 | $37,210 | 21.1 | 7.5 | 6.2 | 0.1 | 5.7 | |
| 19020 / Eddington / PA / 12 mi. | 1,322 | 20,702 | 6.4 | $50,305 | 18.9 | 4.5 | 5.8 | 0.2 | 7.0 | |
| 19125 / Philadelphia / PA / 1.8 mi. | 1,280 | 8,524 | 15.0 | $28,679 | 22.1 | 10.8 | 3.8 | 0.2 | 5.3 | |
| 19401 / Norristown / PA / 12.8 mi. | 1,264 | 14,865 | 8.5 | $38,852 | 44.3 | 8.9 | 29.5 | 0.1 | 3.3 | |
| 19121 / Philadelphia / PA / 2.6 mi. | 1,259 | 12,604 | 10.0 | $15,888 | 98.4 | 1.5 | 95.4 | 0.2 | 0.5 | |
| 19428 / West Conshohocken / PA / 9.6 mi. | 1,161 | 7,024 | 16.5 | $49,517 | 11.9 | 1.3 | 6.2 | 0.1 | 3.4 | |
| 19142 / Philadelphia / PA / 7.3 mi. | 1,068 | 9,907 | 10.8 | $25,973 | 68.6 | 2.3 | 53.9 | 0.2 | 10.2 | |
| 19116 / Philadelphia / PA / 9.4 mi. | 1,043 | 12,550 | 8.3 | $44,776 | 17.4 | 3.2 | 3.9 | 0.1 | 8.4 | |
| 19150 / Philadelphia / PA / 4.7 mi. | 1,041 | 9,995 | 10.4 | $42,342 | 97.9 | 1.1 | 94.6 | 0.2 | 0.2 | |
| 19138 / Philadelphia / PA / 3.6 mi. | 947 | 12,304 | 7.7 | $32,248 | 98.5 | 1.2 | 94.9 | 0.3 | 0.3 | |
| 19152 / Philadelphia / PA / 5.5 mi. | 929 | 13,280 | 7.0 | $37,760 | 15.5 | 4.8 | 4.0 | 0.1 | 5.1 | |
| 19122 / Philadelphia / PA / 1.9 mi. | 928 | 5,629 | 16.5 | $18,395 | 84.5 | 33.8 | 46.2 | 0.1 | 1.9 | |
| 19115 / Philadelphia / PA / 7.3 mi. | 898 | 13,719 | 6.5 | $39,075 | 15.0 | 3.3 | 3.4 | 0.1 | 7.0 | |
| 19119 / Philadelphia / PA / 5.7 mi. | 847 | 11,986 | 7.1 | $46,520 | 73.1 | 1.9 | 67.3 | 0.3 | 0.9 | |
| 19406 / Norristown / PA / 12.8 mi. | 804 | 9,664 | 8.3 | $61,987 | 17.7 | 2.0 | 4.4 | 0.1 | 9.8 | |
| 19703 / Claymont / DE / 20.9 mi. | 729 | 6,432 | 11.3 | $42,009 | 32.4 | 3.8 | 24.7 | 0.2 | 1.9 | |
| 19123 / Philadelphia / PA / 2.7 mi. | 726 | 4,176 | 17.4 | $21,096 | 78.0 | 11.0 | 63.7 | 0.2 | 1.5 | |
| 19129 / Philadelphia / PA / 2.4 mi. | 720 | 4,131 | 17.4 | $36,465 | 44.8 | 2.1 | 38.4 | 0.3 | 2.4 | |
| 19004 / Cynwyd / PA / 4.9 mi. | 714 | 3,749 | 19.0 | $78,932 | 8.2 | 1.4 | 2.1 | 0.1 | 3.9 | |
| 19050 / Yeadon / PA / 8.1 mi. | 704 | 11,654 | 6.0 | $46,225 | 49.6 | 1.2 | 43.6 | 0.1 | 2.5 | |
| 08012 / Turnersville / NJ / 14.7 mi. | 685 | 14,510 | 4.7 | $53,479 | 15.0 | 2.9 | 8.2 | 0.1 | 2.6 | |
| 19133 / Philadelphia / PA / 0.9 mi. | 669 | 8,631 | 7.8 | $13,828 | 98.1 | 56.8 | 40.0 | 0.2 | 0.4 | |
| 18974 / Warwick / PA / 13.3 mi. | 660 | 13,429 | 4.9 | $56,580 | 10.0 | 4.1 | 2.8 | 0.1 | 2.0 | |
| 19018 / Westbrook Park / PA / 9.8 mi. | 646 | 9,813 | 6.6 | $43,524 | 10.1 | 1.1 | 4.2 | 0.1 | 3.9 | |
| 19001 / Roslyn / PA / 7.8 mi. | 640 | 6,346 | 10.1 | $57,284 | 18.3 | 2.0 | 12.1 | 0.1 | 2.9 | |
| 19137 / Philadelphia / PA / 1.9 mi. | 632 | 3,191 | 19.8 | $31,761 | 5.8 | 2.9 | 1.0 | 0.4 | 0.4 | |
| 19151 / Philadelphia / PA / 6.1 mi. | 624 | 11,983 | 5.2 | $33,840 | 77.3 | 1.9 | 71.2 | 0.2 | 1.7 | |
| 19087 / Wayne / PA / 12.4 mi. | 600 | 12,274 | 4.9 | $85,058 | 9.1 | 1.6 | 2.7 | 0.1 | 3.9 | |
| 19426 / Trappe / PA / 19.2 mi. | 595 | 9,523 | 6.2 | $77,497 | 15.5 | 2.4 | 9.9 | 0.1 | 2.3 | |
| 19026 / Pilgrim Gardens / PA / 9.1 mi. | 578 | 12,867 | 4.5 | $49,780 | 7.3 | 1.0 | 1.8 | 0.1 | 3.7 | |
| 19372 / Thorndale / PA / 28.1 mi. | 578 | 504 | 114.7 | $63,958 | 18.3 | 3.5 | 9.2 | 0.0 | 3.5 | |
| 19038 / Wyndmoor / PA / 6.3 mi. | 572 | 11,907 | 4.8 | $62,822 | 17.2 | 1.3 | 12.2 | 0.1 | 2.6 | |
| 19090 / Willow Grove / PA / 9.1 mi. | 564 | 7,485 | 7.5 | $51,042 | 21.8 | 1.6 | 15.8 | 0.1 | 2.9 | |
| 08096 / Woodbury / NJ / 11.5 mi. | 558 | 12,443 | 4.5 | $49,702 | 16.2 | 2.6 | 10.8 | 0.2 | 1.3 | |
| 19044 / Horsham / PA / 11.5 mi. | 557 | 6,606 | 8.4 | $55,901 | 14.4 | 1.8 | 5.3 | 0.1 | 6.0 | |
| 19083 / Manoa / PA / 8.8 mi. | 549 | 13,292 | 4.1 | $62,545 | 5.4 | 0.8 | 0.9 | 0.1 | 2.8 | |
| 19063 / Wawa / PA / 14.7 mi. | 547 | 14,433 | 3.8 | $60,821 | 10.4 | 1.1 | 5.9 | 0.1 | 2.4 | |
| 08054 / Rancocas Woods / NJ / 11.5 mi. | 528 | 16,570 | 3.2 | $63,750 | 14.3 | 2.2 | 6.8 | 0.1 | 3.8 | |
| 19053 / Upper Holland / PA / 12 mi. | 520 | 9,263 | 5.6 | $54,650 | 8.2 | 1.6 | 4.3 | 0.1 | 1.6 | |
| 19355 / Malvern / PA / 20.3 mi. | 507 | 8,279 | 6.1 | $76,466 | 8.2 | 1.4 | 2.7 | 0.1 | 3.1 | |
| 19008 / Marple Township / PA / 11.2 mi. | 492 | 7,372 | 6.7 | $59,479 | 7.8 | 0.6 | 0.9 | 0.1 | 5.7 | |
| 08401 / Atlantic City / NJ / 53.8 mi. | 489 | 15,848 | 3.1 | $26,969 | 80.6 | 25.0 | 42.4 | 0.2 | 10.3 | |
| 19002 / Prospectville / PA / 11 mi. | 483 | 11,273 | 4.3 | $70,504 | 12.5 | 1.3 | 5.7 | 0.1 | 4.6 | |
| 19007 / West Bristol / PA / 15.1 mi. | 477 | 8,495 | 5.6 | $36,883 | 28.4 | 8.9 | 14.2 | 0.2 | 3.1 | |
| 19013 / Village Green / PA / 15.7 mi. | 453 | 13,596 | 3.3 | $25,429 | 82.0 | 5.2 | 74.8 | 0.2 | 0.6 | |
| 19061 / Upper Chichester / PA / 19.1 mi. | 439 | 9,894 | 4.4 | $52,760 | 8.2 | 1.4 | 4.2 | 0.1 | 1.6 | |
| 08080 / Sewell / NJ / 16.1 mi. | 425 | 11,751 | 3.6 | $70,418 | 10.9 | 1.9 | 4.6 | 0.1 | 3.4 | |
| 19403 / Norristown / PA / 14.9 mi. | 421 | 15,788 | 2.7 | $61,712 | 12.9 | 1.7 | 6.5 | 0.1 | 3.9 | |
| 08053 / Pine Grove / NJ / 15.1 mi. | 415 | 15,032 | 2.8 | $66,642 | 10.3 | 2.0 | 3.1 | 0.1 | 4.2 | |
| 08031 / Gloucester City / NJ / 9.1 mi. | 401 | 4,639 | 8.6 | $43,987 | 10.1 | 3.9 | 1.7 | 0.0 | 3.0 | |
| 18966 / Southampton / PA / 13.5 mi. | 398 | 14,334 | 2.8 | $69,140 | 3.6 | 0.8 | 0.5 | 0.1 | 1.6 | |
| 08002 / Erlton / NJ / 7.3 mi. | 388 | 8,190 | 4.7 | $52,121 | 18.2 | 3.5 | 5.3 | 0.1 | 7.9 | |
| 08034 / Cherry Hill Township / NJ / 8.9 mi. | 382 | 7,283 | 5.2 | $66,284 | 13.8 | 2.7 | 3.8 | 0.1 | 6.1 | |
| 08109 / Pennsauken / NJ / 5.5 mi. | 378 | 8,436 | 4.5 | $49,289 | 25.8 | 7.5 | 13.5 | 0.1 | 3.3 | |
| 08081 / Sicklerville / NJ / 18.5 mi. | 369 | 14,066 | 2.6 | $61,366 | 33.3 | 3.5 | 25.9 | 0.2 | 2.1 | |
| 19713 / Newark / DE / 36.2 mi. | 369 | 12,070 | 3.1 | $49,910 | 24.6 | 4.8 | 14.3 | 0.2 | 3.3 | |
| 19006 / Huntingdon Valley / PA / 8.8 mi. | 365 | 7,752 | 4.7 | $73,385 | 6.5 | 1.2 | 0.7 | 0.0 | 3.9 | |
| 19003 / Ardmore / PA / 8.4 mi. | 358 | 5,604 | 6.4 | $60,263 | 18.7 | 2.2 | 12.0 | 0.1 | 3.0 | |
| 19023 / Darby / PA / 8.7 mi. | 355 | 7,438 | 4.8 | $35,970 | 40.8 | 1.0 | 36.4 | 0.2 | 1.2 | |
| 19464 / Stowe / PA / 28.5 mi. | 351 | 16,576 | 2.1 | $43,631 | 16.4 | 3.0 | 10.7 | 0.2 | 0.8 | |
| 19126 / Philadelphia / PA / 3.2 mi. | 347 | 5,925 | 5.9 | $34,607 | 88.7 | 2.8 | 80.1 | 0.2 | 3.4 | |
| 19096 / Wynnewood / PA / 6.8 mi. | 339 | 5,304 | 6.4 | $86,861 | 8.0 | 1.2 | 2.5 | 0.0 | 3.2 | |
| 08260 / Wildwood Crest / NJ / 67.4 mi. | 334 | 6,936 | 4.8 | $30,487 | 16.4 | 8.1 | 6.2 | 0.2 | 0.5 | |
| 08021 / Pine Valley / NJ / 14.3 mi. | 327 | 18,410 | 1.8 | $41,160 | 28.6 | 4.9 | 19.0 | 0.3 | 2.5 | |
| 19444 / Miquon / PA / 7.7 mi. | 321 | 3,802 | 8.4 | $84,835 | 6.9 | 1.0 | 2.3 | 0.0 | 3.0 | |
| 19034 / Upper Dublin / PA / 9.1 mi. | 316 | 2,123 | 14.9 | $78,311 | 8.8 | 0.9 | 2.4 | 0.1 | 4.7 | |
| 19095 / Wyncote / PA / 5.3 mi. | 314 | 2,744 | 11.4 | $64,940 | 30.4 | 1.1 | 25.0 | 0.1 | 2.7 | |
| 19010 / Rosemont / PA / 10.1 mi. | 306 | 8,020 | 3.8 | $71,753 | 15.1 | 1.6 | 5.1 | 0.1 | 7.0 | |
| 08360 / Vineland / NJ / 34.4 mi. | 302 | 14,281 | 2.1 | $36,163 | 53.5 | 37.3 | 13.2 | 0.4 | 0.8 | |
| 19015 / Upland / PA / 15.3 mi. | 302 | 6,552 | 4.6 | $45,185 | 20.4 | 1.6 | 16.6 | 0.2 | 1.0 | |
| 19460 / Phoenixville / PA / 21.5 mi. | 297 | 12,972 | 2.3 | $55,989 | 9.9 | 2.0 | 4.6 | 0.1 | 2.3 | |
| 08108 / Westmont / NJ / 6.8 mi. | 296 | 7,850 | 3.8 | $49,530 | 8.5 | 3.3 | 2.5 | 0.2 | 1.7 | |
| 19118 / Springfield / PA / 6.1 mi. | 296 | 4,316 | 6.9 | $60,179 | 21.8 | 2.3 | 15.2 | 0.2 | 2.4 | |
| 08043 / Voorhees Township / NJ / 13.4 mi. | 295 | 10,489 | 2.8 | $68,402 | 23.4 | 2.5 | 7.9 | 0.1 | 11.4 | |
| 19422 / Penllyn / PA / 11.8 mi. | 295 | 6,966 | 4.2 | $86,659 | 15.5 | 1.4 | 5.5 | 0.0 | 7.8 | |
| 19462 / Plymouth Valley / PA / 9.7 mi. | 289 | 5,423 | 5.3 | $58,365 | 10.1 | 1.1 | 3.7 | 0.1 | 4.4 | |
| 19036 / Manor / PA / 10.2 mi. | 277 | 5,491 | 5.0 | $42,998 | 7.0 | 0.8 | 3.9 | 0.1 | 1.5 | |
| 08077 / Riverton / NJ / 7.2 mi. | 275 | 6,123 | 4.5 | $66,844 | 8.8 | 1.5 | 4.5 | 0.2 | 1.7 | |
| 19033 / Milmont Park / PA / 12.1 mi. | 274 | 3,254 | 8.4 | $48,908 | 4.4 | 0.6 | 1.9 | 0.0 | 1.2 | |
| 19454 / North Wales / PA / 14.9 mi. | 269 | 9,530 | 2.8 | $65,383 | 17.1 | 1.4 | 5.1 | 0.1 | 9.4 | |
| 08026 / Gibbsboro / NJ / 13.8 mi. | 267 | 829 | 32.2 | $57,326 | 7.2 | 2.4 | 2.8 | 0.1 | 1.1 | |
| 19720 / New Castle / DE / 31.2 mi. | 258 | 20,530 | 1.3 | $46,669 | 39.8 | 7.3 | 29.1 | 0.2 | 1.7 | |
| 19701 / Bear / DE / 37.5 mi. | 256 | 11,214 | 2.3 | $65,020 | 23.3 | 3.4 | 15.7 | 0.2 | 2.6 | |
| 19073 / Newtown Square / PA / 13.9 mi. | 255 | 6,362 | 4.0 | $70,915 | 4.6 | 0.7 | 0.7 | 0.1 | 2.6 | |
| 08052 / Maple Shade / NJ / 7.6 mi. | 253 | 8,462 | 3.0 | $45,426 | 19.0 | 4.5 | 7.0 | 0.1 | 6.1 | |
| 08094 / Williamstown / NJ / 22.5 mi. | 252 | 11,808 | 2.1 | $50,206 | 16.8 | 3.4 | 10.6 | 0.2 | 1.2 | |
| 18976 / Warrington / PA / 15.3 mi. | 248 | 5,465 | 4.5 | $65,332 | 6.3 | 1.7 | 1.8 | 0.1 | 2.1 | |
| 19040 / Hatboro / PA / 11.2 mi. | 248 | 7,948 | 3.1 | $52,200 | 4.6 | 1.4 | 1.4 | 0.1 | 1.3 | |
| 18936 / Montgomeryville / PA / 16.4 mi. | 247 | 2 | 12350.0 | $50,208 | 80.0 | 0.0 | 0.0 | 0.0 | 80.0 | |
| 08030 / Gloucester City / NJ / 7.6 mi. | 246 | 4,981 | 4.9 | $38,243 | 4.3 | 2.0 | 0.8 | 0.1 | 0.7 | |
| 19094 / Woodlyn / PA / 13.5 mi. | 246 | 1,750 | 14.1 | $37,436 | 17.2 | 1.5 | 12.9 | 0.3 | 1.2 | |
| 19014 / Twin Oaks / PA / 17.4 mi. | 240 | 7,554 | 3.2 | $59,807 | 9.4 | 1.2 | 6.2 | 0.1 | 1.1 | |
| 19046 / Rydal / PA / 6.3 mi. | 240 | 8,116 | 3.0 | $58,960 | 7.9 | 1.2 | 2.5 | 0.0 | 3.4 | |
| 19067 / Yardley / PA / 21.7 mi. | 240 | 20,323 | 1.2 | $69,894 | 13.0 | 2.3 | 6.7 | 0.1 | 3.0 | |
| 18969 / Telford / PA / 23.4 mi. | 236 | 5,400 | 4.4 | $55,221 | 8.0 | 2.5 | 1.6 | 0.1 | 2.7 | |
| 19320 / Valley Township / PA / 33.4 mi. | 236 | 14,748 | 1.6 | $49,649 | 29.3 | 4.5 | 22.5 | 0.2 | 0.5 | |
| 19064 / Springfield / PA / 11.1 mi. | 234 | 8,701 | 2.7 | $65,554 | 4.1 | 0.7 | 0.8 | 0.1 | 2.1 | |
| 19405 / Norristown / PA / 12.3 mi. | 232 | 2,179 | 10.6 | $39,299 | 8.7 | 3.3 | 2.0 | 0.1 | 1.8 | |
| 08060 / Westampton Township / NJ / 17.2 mi. | 230 | 13,301 | 1.7 | $58,022 | 27.7 | 6.1 | 16.0 | 0.2 | 3.0 | |
| 19047 / Upper Holland / PA / 14 mi. | 220 | 10,963 | 2.0 | $68,377 | 7.4 | 1.6 | 2.5 | 0.1 | 2.6 | |
| 08003 / Woodcrest / NJ / 11.3 mi. | 219 | 10,733 | 2.0 | $87,248 | 17.9 | 1.8 | 4.1 | 0.1 | 11.2 | |
| 08102 / Camden / NJ / 4 mi. | 215 | 2,557 | 8.4 | $16,573 | 92.4 | 53.5 | 36.6 | 0.2 | 1.0 | |
| 08055 / Medford Township / NJ / 18.2 mi. | 214 | 9,685 | 2.2 | $81,863 | 3.9 | 1.2 | 0.7 | 0.1 | 1.3 | |
| 08203 / Brigantine City / NJ / 54 mi. | 213 | 5,473 | 3.9 | $44,639 | 20.5 | 9.4 | 3.4 | 0.1 | 5.7 | |
| 19056 / Newportville / PA / 15.3 mi. | 212 | 5,567 | 3.8 | $54,481 | 9.7 | 2.5 | 3.5 | 0.1 | 2.3 | |
| 19021 / Croydon / PA / 12.9 mi. | 209 | 3,788 | 5.5 | $46,678 | 8.8 | 3.7 | 2.8 | 0.3 | 1.3 | |
| 18964 / Souderton / PA / 21.2 mi. | 205 | 4,814 | 4.3 | $54,225 | 7.3 | 2.7 | 0.9 | 0.1 | 2.9 | |
| 19709 / Middletown / DE / 43.1 mi. | 204 | 6,497 | 3.1 | $67,650 | 15.0 | 2.8 | 10.3 | 0.1 | 0.8 | |
| 19076 / Prospect Park / PA / 11.5 mi. | 203 | 2,605 | 7.8 | $45,305 | 4.9 | 0.9 | 1.3 | 0.1 | 1.7 | |
| 19801 / Wilmington / DE / 26.8 mi. | 203 | 5,884 | 3.5 | $24,375 | 91.0 | 6.7 | 81.9 | 0.2 | 0.6 | |
| 18915 / Colmar / PA / 17.4 mi. | 200 | 295 | 67.8 | $62,250 | 8.5 | 2.9 | 1.7 | 0.8 | 1.7 | |
| 19031 / Flourtown / PA / 7.5 mi. | 199 | 1,759 | 11.3 | $65,700 | 6.8 | 0.9 | 3.3 | 0.0 | 2.0 | |
| 19079 / Sharon Hill / PA / 9.4 mi. | 197 | 3,359 | 5.9 | $36,932 | 55.8 | 1.3 | 51.6 | 0.1 | 1.0 | |
| 18932 / Line Lexington / PA / 19.6 mi. | 196 | 191 | 102.6 | $61,094 | 2.4 | 1.2 | 0.0 | 0.0 | 1.2 | |
| 19029 / Tinicum Township / PA / 11.9 mi. | 195 | 1,704 | 11.4 | $42,598 | 3.7 | 1.3 | 0.8 | 0.1 | 0.5 | |
| 08110 / Pennsauken / NJ / 4.6 mi. | 193 | 5,131 | 3.8 | $44,443 | 61.9 | 22.8 | 29.4 | 0.4 | 7.0 | |
| 08086 / Thorofare / NJ / 11.2 mi. | 191 | 2,196 | 8.7 | $51,146 | 9.0 | 1.3 | 5.7 | 0.4 | 0.9 | |
| 08093 / Westville Grove / NJ / 9.2 mi. | 189 | 3,988 | 4.7 | $43,696 | 18.8 | 4.3 | 11.3 | 0.2 | 1.3 | |
| 19301 / Paoli / PA / 17.6 mi. | 186 | 2,774 | 6.7 | $67,464 | 9.2 | 0.9 | 4.1 | 0.1 | 3.5 | |
| 17603 / West Lancaster / PA / 59.8 mi. | 182 | 23,271 | 0.8 | $38,086 | 24.7 | 14.6 | 6.3 | 0.2 | 2.0 | |
| 18917 / Dublin / PA / 24 mi. | 182 | 851 | 21.4 | $48,235 | 6.1 | 1.9 | 1.3 | 0.2 | 1.3 | |
| 08016 / Burlington Township / NJ / 15.1 mi. | 179 | 11,264 | 1.6 | $54,114 | 33.1 | 3.8 | 24.1 | 0.2 | 2.9 | |
| 08009 / Tansboro / NJ / 18.7 mi. | 178 | 4,282 | 4.2 | $55,369 | 13.8 | 3.2 | 7.5 | 0.2 | 1.6 | |
| 08402 / Margate City / NJ / 53.6 mi. | 178 | 3,984 | 4.5 | $45,876 | 6.0 | 2.7 | 0.8 | 0.0 | 1.6 | |
| 08078 / Runnemede / NJ / 10.5 mi. | 175 | 3,317 | 5.3 | $40,811 | 10.2 | 3.6 | 3.7 | 0.1 | 1.6 | |
| 08104 / South Camden / NJ / 5.7 mi. | 175 | 8,204 | 2.1 | $23,878 | 89.1 | 23.0 | 62.9 | 0.2 | 1.0 | |
| 19025 / Jarrettown / PA / 9.7 mi. | 173 | 1,808 | 9.6 | $99,231 | 16.2 | 0.9 | 5.7 | 0.1 | 8.8 | |
| 08065 / Palmyra / NJ / 6.1 mi. | 172 | 3,004 | 5.7 | $51,150 | 20.4 | 3.2 | 14.0 | 0.3 | 1.4 | |
| 08075 / Riverside / NJ / 9 mi. | 170 | 9,912 | 1.7 | $52,873 | 15.2 | 3.4 | 6.9 | 0.1 | 1.9 | |
| 18954 / Southampton / PA / 15 mi. | 170 | 3,109 | 5.5 | $94,228 | 3.7 | 0.7 | 0.5 | 0.0 | 1.9 | |
| 08098 / Woodstown / NJ / 24.7 mi. | 165 | 2,928 | 5.6 | $55,490 | 16.5 | 2.2 | 12.6 | 0.2 | 0.8 | |
| 08057 / Moorestown / NJ / 9.3 mi. | 163 | 7,077 | 2.3 | $78,441 | 11.8 | 1.7 | 5.5 | 0.1 | 3.2 | |
| 08302 / Seabrook / NJ / 36.9 mi. | 162 | 13,576 | 1.2 | $35,835 | 50.1 | 15.1 | 30.6 | 1.4 | 1.1 | |
| 08079 / Salem / NJ / 33.4 mi. | 160 | 4,722 | 3.4 | $37,114 | 36.8 | 3.0 | 31.4 | 0.4 | 0.3 | |
| 18074 / Perkiomenville / PA / 27.6 mi. | 160 | 1,958 | 8.2 | $62,260 | 3.2 | 0.7 | 0.7 | 0.2 | 0.5 | |
| 19072 / Penn Valley / PA / 6.3 mi. | 160 | 4,188 | 3.8 | $74,609 | 6.5 | 1.3 | 1.3 | 0.0 | 2.9 | |
| 19054 / Levittown / PA / 18.6 mi. | 156 | 6,367 | 2.5 | $52,377 | 6.9 | 1.8 | 2.3 | 0.1 | 1.5 | |
| 08232 / West Atlantic City / NJ / 48.5 mi. | 155 | 5,960 | 2.6 | $37,370 | 81.2 | 22.1 | 54.8 | 0.1 | 1.8 | |
| 18901 / New Britain / PA / 20 mi. | 155 | 17,087 | 0.9 | $72,965 | 5.3 | 1.5 | 1.7 | 0.1 | 1.3 | |
| 08083 / Somerdale / NJ / 11.6 mi. | 154 | 3,749 | 4.1 | $51,613 | 20.3 | 3.1 | 13.0 | 0.1 | 2.7 | |
| 08210 / Swainton / NJ / 61 mi. | 152 | 4,971 | 3.1 | $50,250 | 12.7 | 1.7 | 8.5 | 0.1 | 1.5 | |
| 19601 / Reading / PA / 45.4 mi. | 152 | 11,593 | 1.3 | $24,891 | 62.1 | 42.7 | 15.6 | 0.3 | 1.3 | |
| 08247 / Stone Harbor / NJ / 64.1 mi. | 151 | 632 | 23.9 | $51,875 | 1.6 | 0.5 | 0.8 | 0.0 | 0.1 | |
| 08226 / Ocean City / NJ / 54.6 mi. | 147 | 7,464 | 2.0 | $44,158 | 7.6 | 2.0 | 4.1 | 0.1 | 0.6 | |
| 19032 / Folcroft / PA / 10.2 mi. | 146 | 2,504 | 5.8 | $44,292 | 6.5 | 1.1 | 3.6 | 0.1 | 0.9 | |
| 08107 / Woodlynne / NJ / 6.7 mi. | 145 | 5,596 | 2.6 | $41,019 | 23.1 | 7.7 | 9.0 | 0.2 | 4.9 | |
| 19070 / Rutledge / PA / 11.3 mi. | 145 | 2,785 | 5.2 | $51,269 | 14.8 | 0.8 | 10.6 | 0.1 | 2.5 | |
| 08244 / Somers Point / NJ / 51.5 mi. | 142 | 4,952 | 2.9 | $42,341 | 17.4 | 6.0 | 6.7 | 0.2 | 3.2 | |
| 19078 / Ridley Park / PA / 12.4 mi. | 142 | 4,611 | 3.1 | $48,506 | 3.4 | 0.6 | 0.7 | 0.0 | 1.3 | |
| 19425 / Chester Springs / PA / 25.4 mi. | 142 | 2,676 | 5.3 | $89,312 | 5.1 | 1.2 | 1.6 | 0.1 | 1.7 | |
| 19804 / Wilmington / DE / 29.9 mi. | 142 | 7,439 | 1.9 | $46,012 | 15.2 | 5.5 | 7.6 | 0.2 | 0.9 | |
| 19027 / Melrose Park / PA / 0.9 mi. | 141 | 7,669 | 1.8 | $58,833 | 40.0 | 2.1 | 28.9 | 0.1 | 7.3 | |
| 19707 / Hockessin / DE / 31.1 mi. | 141 | 5,283 | 2.7 | $97,403 | 12.2 | 2.0 | 2.5 | 0.1 | 6.9 | |
| 08051 / Mantua Heights / NJ / 14.1 mi. | 140 | 4,221 | 3.3 | $51,404 | 7.2 | 1.4 | 3.5 | 0.2 | 1.3 | |
| 08097 / Woodbury Heights / NJ / 12.2 mi. | 139 | 1,116 | 12.5 | $63,024 | 10.0 | 1.2 | 7.2 | 0.2 | 0.9 | |
| 18940 / Wrightstown / PA / 18.2 mi. | 136 | 9,780 | 1.4 | $81,571 | 6.6 | 1.3 | 1.0 | 0.0 | 3.4 | |
| 08028 / Glassboro / NJ / 20.1 mi. | 134 | 6,602 | 2.0 | $44,805 | 28.4 | 3.9 | 20.1 | 0.2 | 2.4 | |
| 08628 / West Trenton / NJ / 22.7 mi. | 134 | 3,599 | 3.7 | $66,627 | 25.8 | 4.8 | 17.4 | 0.1 | 2.5 | |
| 08406 / Ventnor Heights / NJ / 53.7 mi. | 133 | 5,480 | 2.4 | $42,478 | 29.2 | 17.1 | 2.5 | 0.1 | 7.3 | |
| 19802 / Wilmington / DE / 25.3 mi. | 133 | 9,948 | 1.3 | $36,057 | 80.5 | 3.2 | 75.0 | 0.2 | 0.5 | |
| 08330 / Weymouth / NJ / 42.7 mi. | 131 | 7,704 | 1.7 | $49,960 | 31.3 | 7.6 | 18.5 | 0.2 | 3.3 | |
| 19805 / Wilmington / DE / 28.2 mi. | 129 | 15,288 | 0.8 | $36,493 | 48.4 | 19.0 | 27.2 | 0.2 | 0.9 | |
| 18201 / Pardeesville / PA / 74.3 mi. | 126 | 15,416 | 0.8 | $29,994 | 5.4 | 3.7 | 0.5 | 0.1 | 0.6 | |
| 08070 / Pennsville / NJ / 29.8 mi. | 125 | 5,223 | 2.4 | $47,321 | 4.3 | 1.6 | 0.9 | 0.1 | 1.0 | |
| 08010 / Edgewater Park / NJ / 11.5 mi. | 123 | 4,136 | 3.0 | $48,162 | 35.1 | 6.1 | 22.8 | 0.1 | 2.6 | |
| 19127 / Philadelphia / PA / 4.7 mi. | 123 | 2,526 | 4.9 | $43,490 | 6.6 | 1.0 | 3.1 | 0.2 | 1.4 | |
| 08106 / Camden / NJ / 8 mi. | 121 | 4,169 | 2.9 | $47,220 | 3.4 | 1.4 | 0.4 | 0.1 | 0.8 | |
| 19446 / Lansdale / PA / 16.8 mi. | 121 | 20,014 | 0.6 | $60,797 | 14.0 | 2.0 | 3.5 | 0.1 | 7.2 | |
| 08332 / Millville / NJ / 40.5 mi. | 120 | 12,544 | 1.0 | $40,471 | 26.9 | 9.9 | 14.0 | 0.5 | 0.7 | |
| 19333 / Devon / PA / 14.5 mi. | 120 | 3,182 | 3.8 | $76,034 | 12.1 | 1.4 | 2.8 | 0.1 | 7.0 | |
| 08046 / Willingboro / NJ / 12.5 mi. | 118 | 10,713 | 1.1 | $60,869 | 77.1 | 6.1 | 65.5 | 0.3 | 1.7 | |
| 08204 / West Cape May / NJ / 67.5 mi. | 117 | 7,781 | 1.5 | $40,766 | 6.6 | 2.1 | 2.9 | 0.2 | 0.6 | |
| 19043 / Holmes / PA / 11 mi. | 117 | 1,083 | 10.8 | $46,151 | 3.5 | 0.9 | 1.2 | 0.0 | 0.6 | |
| 08037 / Sweetwater / NJ / 30.2 mi. | 116 | 7,683 | 1.5 | $47,500 | 19.9 | 13.7 | 4.2 | 0.1 | 0.9 | |
| 19030 / Fairless Hills / PA / 17.9 mi. | 116 | 5,084 | 2.3 | $53,761 | 10.5 | 2.8 | 3.2 | 0.2 | 3.2 | |
| 08071 / Pitman / NJ / 17.8 mi. | 113 | 3,666 | 3.1 | $50,596 | 3.8 | 1.4 | 0.9 | 0.1 | 0.6 | |
| 19012 / Cheltenham / PA / 3.7 mi. | 113 | 2,296 | 4.9 | $63,583 | 27.3 | 2.7 | 14.0 | 0.1 | 8.9 | |
| 08033 / Tavistock / NJ / 8.5 mi. | 111 | 6,687 | 1.7 | $72,340 | 5.6 | 1.6 | 1.6 | 0.1 | 1.5 | |
| 08648 / Trenton / NJ / 26.8 mi. | 111 | 10,298 | 1.1 | $66,345 | 23.9 | 4.7 | 9.5 | 0.1 | 7.9 | |
| 18076 / Red Hill / PA / 29.5 mi. | 111 | 954 | 11.6 | $47,875 | 3.3 | 1.5 | 0.3 | 0.0 | 0.2 | |
| 19468 / Royersford / PA / 22.5 mi. | 107 | 8,186 | 1.3 | $60,536 | 5.8 | 1.2 | 2.3 | 0.1 | 1.4 | |
| 17101 / Harrisburg / PA / 87.6 mi. | 105 | 1,457 | 7.2 | $20,315 | 37.1 | 4.5 | 27.5 | 0.3 | 2.2 | |
| 17109 / Progress / PA / 85.3 mi. | 102 | 10,311 | 1.0 | $39,755 | 25.3 | 3.1 | 17.2 | 0.1 | 3.0 | |
| 19382 / West Chester / PA / 23.2 mi. | 101 | 17,820 | 0.6 | $70,832 | 12.1 | 2.5 | 6.2 | 0.1 | 2.4 | |
| 19610 / Wyomissing / PA / 46.4 mi. | 100 | 5,982 | 1.7 | $61,814 | 7.1 | 2.0 | 1.3 | 0.1 | 2.8 | |
| 19022 / Eddystone / PA / 13.4 mi. | 99 | 1,611 | 6.1 | $32,432 | 14.2 | 2.4 | 9.0 | 0.2 | 1.1 | |
| 19342 / Glen Mills / PA / 19.4 mi. | 99 | 4,627 | 2.1 | $80,448 | 12.4 | 1.7 | 7.8 | 0.1 | 2.0 | |
| 08105 / East Camden / NJ / 4.4 mi. | 97 | 9,207 | 1.1 | $27,485 | 94.3 | 51.9 | 36.0 | 0.3 | 4.4 | |
| 08066 / West Deptford / NJ / 12.2 mi. | 96 | 3,486 | 2.8 | $36,848 | 32.5 | 4.1 | 25.7 | 0.2 | 0.6 | |
| 08242 / Rio Grande / NJ / 64.9 mi. | 96 | 1,211 | 7.9 | $29,891 | 12.0 | 2.9 | 6.1 | 0.1 | 0.9 | |
| 19075 / Oreland / PA / 7.4 mi. | 96 | 2,781 | 3.5 | $63,042 | 7.8 | 1.0 | 4.1 | 0.2 | 1.8 | |
| 19317 / Chadds Ford / PA / 25.4 mi. | 96 | 3,368 | 2.9 | $93,308 | 6.1 | 1.7 | 0.9 | 0.0 | 2.9 | |
| 08103 / Camden / NJ / 4.6 mi. | 93 | 4,585 | 2.0 | $23,139 | 95.8 | 26.4 | 67.3 | 0.3 | 0.3 | |
| 17111 / Wilhelm / PA / 83.4 mi. | 93 | 10,834 | 0.9 | $47,666 | 20.8 | 3.6 | 13.3 | 0.1 | 2.4 | |
| 19113 / Philadelphia / PA / 11.6 mi. | 93 | 45 | 206.7 | $70,833 | 0.0 | 0.0 | 0.0 | 0.0 | 0.0 | |
| 19465 / Pottstown / PA / 28.9 mi. | 93 | 5,385 | 1.7 | $57,191 | 3.3 | 0.8 | 1.3 | 0.1 | 0.5 | |
| 19074 / Norwood / PA / 11.1 mi. | 92 | 2,286 | 4.0 | $47,043 | 3.0 | 0.7 | 1.1 | 0.1 | 0.7 | |
| 08251 / Villas / NJ / 64.3 mi. | 89 | 4,143 | 2.1 | $33,726 | 5.2 | 2.3 | 1.3 | 0.2 | 0.4 | |
| 08611 / Trenton / NJ / 22.9 mi. | 89 | 8,673 | 1.0 | $30,960 | 59.0 | 37.0 | 18.9 | 0.2 | 1.0 | |
| 08619 / Trenton / NJ / 26.5 mi. | 89 | 9,214 | 1.0 | $57,696 | 11.4 | 3.5 | 3.5 | 0.1 | 3.1 | |
| 18103 / Allentown / PA / 41.4 mi. | 89 | 24,225 | 0.4 | $38,738 | 23.7 | 14.4 | 4.6 | 0.1 | 3.1 | |
| 19475 / Spring City / PA / 24 mi. | 87 | 3,692 | 2.4 | $51,671 | 6.5 | 1.1 | 3.3 | 0.2 | 0.8 | |
| 08001 / Paradise Lakes / NJ / 30.3 mi. | 85 | 148 | 57.4 | $50,682 | 10.0 | 2.6 | 5.7 | 0.0 | 0.0 | |
| 08004 / West Atco / NJ / 20.9 mi. | 85 | 4,932 | 1.7 | $57,261 | 14.1 | 2.3 | 9.3 | 0.2 | 1.0 | |
| 18017 / Freemansburg / PA / 43.1 mi. | 85 | 14,048 | 0.6 | $47,033 | 17.3 | 11.5 | 2.3 | 0.1 | 2.4 | |
| 18073 / Red Hill / PA / 29.9 mi. | 85 | 2,535 | 3.4 | $56,761 | 2.9 | 1.2 | 0.8 | 0.1 | 0.3 | |
| 19901 / Leipsic / DE / 58.5 mi. | 85 | 12,301 | 0.7 | $37,974 | 38.2 | 4.5 | 27.9 | 0.7 | 2.3 | |
| 08059 / West Collingswood Heights / NJ / 8.3 mi. | 78 | 2,181 | 3.6 | $44,973 | 4.1 | 2.1 | 0.6 | 0.1 | 0.8 | |
| 08221 / Steelmanville / NJ / 50.7 mi. | 77 | 2,647 | 2.9 | $60,000 | 6.1 | 1.8 | 1.0 | 0.1 | 2.4 | |
| 08049 / Magnolia / NJ / 10.8 mi. | 76 | 2,076 | 3.7 | $46,250 | 23.2 | 4.1 | 16.0 | 0.2 | 1.2 | |
| 19344 / Honey Brook / PA / 38 mi. | 76 | 3,399 | 2.2 | $49,484 | 3.5 | 1.1 | 1.1 | 0.2 | 0.3 | |
| 19606 / Stony Creek Mills / PA / 41.5 mi. | 76 | 11,710 | 0.6 | $51,181 | 6.7 | 3.1 | 1.7 | 0.1 | 1.1 | |
| 08027 / Gibbstown / NJ / 13.5 mi. | 72 | 1,864 | 3.9 | $53,454 | 6.4 | 1.5 | 3.1 | 0.1 | 0.7 | |
| 19041 / Haverford / PA / 8.3 mi. | 71 | 2,485 | 2.9 | $84,324 | 10.9 | 1.9 | 4.5 | 0.1 | 3.5 | |
| 19312 / Tredyffrin / PA / 16.3 mi. | 69 | 4,107 | 1.7 | $94,085 | 8.1 | 1.0 | 2.8 | 0.1 | 3.4 | |
| 08095 / Winslow / NJ / 26 mi. | 67 | 66 | 101.5 | $26,806 | 19.6 | 9.2 | 6.0 | 0.0 | 0.5 | |
| 08403 / Longport / NJ / 53.9 mi. | 67 | 587 | 11.4 | $51,176 | 2.0 | 0.5 | 0.1 | 0.0 | 1.1 | |
| 17042 / Rocherty / PA / 66.9 mi. | 67 | 13,429 | 0.5 | $41,887 | 8.0 | 4.5 | 1.5 | 0.1 | 1.3 | |
| 18360 / Stroudsburg / PA / 63.6 mi. | 64 | 10,019 | 0.6 | $46,039 | 11.5 | 4.7 | 4.0 | 0.2 | 1.4 | |
| 19057 / Levittown / PA / 16.1 mi. | 63 | 6,206 | 1.0 | $48,352 | 13.4 | 2.7 | 8.2 | 0.2 | 1.0 | |
| 08328 / Malaga / NJ / 28 mi. | 62 | 504 | 12.3 | $58,833 | 11.0 | 4.5 | 4.3 | 0.5 | 0.3 | |
| 18701 / Wilkes Barre / PA / 87.8 mi. | 62 | 1,349 | 4.6 | $15,656 | 10.7 | 2.3 | 5.1 | 0.1 | 1.7 | |
| 19367 / Pomeroy / PA / 39.2 mi. | 62 | 74 | 83.8 | $41,875 | 5.8 | 0.0 | 2.9 | 0.0 | 1.2 | |
| 18042 / Williams Township / PA / 44.1 mi. | 61 | 14,776 | 0.4 | $36,449 | 20.0 | 7.5 | 8.7 | 0.1 | 1.6 | |
| 08243 / Townsends Inlet / NJ / 59.5 mi. | 58 | 1,370 | 4.2 | $45,708 | 3.0 | 1.1 | 0.2 | 0.4 | 0.4 | |
| 08505 / Fieldsboro / NJ / 22.5 mi. | 58 | 5,947 | 1.0 | $58,844 | 14.6 | 2.7 | 7.5 | 0.1 | 2.6 | |
| 17601 / Roseville / PA / 58.9 mi. | 58 | 17,996 | 0.3 | $54,470 | 8.2 | 2.8 | 1.4 | 0.1 | 3.1 | |
| 08074 / Richwood / NJ / 18.3 mi. | 53 | 18 | 294.4 | $100,183 | 3.5 | 3.5 | 0.0 | 0.0 | 0.0 | |
| 08313 / Deerfield Street / NJ / 30.8 mi. | 53 | 54 | 98.1 | $80,320 | 5.4 | 0.7 | 0.0 | 0.7 | 1.4 | |
| 08318 / Pittsgrove Township / NJ / 28.6 mi. | 53 | 4,181 | 1.3 | $54,987 | 11.9 | 3.2 | 6.6 | 0.3 | 0.6 | |
| 08322 / Franklinville / NJ / 24.6 mi. | 53 | 3,142 | 1.7 | $54,028 | 10.5 | 2.4 | 6.4 | 0.3 | 0.4 | |
| 08344 / Willow Grove / NJ / 29.5 mi. | 53 | 2,018 | 2.6 | $48,879 | 23.1 | 8.8 | 12.2 | 0.2 | 0.5 | |
| 18702 / Wilkes Barre Township / PA / 87.2 mi. | 53 | 21,191 | 0.3 | $29,129 | 7.3 | 1.3 | 3.9 | 0.1 | 1.0 | |
| 08084 / Stratford / NJ / 12.7 mi. | 52 | 2,736 | 1.9 | $50,977 | 13.9 | 3.8 | 6.5 | 0.0 | 2.4 | |
| 08270 / Woodbine / NJ / 51.3 mi. | 51 | 2,650 | 1.9 | $50,816 | 20.6 | 8.2 | 11.0 | 0.2 | 0.3 | |
| 18102 / Allentown / PA / 42.3 mi. | 50 | 16,280 | 0.3 | $26,219 | 49.2 | 35.9 | 8.7 | 0.2 | 1.9 | |
| 19086 / Wallingford / PA / 13.8 mi. | 50 | 4,155 | 1.2 | $68,750 | 6.9 | 1.3 | 2.2 | 0.1 | 2.4 | |
| 08029 / Glendora / NJ / 11.1 mi. | 49 | 1,959 | 2.5 | $42,233 | 3.4 | 1.6 | 0.5 | 0.1 | 0.4 | |
| 08202 / Avalon / NJ / 62.2 mi. | 49 | 1,090 | 4.5 | $56,932 | 1.8 | 0.5 | 0.3 | 0.0 | 0.6 | |
| 08310 / Buena / NJ / 32.8 mi. | 49 | 731 | 6.7 | $30,833 | 14.1 | 7.6 | 4.2 | 0.1 | 0.1 | |
| 17404 / York / PA / 81 mi. | 49 | 23,044 | 0.2 | $40,418 | 16.5 | 6.5 | 7.2 | 0.2 | 1.1 | |
| 08036 / Hainesport Township / NJ / 15.1 mi. | 48 | 77 | 62.3 | $62,188 | 6.6 | 3.9 | 0.9 | 0.0 | 0.0 | |
| 18938 / New Hope / PA / 23.6 mi. | 48 | 5,594 | 0.9 | $72,983 | 4.3 | 2.0 | 0.6 | 0.1 | 0.8 | |
| 08062 / South Harrison Township / NJ / 18.7 mi. | 47 | 3,514 | 1.3 | $73,070 | 5.7 | 1.3 | 3.1 | 0.1 | 0.5 | |
| 08008 / Surf City Boro / NJ / 52.5 mi. | 44 | 3,787 | 1.2 | $45,974 | 4.4 | 3.2 | 0.2 | 0.1 | 0.6 | |
| 08063 / National Park / NJ / 9.3 mi. | 44 | 1,149 | 3.8 | $48,922 | 2.5 | 1.4 | 0.1 | 0.2 | 0.3 | |
| 08341 / Minotola / NJ / 32.6 mi. | 44 | 808 | 5.4 | $32,204 | 32.8 | 20.9 | 8.7 | 0.4 | 0.6 | |
| 08865 / Phillipsburg / NJ / 44.1 mi. | 44 | 11,296 | 0.4 | $44,092 | 7.8 | 3.7 | 2.1 | 0.1 | 0.9 | |
| 18104 / Allentown / PA / 43.1 mi. | 44 | 15,498 | 0.3 | $52,003 | 7.6 | 2.7 | 1.5 | 0.0 | 2.4 | |
| 18503 / Scranton / PA / 94.2 mi. | 44 | 476 | 9.2 | $11,341 | 13.2 | 3.0 | 8.3 | 0.2 | 0.9 | |
| 19081 / Swarthmore / PA / 12.5 mi. | 44 | 3,449 | 1.3 | $67,631 | 11.0 | 2.3 | 3.0 | 0.2 | 3.8 | |
| 17402 / Yorkshire / PA / 76.6 mi. | 43 | 17,341 | 0.2 | $48,584 | 8.2 | 2.3 | 3.0 | 0.1 | 2.0 | |
| 19112 / Philadelphia / PA / 7.7 mi. | 41 | 0 | 0.0 | $0 | 75.9 | 3.5 | 69.0 | 0.0 | 0.0 | |
| 08223 / Palermo / NJ / 53.6 mi. | 40 | 1,608 | 2.5 | $51,272 | 3.2 | 1.2 | 0.7 | 0.1 | 0.7 | |
| 18101 / Allentown / PA / 41.8 mi. | 40 | 1,215 | 3.3 | $18,851 | 65.8 | 45.7 | 17.5 | 0.2 | 0.8 | |
| 18955 / Richlandtown / PA / 31.6 mi. | 40 | 402 | 10.0 | $45,750 | 2.5 | 0.7 | 0.5 | 0.0 | 0.8 | |
| 19607 / Shillington / PA / 44.8 mi. | 40 | 9,161 | 0.4 | $44,305 | 7.2 | 2.9 | 1.7 | 0.1 | 1.6 | |
| 08090 / Wenonah / NJ / 13.4 mi. | 38 | 3,048 | 1.2 | $56,944 | 12.4 | 1.8 | 8.8 | 0.2 | 0.8 | |
| 17112 / West Hanover / PA / 84.1 mi. | 37 | 11,766 | 0.3 | $55,439 | 7.3 | 1.3 | 3.4 | 0.1 | 1.8 | |
| 08035 / Haddon Heights / NJ / 8.8 mi. | 36 | 3,039 | 1.2 | $58,424 | 2.8 | 1.1 | 0.4 | 0.1 | 0.7 | |
| 08088 / Vincentown / NJ / 24.6 mi. | 36 | 9,209 | 0.4 | $60,773 | 3.8 | 1.2 | 1.2 | 0.2 | 0.7 | |
| 08201 / Smithville / NJ / 47.7 mi. | 36 | 12,118 | 0.3 | $51,397 | 28.0 | 6.3 | 10.9 | 0.2 | 8.7 | |
| 17403 / York / PA / 77.9 mi. | 36 | 16,620 | 0.2 | $34,831 | 27.7 | 9.5 | 15.0 | 0.2 | 1.3 | |
| 18015 / Fountain Hill / PA / 40.1 mi. | 36 | 10,507 | 0.3 | $35,579 | 31.7 | 23.9 | 3.6 | 0.2 | 2.5 | |
| 19350 / Landenberg / PA / 36.2 mi. | 36 | 3,149 | 1.1 | $91,619 | 9.2 | 5.4 | 1.4 | 0.1 | 1.3 | |
| 08225 / Northfield / NJ / 50 mi. | 32 | 2,852 | 1.1 | $56,858 | 10.1 | 4.4 | 2.3 | 0.0 | 2.5 | |
| 18052 / Whitehall / PA / 44.9 mi. | 32 | 10,442 | 0.3 | $43,188 | 11.7 | 4.4 | 2.5 | 0.1 | 3.7 | |
| 17522 / Weidmanville / PA / 52.9 mi. | 31 | 10,847 | 0.3 | $44,777 | 4.8 | 2.0 | 0.5 | 0.1 | 1.4 | |
| 18018 / Bethlehem / PA / 42.1 mi. | 31 | 13,316 | 0.2 | $39,177 | 14.4 | 9.1 | 2.3 | 0.1 | 1.5 | |
| 18929 / Jamison / PA / 16 mi. | 31 | 2,476 | 1.3 | $89,453 | 4.8 | 0.9 | 1.0 | 0.1 | 2.3 | |
| 19055 / Levittown / PA / 17.2 mi. | 30 | 4,896 | 0.6 | $52,123 | 6.7 | 2.4 | 2.3 | 0.2 | 0.8 | |
| 18612 / Dallas / PA / 94.6 mi. | 29 | 5,503 | 0.5 | $49,005 | 9.4 | 1.5 | 6.8 | 0.1 | 0.6 | |
| File | pa_philadelphia_daily_news | |||||||||
| Time | 5/17/05 5:55 PM | |||||||||
| Page | 82 | |||||||||
| Member | 141150 | |||||||||