
|
| Comparing the racial diversity of the journalists | ||||||||||
| at America's daily newspapers | ||||||||||
| with the communities that they serve | ||||||||||
| Newsroom diversity report for | ||||||||||
| The Observer, La Grande | ||||||||||
| La Grande, Oregon | ||||||||||
| From a report for the Knight Foundation | ||||||||||
| by Bill Dedman and Stephen K. Doig, June 2005 | ||||||||||
| Click here to read the national report or to select another newspaper | ||||||||||
| Year | Non-white % of newsroom staff | 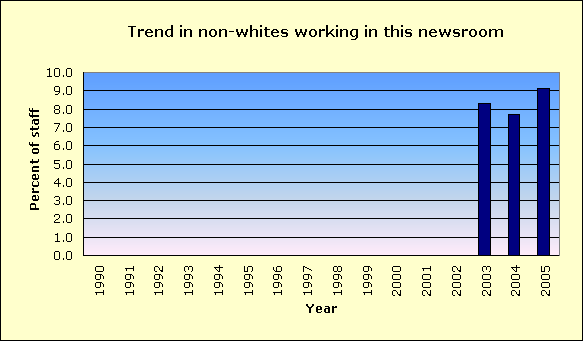
|
||||||||
| 2005 | 9.1 | |||||||||
| 2004 | 7.7 | |||||||||
| 2003 | 8.3 | |||||||||
| 2002 | 0.0 | |||||||||
| 2001 | 0.0 | |||||||||
| 2000 | 0.0 | |||||||||
| 1999 | 0.0 | |||||||||
| 1998 | 0.0 | |||||||||
| 1997 | 0.0 | |||||||||
| 1996 | 0.0 | |||||||||
| 1995 | Did not report | |||||||||
| 1994 | 0.0 | |||||||||
| 1993 | 0.0 | |||||||||
| 1992 | 0.0 | |||||||||
| 1991 | Did not report | |||||||||
| 1990 | 0.0 | |||||||||
| The latest year at peak is | 2005 | |||||||||
| See the notes and definitions section below for the sources of these figures. | ||||||||||
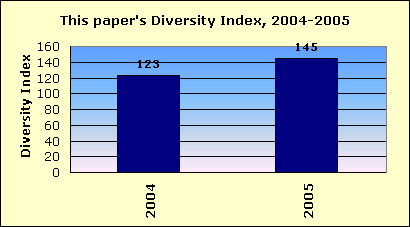
| Newsroom Diversity Index | ||||||||||
| for The Observer, La Grande | ||||||||||
 |
||||||||||
| Year | Non-white % of newsroom staff | Non-white % of circulation area | Newsroom Diversity Index (parity=100) | |||||||
| 2005 | 9.1 | 6.3 | 145 | |||||||
| 2004 | 7.7 | 6.3 | 123 | |||||||
| How the index is calculated | ||||||||||
| The Newsroom Diversity Index is the non-white percentage of the newsroom staff | ||||||||||
| divided by the non-white percentage of residents in the circulation area. | ||||||||||
| (Parity = 100.) | ||||||||||
| See the notes and definitions section below for the sources of these figures. | ||||||||||
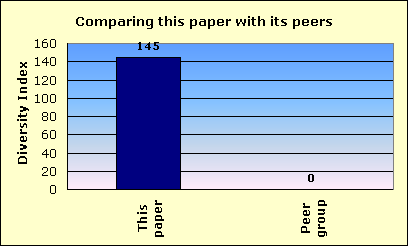
| Peer group comparison | ||||||||||
| for The Observer, La Grande | ||||||||||
 |
||||||||||
| This newspaper's Newsroom Diversity Index is 145. | This paper | |||||||||
| Peer group | ||||||||||
| Compare that with 0, which is the median Diversity Index for all newspapers | ||||||||||
| reporting in this circulation category of 5,001 to 10,000 daily sales. | ||||||||||
| In that group, this newspaper's Diversity Index ranks 18 out of 211 | ||||||||||
| newspapers reporting in the category of 5,001 to 10,000 daily sales. | ||||||||||
| FYI, in circulation, this newspaper's average weekday circulation of | ||||||||||
| approximately 6,072 ranks 1052 out of 1,410 daily newspapers in the US. | ||||||||||
| See the notes and definitions section below for the sources of these figures. | ||||||||||
| Details on race/ethnicity | ||||||||||
| in the circulation area | ||||||||||
| and the home county | ||||||||||
| of The Observer, La Grande | ||||||||||
| Circulation area | ||||||||||
| Race/ethnicity | % of population | Number of residents | 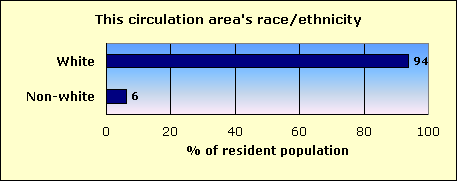
|
|||||||
| Hispanic | 2.3 | 711 | ||||||||
| Black | 0.4 | 119 | ||||||||
| Asian and Pacific Islander | 1.2 | 371 | ||||||||
| Native-American | 0.8 | 239 | ||||||||
| Other non-white | 0.3 | 100 | ||||||||
| Multi-racial | 1.4 | 440 | ||||||||
| Non-white | 6.3 | 1,980 | ||||||||
| White | 93.7 | 29,559 | ||||||||
| Total | 31,539 | |||||||||
| Home county: Union | ||||||||||
| Race/ethnicity | % of population | Number of residents | 
|
|||||||
| Hispanic | 2.5 | 600 | ||||||||
| Black | 0.5 | 117 | ||||||||
| Asian and Pacific Islander | 1.4 | 351 | ||||||||
| Native-American | 0.8 | 191 | ||||||||
| Other non-white | 0.4 | 92 | ||||||||
| Multi-racial | 1.4 | 336 | ||||||||
| Non-white | 6.9 | 1,687 | ||||||||
| White | 93.1 | 22,843 | ||||||||
| Total | 24,530 | |||||||||
| The home county of this newspaper is Union. | ||||||||||
| About this report | ||||||||||
| This third annual report for the Knight Foundation adds context to an annual survey by the American Society of Newspaper Editors. ASNE has set a goal that | ||||||||||
| every newspaper, to help it know its community and gather the news, should employ at least one non-white journalist, and that newspapers should strive to | ||||||||||
| employ non-whites in proportion to their share of the community. ASNE's report, at www.asne.org, shows each newspaper's non-white employment, but does | ||||||||||
| not disclose how closely that employment mirrors the newspaper's circulation area. | ||||||||||
| That gap is filled by the report you are reading now. This report was not done by ASNE, but was done for the Knight Foundation by Bill Dedman and | ||||||||||
| Stephen K. Doig. It shows how close each newspaper is to ASNE's goal, by comparing the newsroom staffing with the circulation area population. | ||||||||||
| The full report is at www.powerreporting.com/knight. | ||||||||||
| Notes and definitions | ||||||||||
| 1. The Newsroom Diversity Index is the non-white percentage of the newsroom staff divided by the non-white percentage of the circulation area's residents. Parity = 100. | ||||||||||
| 2. Source for staffing: Survey by American Society of Newspaper Editors, April 2005. Newspapers report non-white staff as of the end of the previous year. | ||||||||||
| 3. Following ASNE's definition, newsroom staff includes only supervisors, reporters, editors, copy/layout editors and photographers. | ||||||||||
| 4. Also following ASNE's definition, "whites," "blacks," etc., exclude Hispanics, who are counted in a separate category. | ||||||||||
| 5. Source for boundaries of this newspaper's circulation area: ZIP Code circulation data, Audit Bureau of Circulations, latest available. | ||||||||||
| 6. A paper may define its circulation area differently for marketing efforts, or news coverage, or to set advertising rates. | ||||||||||
| 7. If ZIP Codes or counties are used, this report applies a threshold: 10 percent household penetration is required to include an area in the circulation area. | ||||||||||
| 8. Source for the demographics of residents of that circulation area: US Census 2000. | ||||||||||
| 9. Source for total circulation: Editor & Publisher magazine, Monday-Friday average at year-end 2004. | ||||||||||
| 10. Staff of non-English publications, such as the Miami Herald's El Nuevo Herald, are excluded from the ASNE staffing survey for the first time this year. | ||||||||||
| Demographics of ZIP Codes | ||||||||||
| where sales were reported by | ||||||||||
| The Observer, La Grande | ||||||||||
| Note that some ZIP Codes listed here may not have been included in determining the newspaper's circulation area. In calculating the Diversity Index, a | ||||||||||
| ZIP Code was included only if the household penetration was at least 10 percent. Any lower-penetration ZIP Codes are also listed here for your information. | ||||||||||
| Also, if the newspaper reported more than 300 ZIP Codes, only the top 300 in weekday sales are listed here. | ||||||||||
| ZIP / City / State / Approx. distance in miles from the newspaper's home office | Weekday sales | Households | Penetration % (daily sales per 100 households) | Median household income | Non-white % of population |
Hispanic % of population |
Black % of population |
Native % of population |
Asian % of population |
|
| 97850 / La Grande / OR / 0 mi. | 3,770 | 6,622 | 56.9 | $33,621 | 7.9 | 2.7 | 0.6 | 0.8 | 1.8 | |
| 97827 / Elgin / OR / 36.1 mi. | 461 | 961 | 48.0 | $32,560 | 4.2 | 1.3 | 0.0 | 0.5 | 0.7 | |
| 97883 / Union / OR / 31.4 mi. | 460 | 884 | 52.0 | $30,179 | 4.0 | 1.1 | 0.1 | 0.8 | 0.4 | |
| 97824 / Cove / OR / 23 mi. | 340 | 572 | 59.4 | $41,302 | 6.1 | 2.6 | 0.3 | 1.5 | 1.2 | |
| 97828 / Enterprise / OR / 52.5 mi. | 332 | 1,322 | 25.1 | $32,955 | 3.8 | 1.5 | 0.0 | 0.9 | 0.3 | |
| 97846 / Joseph / OR / 55.1 mi. | 184 | 840 | 21.9 | $33,077 | 4.3 | 1.1 | 0.0 | 0.6 | 0.2 | |
| 97885 / Wallowa / OR / 41.9 mi. | 178 | 592 | 30.1 | $30,388 | 4.6 | 2.1 | 0.1 | 0.6 | 0.4 | |
| 97876 / Summerville / OR / 23.7 mi. | 176 | 280 | 62.9 | $42,308 | 5.8 | 2.4 | 0.6 | 0.7 | 0.6 | |
| 97841 / Imbler / OR / 26 mi. | 92 | 137 | 67.2 | $41,827 | 2.1 | 1.1 | 0.0 | 0.0 | 0.5 | |
| 97867 / North Powder / OR / 21.4 mi. | 86 | 271 | 31.7 | $27,188 | 8.4 | 4.5 | 0.4 | 0.4 | 0.6 | |
| 97857 / Lostine / OR / 43.6 mi. | 47 | 192 | 24.5 | $32,105 | 3.9 | 2.5 | 0.0 | 0.0 | 0.4 | |
| File | or_the_observer__la_grande | |||||||||
| Time | 5/15/05 7:31 PM | |||||||||
| Page | 1051 | |||||||||
| Member | 110950 | |||||||||