
|
| Comparing the racial diversity of the journalists | ||||||||||
| at America's daily newspapers | ||||||||||
| with the communities that they serve | ||||||||||
| Newsroom diversity report for | ||||||||||
| The Ponca City News | ||||||||||
| Ponca City, Oklahoma | ||||||||||
| From a report for the Knight Foundation | ||||||||||
| by Bill Dedman and Stephen K. Doig, June 2005 | ||||||||||
| Click here to read the national report or to select another newspaper | ||||||||||
| Year | Non-white % of newsroom staff | |||||||||
| 2005 | Did not report | |||||||||
| 2004 | 0.0 | |||||||||
| 2003 | 0.0 | |||||||||
| 2002 | Did not report | |||||||||
| 2001 | Did not report | |||||||||
| 2000 | Did not report | |||||||||
| 1999 | Did not report | |||||||||
| 1998 | Did not report | |||||||||
| 1997 | Did not report | |||||||||
| 1996 | 0.0 | |||||||||
| 1995 | 0.0 | |||||||||
| 1994 | Did not report | |||||||||
| 1993 | Did not report | |||||||||
| 1992 | 0.0 | |||||||||
| 1991 | Did not report | |||||||||
| 1990 | Did not report | |||||||||
| The latest year at peak is | 2004 | |||||||||
| See the notes and definitions section below for the sources of these figures. | ||||||||||
| Newsroom Diversity Index | ||||||||||
| for The Ponca City News | ||||||||||
| Year | Non-white % of newsroom staff | Non-white % of circulation area | Newsroom Diversity Index (parity=100) | |||||||
| 2005 | N/A | 19.6 | N/A | |||||||
| 2004 | 0.0 | 19.6 | 0 | |||||||
| How the index is calculated | ||||||||||
| The Newsroom Diversity Index is the non-white percentage of the newsroom staff | ||||||||||
| divided by the non-white percentage of residents in the circulation area. | ||||||||||
| (Parity = 100.) | ||||||||||
| See the notes and definitions section below for the sources of these figures. | ||||||||||
| Peer group comparison | ||||||||||
| for The Ponca City News | ||||||||||
| This paper | ||||||||||
| Peer group | ||||||||||
| The median Diversity Index is 0 for all newspapers | ||||||||||
| reporting in this circulation category of 5,001 to 10,000 daily sales. | ||||||||||
| An example of a newspaper of similar circulation, in an area of similar level of non-white residents, but one that has a relatively high Diversity Index, is Lake City Reporter, Florida, with a 23.5 percent non-white staff in a community that is 21.4 percent non-white. Its index is 110. | ||||||||||
| FYI, in circulation, this newspaper's average weekday circulation of | ||||||||||
| approximately 9,209 ranks 844 out of 1,410 daily newspapers in the US. | ||||||||||
| See the notes and definitions section below for the sources of these figures. | ||||||||||
| Details on race/ethnicity | ||||||||||
| in the circulation area | ||||||||||
| and the home county | ||||||||||
| of The Ponca City News | ||||||||||
| Circulation area | ||||||||||
| Race/ethnicity | % of population | Number of residents | 
|
|||||||
| Hispanic | 3.7 | 1,740 | ||||||||
| Black | 1.9 | 891 | ||||||||
| Asian and Pacific Islander | 0.5 | 249 | ||||||||
| Native-American | 9.8 | 4,650 | ||||||||
| Other non-white | 0.0 | 13 | ||||||||
| Multi-racial | 3.8 | 1,783 | ||||||||
| Non-white | 19.6 | 9,326 | ||||||||
| White | 80.4 | 38,267 | ||||||||
| Total | 47,593 | |||||||||
| Home county: Kay | ||||||||||
| Race/ethnicity | % of population | Number of residents | 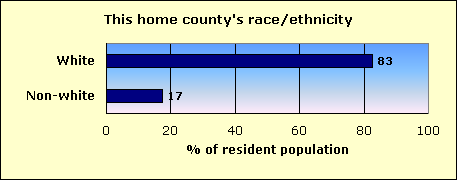
|
|||||||
| Hispanic | 4.3 | 2,045 | ||||||||
| Black | 1.8 | 850 | ||||||||
| Asian and Pacific Islander | 0.5 | 258 | ||||||||
| Native-American | 7.3 | 3,504 | ||||||||
| Other non-white | 0.0 | 15 | ||||||||
| Multi-racial | 3.6 | 1,721 | ||||||||
| Non-white | 17.5 | 8,393 | ||||||||
| White | 82.5 | 39,687 | ||||||||
| Total | 48,080 | |||||||||
| The home county of this newspaper is Kay. | ||||||||||
| About this report | ||||||||||
| This third annual report for the Knight Foundation adds context to an annual survey by the American Society of Newspaper Editors. ASNE has set a goal that | ||||||||||
| every newspaper, to help it know its community and gather the news, should employ at least one non-white journalist, and that newspapers should strive to | ||||||||||
| employ non-whites in proportion to their share of the community. ASNE's report, at www.asne.org, shows each newspaper's non-white employment, but does | ||||||||||
| not disclose how closely that employment mirrors the newspaper's circulation area. | ||||||||||
| That gap is filled by the report you are reading now. This report was not done by ASNE, but was done for the Knight Foundation by Bill Dedman and | ||||||||||
| Stephen K. Doig. It shows how close each newspaper is to ASNE's goal, by comparing the newsroom staffing with the circulation area population. | ||||||||||
| The full report is at www.powerreporting.com/knight. | ||||||||||
| Notes and definitions | ||||||||||
| 1. The Newsroom Diversity Index is the non-white percentage of the newsroom staff divided by the non-white percentage of the circulation area's residents. Parity = 100. | ||||||||||
| 2. Source for staffing: Survey by American Society of Newspaper Editors, April 2005. Newspapers report non-white staff as of the end of the previous year. | ||||||||||
| 3. Following ASNE's definition, newsroom staff includes only supervisors, reporters, editors, copy/layout editors and photographers. | ||||||||||
| 4. Also following ASNE's definition, "whites," "blacks," etc., exclude Hispanics, who are counted in a separate category. | ||||||||||
| 5. Source for boundaries of this newspaper's circulation area: ZIP Code circulation data, Audit Bureau of Circulations, latest available. | ||||||||||
| 6. A paper may define its circulation area differently for marketing efforts, or news coverage, or to set advertising rates. | ||||||||||
| 7. If ZIP Codes or counties are used, this report applies a threshold: 10 percent household penetration is required to include an area in the circulation area. | ||||||||||
| 8. Source for the demographics of residents of that circulation area: US Census 2000. | ||||||||||
| 9. Source for total circulation: Editor & Publisher magazine, Monday-Friday average at year-end 2004. | ||||||||||
| 10. Staff of non-English publications, such as the Miami Herald's El Nuevo Herald, are excluded from the ASNE staffing survey for the first time this year. | ||||||||||
| Demographics of ZIP Codes | ||||||||||
| where sales were reported by | ||||||||||
| The Ponca City News | ||||||||||
| Note that some ZIP Codes listed here may not have been included in determining the newspaper's circulation area. In calculating the Diversity Index, a | ||||||||||
| ZIP Code was included only if the household penetration was at least 10 percent. Any lower-penetration ZIP Codes are also listed here for your information. | ||||||||||
| Also, if the newspaper reported more than 300 ZIP Codes, only the top 300 in weekday sales are listed here. | ||||||||||
| ZIP / City / State / Approx. distance in miles from the newspaper's home office | Weekday sales | Households | Penetration % (daily sales per 100 households) | Median household income | Non-white % of population |
Hispanic % of population |
Black % of population |
Native % of population |
Asian % of population |
|
| 74601 / Ponca City / OK / 0 mi. | 4,426 | 8,328 | 53.1 | $26,236 | 22.4 | 5.1 | 3.3 | 9.9 | 0.5 | |
| 74604 / Ponca City / OK / 8.9 mi. | 3,357 | 5,195 | 64.6 | $48,816 | 10.9 | 2.1 | 1.0 | 3.7 | 0.8 | |
| 74647 / Newkirk / OK / 15.4 mi. | 525 | 1,461 | 35.9 | $32,433 | 16.8 | 1.7 | 0.7 | 9.8 | 0.1 | |
| 74653 / Tonkawa / OK / 11.3 mi. | 490 | 1,440 | 34.0 | $29,250 | 19.6 | 6.2 | 0.7 | 9.1 | 0.3 | |
| 74631 / Blackwell / OK / 10.9 mi. | 214 | 3,337 | 6.4 | $26,332 | 14.2 | 5.4 | 0.1 | 4.0 | 0.4 | |
| 74637 / Fairfax / OK / 29.9 mi. | 157 | 852 | 18.4 | $24,041 | 33.6 | 1.8 | 1.0 | 24.5 | 0.7 | |
| 74652 / Shidler / OK / 31.7 mi. | 96 | 465 | 20.6 | $29,181 | 17.9 | 2.2 | 0.0 | 11.3 | 0.4 | |
| 74058 / Pawnee / OK / 31.1 mi. | 86 | 1,603 | 5.4 | $29,167 | 27.0 | 1.1 | 2.0 | 20.1 | 0.1 | |
| 74651 / Red Rock / OK / 15.5 mi. | 77 | 248 | 31.0 | $26,136 | 58.1 | 1.7 | 0.6 | 52.0 | 0.0 | |
| 74641 / Kaw City / OK / 21.5 mi. | 76 | 237 | 32.1 | $31,806 | 18.9 | 2.2 | 0.2 | 14.2 | 0.0 | |
| 74644 / Marland / OK / 11.5 mi. | 72 | 221 | 32.6 | $29,500 | 34.3 | 4.6 | 0.6 | 23.5 | 0.3 | |
| 74633 / Burbank / OK / 24.3 mi. | 71 | 183 | 38.8 | $27,778 | 23.1 | 0.5 | 0.0 | 15.1 | 0.0 | |
| 74650 / Ralston / OK / 24.5 mi. | 32 | 286 | 11.2 | $27,011 | 23.9 | 0.7 | 0.6 | 18.3 | 0.1 | |
| File | ok_the_ponca_city_news | |||||||||
| Time | 5/20/05 7:35 AM | |||||||||
| Page | 843 | |||||||||
| Member | 138150 | |||||||||