
|
| Comparing the racial diversity of the journalists | ||||||||||
| at America's daily newspapers | ||||||||||
| with the communities that they serve | ||||||||||
| Newsroom diversity report for | ||||||||||
| The Independent, Massillon | ||||||||||
| Massillon, Ohio | ||||||||||
| Owner: Copley Press (Calif.) | ||||||||||
| From a report for the Knight Foundation | ||||||||||
| by Bill Dedman and Stephen K. Doig, June 2005 | ||||||||||
| Click here to read the national report or to select another newspaper | ||||||||||
| Year | Non-white % of newsroom staff | |||||||||
| 2005 | 0.0 | |||||||||
| 2004 | Did not report | |||||||||
| 2003 | 0.0 | |||||||||
| 2002 | 0.0 | |||||||||
| 2001 | 0.0 | |||||||||
| 2000 | Did not report | |||||||||
| 1999 | Did not report | |||||||||
| 1998 | Did not report | |||||||||
| 1997 | Did not report | |||||||||
| 1996 | Did not report | |||||||||
| 1995 | Did not report | |||||||||
| 1994 | Did not report | |||||||||
| 1993 | Did not report | |||||||||
| 1992 | 0.0 | |||||||||
| 1991 | 0.0 | |||||||||
| 1990 | Did not report | |||||||||
| The latest year at peak is | 2005 | |||||||||
| See the notes and definitions section below for the sources of these figures. | ||||||||||
| Newsroom Diversity Index | ||||||||||
| for The Independent, Massillon | ||||||||||
| Year | Non-white % of newsroom staff | Non-white % of circulation area | Newsroom Diversity Index (parity=100) | |||||||
| 2005 | 0.0 | 6.2 | 0 | |||||||
| 2004 | N/A | 6.2 | N/A | |||||||
| How the index is calculated | ||||||||||
| The Newsroom Diversity Index is the non-white percentage of the newsroom staff | ||||||||||
| divided by the non-white percentage of residents in the circulation area. | ||||||||||
| (Parity = 100.) | ||||||||||
| Company index | ||||||||||
| This newspaper's owner, Copley Press (Calif.), | ||||||||||
| has a companywide, circulation-weighted Diversity Index of 43. | ||||||||||
| See the notes and definitions section below for the sources of these figures. | ||||||||||
| Peer group comparison | ||||||||||
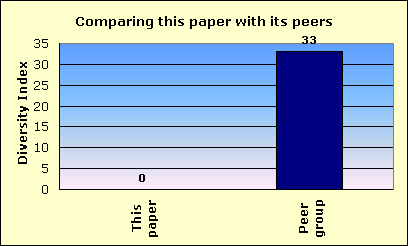
| for The Independent, Massillon | ||||||||||
 |
||||||||||
| This newspaper's Newsroom Diversity Index is 0. | This paper | |||||||||
| Peer group | ||||||||||
| Compare that with 33, which is the median Diversity Index for all newspapers | ||||||||||
| reporting in this circulation category of 10,001 to 25,000 daily sales. | ||||||||||
| In that group, this newspaper's Diversity Index ranks 159 out of 259 | ||||||||||
| newspapers reporting in the category of 10,001 to 25,000 daily sales. | ||||||||||
| An example of a newspaper of similar circulation, in an area of similar level of non-white residents, but one that has a relatively high Diversity Index, is The Herald, Sharon, Pennsylvania, with a 8 percent non-white staff in a community that is 7.3 percent non-white. Its index is 110. | ||||||||||
| FYI, in circulation, this newspaper's average weekday circulation of | ||||||||||
| approximately 12,863 ranks 681 out of 1,410 daily newspapers in the US. | ||||||||||
| See the notes and definitions section below for the sources of these figures. | ||||||||||
| Details on race/ethnicity | ||||||||||
| in the circulation area | ||||||||||
| and the home county | ||||||||||
| of The Independent, Massillon | ||||||||||
| Circulation area | ||||||||||
| Race/ethnicity | % of population | Number of residents | 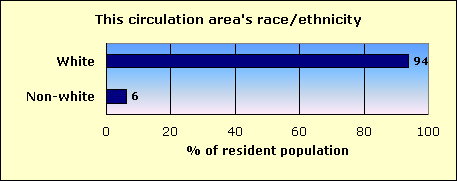
|
|||||||
| Hispanic | 0.8 | 804 | ||||||||
| Black | 3.8 | 3,788 | ||||||||
| Asian and Pacific Islander | 0.4 | 381 | ||||||||
| Native-American | 0.2 | 168 | ||||||||
| Other non-white | 0.1 | 84 | ||||||||
| Multi-racial | 1.0 | 958 | ||||||||
| Non-white | 6.2 | 6,183 | ||||||||
| White | 93.8 | 93,251 | ||||||||
| Total | 99,434 | |||||||||
| Home county: Stark | ||||||||||
| Race/ethnicity | % of population | Number of residents | 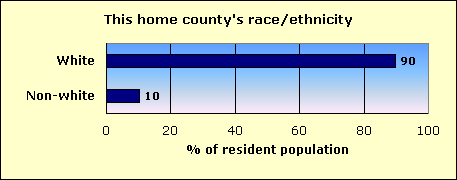
|
|||||||
| Hispanic | 0.9 | 3,492 | ||||||||
| Black | 7.2 | 27,039 | ||||||||
| Asian and Pacific Islander | 0.6 | 2,088 | ||||||||
| Native-American | 0.2 | 873 | ||||||||
| Other non-white | 0.1 | 514 | ||||||||
| Multi-racial | 1.3 | 5,082 | ||||||||
| Non-white | 10.3 | 39,088 | ||||||||
| White | 89.7 | 339,010 | ||||||||
| Total | 378,098 | |||||||||
| The home county of this newspaper is Stark. | ||||||||||
| About this report | ||||||||||
| This third annual report for the Knight Foundation adds context to an annual survey by the American Society of Newspaper Editors. ASNE has set a goal that | ||||||||||
| every newspaper, to help it know its community and gather the news, should employ at least one non-white journalist, and that newspapers should strive to | ||||||||||
| employ non-whites in proportion to their share of the community. ASNE's report, at www.asne.org, shows each newspaper's non-white employment, but does | ||||||||||
| not disclose how closely that employment mirrors the newspaper's circulation area. | ||||||||||
| That gap is filled by the report you are reading now. This report was not done by ASNE, but was done for the Knight Foundation by Bill Dedman and | ||||||||||
| Stephen K. Doig. It shows how close each newspaper is to ASNE's goal, by comparing the newsroom staffing with the circulation area population. | ||||||||||
| The full report is at www.powerreporting.com/knight. | ||||||||||
| Notes and definitions | ||||||||||
| 1. The Newsroom Diversity Index is the non-white percentage of the newsroom staff divided by the non-white percentage of the circulation area's residents. Parity = 100. | ||||||||||
| 2. Source for staffing: Survey by American Society of Newspaper Editors, April 2005. Newspapers report non-white staff as of the end of the previous year. | ||||||||||
| 3. Following ASNE's definition, newsroom staff includes only supervisors, reporters, editors, copy/layout editors and photographers. | ||||||||||
| 4. Also following ASNE's definition, "whites," "blacks," etc., exclude Hispanics, who are counted in a separate category. | ||||||||||
| 5. Source for boundaries of this newspaper's circulation area: ZIP Code circulation data, Audit Bureau of Circulations, latest available. | ||||||||||
| 6. A paper may define its circulation area differently for marketing efforts, or news coverage, or to set advertising rates. | ||||||||||
| 7. If ZIP Codes or counties are used, this report applies a threshold: 10 percent household penetration is required to include an area in the circulation area. | ||||||||||
| 8. Source for the demographics of residents of that circulation area: US Census 2000. | ||||||||||
| 9. Source for total circulation: Editor & Publisher magazine, Monday-Friday average at year-end 2004. | ||||||||||
| 10. Staff of non-English publications, such as the Miami Herald's El Nuevo Herald, are excluded from the ASNE staffing survey for the first time this year. | ||||||||||
| Demographics of ZIP Codes | ||||||||||
| where sales were reported by | ||||||||||
| The Independent, Massillon | ||||||||||
| Note that some ZIP Codes listed here may not have been included in determining the newspaper's circulation area. In calculating the Diversity Index, a | ||||||||||
| ZIP Code was included only if the household penetration was at least 10 percent. Any lower-penetration ZIP Codes are also listed here for your information. | ||||||||||
| Also, if the newspaper reported more than 300 ZIP Codes, only the top 300 in weekday sales are listed here. | ||||||||||
| ZIP / City / State / Approx. distance in miles from the newspaper's home office | Weekday sales | Households | Penetration % (daily sales per 100 households) | Median household income | Non-white % of population |
Hispanic % of population |
Black % of population |
Native % of population |
Asian % of population |
|
| 44646 / Massillon / OH / 3.8 mi. | 6,084 | 17,923 | 33.9 | $41,532 | 10.4 | 0.9 | 7.4 | 0.2 | 0.5 | |
| 44647 / Massillon / OH / 0 mi. | 3,776 | 6,940 | 54.4 | $36,768 | 3.7 | 0.8 | 1.5 | 0.2 | 0.2 | |
| 44662 / Navarre / OH / 5.9 mi. | 1,069 | 3,620 | 29.5 | $37,271 | 2.0 | 0.6 | 0.6 | 0.1 | 0.2 | |
| 44614 / Canal Fulton / OH / 6.4 mi. | 585 | 4,130 | 14.2 | $51,766 | 2.6 | 0.6 | 0.6 | 0.2 | 0.3 | |
| 44708 / Canton / OH / 7.2 mi. | 526 | 11,247 | 4.7 | $39,379 | 7.0 | 1.1 | 3.4 | 0.2 | 0.8 | |
| 44613 / Brewster / OH / 5.7 mi. | 363 | 852 | 42.6 | $37,434 | 2.1 | 1.1 | 0.1 | 0.2 | 0.2 | |
| 44618 / Dalton / OH / 6.5 mi. | 353 | 2,163 | 16.3 | $45,814 | 2.3 | 0.7 | 0.3 | 0.2 | 0.6 | |
| 44666 / North Lawrence / OH / 4.7 mi. | 306 | 984 | 31.1 | $48,214 | 2.1 | 0.9 | 0.3 | 0.3 | 0.1 | |
| 44718 / Canton / OH / 7.4 mi. | 242 | 5,096 | 4.7 | $56,677 | 6.1 | 1.1 | 1.9 | 0.1 | 2.2 | |
| 44608 / Beach City / OH / 9.1 mi. | 235 | 984 | 23.9 | $37,802 | 1.6 | 0.7 | 0.0 | 0.0 | 0.3 | |
| 44706 / Canton / OH / 8.3 mi. | 228 | 7,387 | 3.1 | $34,976 | 8.4 | 0.9 | 5.3 | 0.3 | 0.2 | |
| 44720 / Canton / OH / 10.2 mi. | 186 | 15,224 | 1.2 | $50,316 | 4.1 | 0.9 | 1.1 | 0.1 | 1.1 | |
| 44710 / Canton / OH / 7.5 mi. | 117 | 4,240 | 2.8 | $30,297 | 8.4 | 0.8 | 5.6 | 0.2 | 0.2 | |
| 44689 / Wilmot / OH / 11.4 mi. | 46 | 240 | 19.2 | $36,000 | 0.5 | 0.0 | 0.0 | 0.1 | 0.1 | |
| 44216 / Clinton / OH / 10.1 mi. | 38 | 3,299 | 1.2 | $54,195 | 2.6 | 0.5 | 0.5 | 0.1 | 0.8 | |
| 44680 / Strasburg / OH / 13.1 mi. | 34 | 1,458 | 2.3 | $37,560 | 2.0 | 1.2 | 0.1 | 0.1 | 0.3 | |
| 44612 / Bolivar / OH / 12.5 mi. | 30 | 1,910 | 1.6 | $46,296 | 2.0 | 0.5 | 0.5 | 0.2 | 0.3 | |
| 44702 / Canton / OH / 10.1 mi. | 29 | 552 | 5.3 | $9,455 | 34.7 | 1.8 | 27.9 | 1.1 | 0.4 | |
| 44659 / Mount Eaton / OH / 9.8 mi. | 27 | 30 | 90.0 | $44,063 | 3.1 | 0.0 | 1.5 | 1.5 | 0.0 | |
| 44709 / Canton / OH / 10.1 mi. | 27 | 8,087 | 0.3 | $38,955 | 8.8 | 1.0 | 5.4 | 0.2 | 0.7 | |
| File | oh_the_independent__massillon | |||||||||
| Time | 5/19/05 10:32 PM | |||||||||
| Page | 680 | |||||||||
| Member | 136050 | |||||||||