| Comparing
the racial diversity of the journalists |
| at
America's daily newspapers |
| with the
communities that they serve |
| Newsroom diversity report for |
|
|
| The New York Times |
| New
York, New York |
| Owner:
New York Times Co. |
|
| From a
report for the Knight Foundation |
| by Bill
Dedman and Stephen K. Doig, June 2005 |
|
| Click here to
read the national report or to select another newspaper |
|
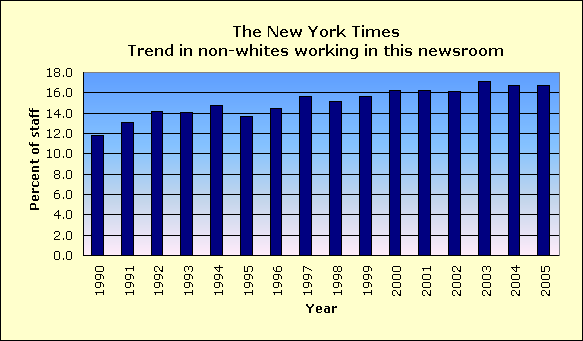
| Year |
Non-white % of newsroom staff |
|
|
|
|
|
|
|
|
| 2005 |
16.7 |
|
|
|
|
|
|
|
| 2004 |
16.7 |
|
|
|
|
|
|
|
| 2003 |
17.1 |
|
|
|
|
|
|
|
| 2002 |
16.1 |
|
|
|
|
|
|
|
| 2001 |
16.2 |
|
|
|
|
|
|
|
| 2000 |
16.2 |
|
|
|
|
|
|
|
| 1999 |
15.6 |
|
|
|
|
|
|
|
| 1998 |
15.1 |
|
|
|
|
|
|
|
| 1997 |
15.6 |
|
|
|
|
|
|
|
| 1996 |
14.5 |
|
|
|
|
|
|
|
| 1995 |
13.7 |
|
|
|
|
|
|
|
| 1994 |
14.8 |
|
|
|
|
|
|
|
| 1993 |
14.1 |
|
|
|
|
|
|
|
| 1992 |
14.2 |
|
|
|
|
|
|
|
| 1991 |
13.1 |
|
|
|
|
|
|
|
| 1990 |
11.8 |
|
|
|
|
|
|
|
|
|
|
|
|
|
|
|
|
|
| The latest year at peak is |
2003 |
|
|
|
|
|
|
|
|
| See the notes and
definitions section below for the sources of these figures. |
|
|
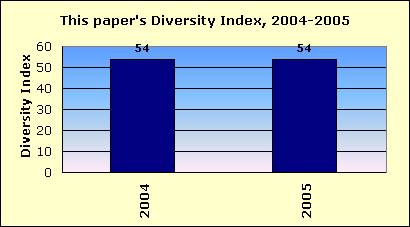
| Newsroom Diversity Index |
| for The New York Times |
|
 |
|
|
|
|
|
|
|
|
|
|
| Year |
Non-white % of newsroom staff |
Non-white % of circulation area |
Newsroom Diversity Index (parity=100) |
|
|
|
|
|
|
| 2005 |
16.7 |
30.9 |
54 |
|
|
|
|
|
| 2004 |
16.7 |
30.9 |
54 |
|
|
|
|
|
|
|
|
|
|
|
|
|
|
|
| How the index is calculated |
|
|
|
|
|
|
| The Newsroom Diversity Index is the non-white
percentage of the newsroom staff |
|
|
|
|
|
|
| divided by the non-white percentage of
residents in the circulation area. |
|
|
|
|
|
|
| (Parity = 100.) |
|
|
|
|
|
|
|
|
|
|
|
|
|
| Company index |
|
|
|
|
|
|
| This newspaper's owner, New York Times Co., |
|
|
|
|
|
|
| has a companywide, circulation-weighted
Diversity Index of 69. |
|
|
|
|
|
|
|
| See the notes and
definitions section below for the sources of these figures. |
|
|
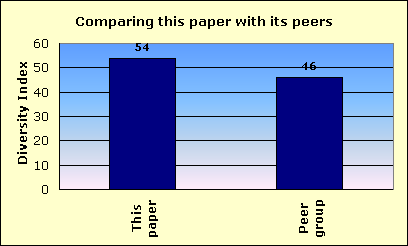
| Peer group comparison |
| for The New York Times |
|
|
 |
|
|
|
|
|
|
|
|
|
|
|
|
| This newspaper's Newsroom Diversity Index is 54. |
This
paper |
|
|
|
|
Peer
group |
|
|
|
| Compare that with 46, which is the median
Diversity Index for all newspapers |
|
|
|
|
|
|
| reporting in this circulation category of
more than 500,000 daily sales. |
|
|
|
|
|
|
|
|
|
|
|
|
| In that group, this newspaper's Diversity
Index ranks 3 out of 10 |
|
|
|
|
|
|
| newspapers reporting in the category of
more than 500,000 daily sales. |
|
|
|
|
|
|
|
|
|
|
|
|
|
|
|
|
|
|
|
|
|
|
|
|
|
|
|
|
|
|
|
|
|
|
|
|
|
|
|
|
|
|
|
|
|
|
|
|
|
|
| FYI, in circulation, this newspaper's average weekday
circulation of |
|
|
|
|
|
|
| approximately 1,121,057 ranks 3 out of
1,410 daily newspapers in the US. |
|
|
|
|
|
|
|
| See the notes and
definitions section below for the sources of these figures. |
|
|
| Details on race/ethnicity |
| in the circulation area |
| and the home county |
| of The New York Times |
|
|
Circulation area |
|
|
|
|
|
|
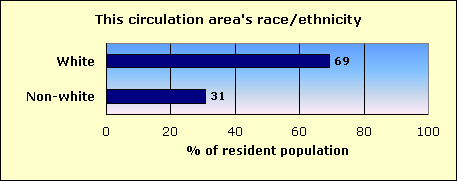
| Race/ethnicity |
% of population |
Number of residents |
|
|
|
|
|
|
|
| Hispanic |
12.5 |
35,305,818 |
|
|
|
|
|
|
|
| Black |
12.1 |
33,947,837 |
|
|
|
|
|
|
|
| Asian and Pacific Islander |
3.7 |
10,476,678 |
|
|
|
|
|
|
|
| Native-American |
0.7 |
2,068,883 |
|
|
|
|
|
|
|
| Other non-white |
0.2 |
467,770 |
|
|
|
|
|
|
|
| Multi-racial |
1.6 |
4,602,146 |
|
|
|
|
|
|
|
| Non-white |
30.9 |
86,869,132 |
|
|
|
|
|
|
|
| White |
69.1 |
194,552,774 |
|
|
|
|
|
|
|
| Total |
|
281,421,906 |
|
|
|
|
|
|
|
|
|
|
Home county: New York |
|
|
|
|
| Race/ethnicity |
% of population |
Number of residents |
|
|
|
|
|
|
|
| Hispanic |
27.2 |
417,816 |
|
|
|
|
|
|
|
| Black |
15.3 |
234,698 |
|
|
|
|
|
|
|
| Asian and Pacific Islander |
9.4 |
143,863 |
|
|
|
|
|
|
|
| Native-American |
0.2 |
2,465 |
|
|
|
|
|
|
|
| Other non-white |
0.4 |
5,536 |
|
|
|
|
|
|
|
| Multi-racial |
1.9 |
28,944 |
|
|
|
|
|
|
|
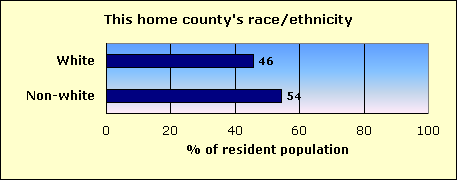
| Non-white |
54.2 |
833,322 |
|
|
|
|
|
|
|
| White |
45.8 |
703,873 |
|
|
|
|
|
|
|
| Total |
|
1,537,195 |
|
|
|
|
|
|
|
|
| The home county of
this newspaper is New York. |
|
|
| About this report |
|
| This third annual report for the Knight
Foundation adds context to an annual survey by the American Society of
Newspaper Editors. ASNE has set a goal that |
| every newspaper, to help it know its
community and gather the news, should employ at least one non-white
journalist, and that newspapers should strive to |
| employ non-whites in proportion to their
share of the community. ASNE's report, at www.asne.org, shows each
newspaper's non-white employment, but does |
| not disclose how closely that employment
mirrors the newspaper's circulation area. |
|
| That gap is filled by the report you are reading now. This
report was not done by ASNE, but was done for the Knight Foundation by Bill
Dedman and |
| Stephen K. Doig. It shows how close each
newspaper is to ASNE's goal, by comparing the newsroom staffing with the
circulation area population. |
| The full report is at
www.powerreporting.com/knight. |
|
|
| Notes and definitions |
|
| 1.
The Newsroom Diversity Index is the non-white percentage of the newsroom
staff divided by the non-white percentage of the circulation area's
residents. Parity = 100. |
| 2.
Source for staffing: Survey by American Society of Newspaper Editors, April
2005. Newspapers report non-white staff as of the end of the previous year. |
| 3.
Following ASNE's definition, newsroom staff includes only supervisors,
reporters, editors, copy/layout editors and photographers. |
| 4.
Also following ASNE's definition, "whites," "blacks,"
etc., exclude Hispanics, who are counted in a separate category. |
| 5. Source for
boundaries of this newspaper's circulation area: US population for a national
newspaper. |
| 6.
A paper may define its circulation area differently for marketing efforts, or
news coverage, or to set advertising rates. |
| 7.
If ZIP Codes or counties are used, this report applies a threshold: 10
percent household penetration is required to include an area in the
circulation area. |
| 8.
Source for the demographics of residents of that circulation area: US Census
2000. |
| 9.
Source for total circulation: Editor & Publisher magazine, Monday-Friday
average at year-end 2004. |
| 10.
Staff of non-English publications, such as the Miami Herald's El Nuevo
Herald, are excluded from the ASNE staffing survey for the first time this
year. |
| |
|
|
|
|
| File |
ny_the_new_york_times |
| Time |
5/17/05
6:29 PM |
| Page |
3 |
| Member |
130600 |
|
|
|
|
|
|
|
|
|
|
