
|
| Comparing the racial diversity of the journalists | ||||||||||
| at America's daily newspapers | ||||||||||
| with the communities that they serve | ||||||||||
| Newsroom diversity report for | ||||||||||
| Daily Freeman, Kingston | ||||||||||
| Kingston, New York | ||||||||||
| Owner: Journal Register (N.J.) | ||||||||||
| From a report for the Knight Foundation | ||||||||||
| by Bill Dedman and Stephen K. Doig, June 2005 | ||||||||||
| Click here to read the national report or to select another newspaper | ||||||||||
| Year | Non-white % of newsroom staff | 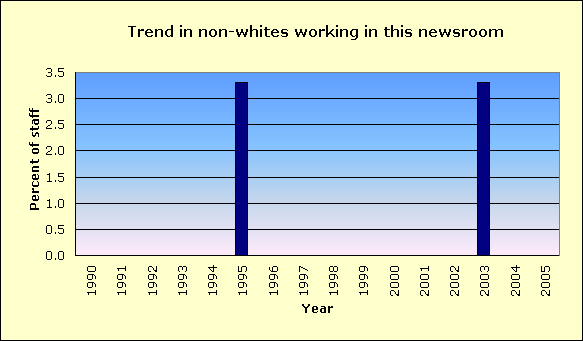
|
||||||||
| 2005 | Did not report | |||||||||
| 2004 | Did not report | |||||||||
| 2003 | 3.3 | |||||||||
| 2002 | 0.0 | |||||||||
| 2001 | 0.0 | |||||||||
| 2000 | 0.0 | |||||||||
| 1999 | Did not report | |||||||||
| 1998 | Did not report | |||||||||
| 1997 | Did not report | |||||||||
| 1996 | Did not report | |||||||||
| 1995 | 3.3 | |||||||||
| 1994 | 0.0 | |||||||||
| 1993 | 0.0 | |||||||||
| 1992 | 0.0 | |||||||||
| 1991 | Did not report | |||||||||
| 1990 | Did not report | |||||||||
| The latest year at peak is | 2003 | |||||||||
| See the notes and definitions section below for the sources of these figures. | ||||||||||
| Newsroom Diversity Index | ||||||||||
| for Daily Freeman, Kingston | ||||||||||
| Year | Non-white % of newsroom staff | Non-white % of circulation area | Newsroom Diversity Index (parity=100) | |||||||
| 2005 | N/A | 12.1 | N/A | |||||||
| 2004 | N/A | 12.1 | N/A | |||||||
| How the index is calculated | ||||||||||
| The Newsroom Diversity Index is the non-white percentage of the newsroom staff | ||||||||||
| divided by the non-white percentage of residents in the circulation area. | ||||||||||
| (Parity = 100.) | ||||||||||
| Company index | ||||||||||
| This newspaper's owner, Journal Register (N.J.), | ||||||||||
| has a companywide, circulation-weighted Diversity Index of 24. | ||||||||||
| See the notes and definitions section below for the sources of these figures. | ||||||||||
| Peer group comparison | ||||||||||
| for Daily Freeman, Kingston | ||||||||||
| This paper | ||||||||||
| Peer group | ||||||||||
| The median Diversity Index is 33 for all newspapers | ||||||||||
| reporting in this circulation category of 10,001 to 25,000 daily sales. | ||||||||||
| An example of a newspaper of similar circulation, in an area of similar level of non-white residents, but one that has a relatively high Diversity Index, is The Herald, Sharon, Pennsylvania, with a 8 percent non-white staff in a community that is 7.3 percent non-white. Its index is 110. | ||||||||||
| FYI, in circulation, this newspaper's average weekday circulation of | ||||||||||
| approximately 20,567 ranks 474 out of 1,410 daily newspapers in the US. | ||||||||||
| See the notes and definitions section below for the sources of these figures. | ||||||||||
| Details on race/ethnicity | ||||||||||
| in the circulation area | ||||||||||
| and the home county | ||||||||||
| of Daily Freeman, Kingston | ||||||||||
| Circulation area | ||||||||||
| Race/ethnicity | % of population | Number of residents | 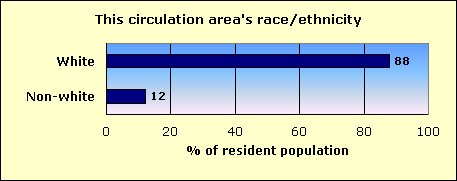
|
|||||||
| Hispanic | 4.4 | 7,387 | ||||||||
| Black | 4.6 | 7,879 | ||||||||
| Asian and Pacific Islander | 1.3 | 2,174 | ||||||||
| Native-American | 0.2 | 331 | ||||||||
| Other non-white | 0.2 | 347 | ||||||||
| Multi-racial | 1.5 | 2,515 | ||||||||
| Non-white | 12.1 | 20,633 | ||||||||
| White | 87.9 | 149,364 | ||||||||
| Total | 169,997 | |||||||||
| Home county: Ulster | ||||||||||
| Race/ethnicity | % of population | Number of residents | 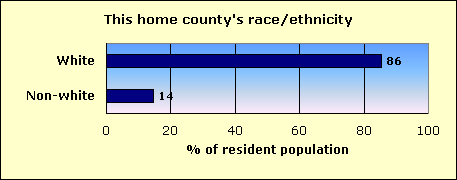
|
|||||||
| Hispanic | 6.2 | 10,941 | ||||||||
| Black | 5.1 | 9,044 | ||||||||
| Asian and Pacific Islander | 1.3 | 2,214 | ||||||||
| Native-American | 0.2 | 359 | ||||||||
| Other non-white | 0.2 | 390 | ||||||||
| Multi-racial | 1.5 | 2,737 | ||||||||
| Non-white | 14.5 | 25,685 | ||||||||
| White | 85.6 | 152,064 | ||||||||
| Total | 177,749 | |||||||||
| The home county of this newspaper is Ulster. | ||||||||||
| About this report | ||||||||||
| This third annual report for the Knight Foundation adds context to an annual survey by the American Society of Newspaper Editors. ASNE has set a goal that | ||||||||||
| every newspaper, to help it know its community and gather the news, should employ at least one non-white journalist, and that newspapers should strive to | ||||||||||
| employ non-whites in proportion to their share of the community. ASNE's report, at www.asne.org, shows each newspaper's non-white employment, but does | ||||||||||
| not disclose how closely that employment mirrors the newspaper's circulation area. | ||||||||||
| That gap is filled by the report you are reading now. This report was not done by ASNE, but was done for the Knight Foundation by Bill Dedman and | ||||||||||
| Stephen K. Doig. It shows how close each newspaper is to ASNE's goal, by comparing the newsroom staffing with the circulation area population. | ||||||||||
| The full report is at www.powerreporting.com/knight. | ||||||||||
| Notes and definitions | ||||||||||
| 1. The Newsroom Diversity Index is the non-white percentage of the newsroom staff divided by the non-white percentage of the circulation area's residents. Parity = 100. | ||||||||||
| 2. Source for staffing: Survey by American Society of Newspaper Editors, April 2005. Newspapers report non-white staff as of the end of the previous year. | ||||||||||
| 3. Following ASNE's definition, newsroom staff includes only supervisors, reporters, editors, copy/layout editors and photographers. | ||||||||||
| 4. Also following ASNE's definition, "whites," "blacks," etc., exclude Hispanics, who are counted in a separate category. | ||||||||||
| 5. Source for boundaries of this newspaper's circulation area: ZIP Code circulation data, Audit Bureau of Circulations, latest available. | ||||||||||
| 6. A paper may define its circulation area differently for marketing efforts, or news coverage, or to set advertising rates. | ||||||||||
| 7. If ZIP Codes or counties are used, this report applies a threshold: 10 percent household penetration is required to include an area in the circulation area. | ||||||||||
| 8. Source for the demographics of residents of that circulation area: US Census 2000. | ||||||||||
| 9. Source for total circulation: Editor & Publisher magazine, Monday-Friday average at year-end 2004. | ||||||||||
| 10. Staff of non-English publications, such as the Miami Herald's El Nuevo Herald, are excluded from the ASNE staffing survey for the first time this year. | ||||||||||
| Demographics of ZIP Codes | ||||||||||
| where sales were reported by | ||||||||||
| Daily Freeman, Kingston | ||||||||||
| Note that some ZIP Codes listed here may not have been included in determining the newspaper's circulation area. In calculating the Diversity Index, a | ||||||||||
| ZIP Code was included only if the household penetration was at least 10 percent. Any lower-penetration ZIP Codes are also listed here for your information. | ||||||||||
| Also, if the newspaper reported more than 300 ZIP Codes, only the top 300 in weekday sales are listed here. | ||||||||||
| ZIP / City / State / Approx. distance in miles from the newspaper's home office | Weekday sales | Households | Penetration % (daily sales per 100 households) | Median household income | Non-white % of population |
Hispanic % of population |
Black % of population |
Native % of population |
Asian % of population |
|
| 12401 / Kingston / NY / 0 mi. | 7,321 | 14,906 | 49.1 | $35,635 | 17.7 | 5.1 | 8.8 | 0.2 | 1.4 | |
| 12477 / Saugerties / NY / 11.6 mi. | 2,459 | 7,637 | 32.2 | $42,640 | 10.5 | 4.6 | 3.8 | 0.2 | 0.8 | |
| 12571 / Red Hook / NY / 14.2 mi. | 724 | 3,264 | 22.2 | $49,617 | 21.1 | 7.5 | 10.9 | 0.2 | 1.6 | |
| 12443 / Hurley / NY / 1.6 mi. | 721 | 1,546 | 46.6 | $56,903 | 5.3 | 1.9 | 1.2 | 0.1 | 1.3 | |
| 12498 / Woodstock / NY / 8.9 mi. | 708 | 2,501 | 28.3 | $49,941 | 8.4 | 3.2 | 1.4 | 0.1 | 1.9 | |
| 12466 / Port Ewen / NY / 4.5 mi. | 655 | 1,218 | 53.8 | $39,664 | 6.8 | 1.5 | 2.4 | 0.2 | 1.4 | |
| 12561 / New Paltz / NY / 12.5 mi. | 644 | 6,145 | 10.5 | $43,110 | 17.2 | 6.8 | 4.6 | 0.2 | 3.1 | |
| 12572 / Rhinebeck / NY / 9.8 mi. | 611 | 3,830 | 16.0 | $53,853 | 9.0 | 3.5 | 3.0 | 0.1 | 1.3 | |
| 12414 / Catskill / NY / 21.5 mi. | 578 | 4,675 | 12.4 | $34,375 | 12.6 | 3.8 | 5.9 | 0.3 | 0.7 | |
| 12449 / Lake Katrine / NY / 5.8 mi. | 561 | 1,215 | 46.2 | $42,625 | 8.9 | 2.0 | 3.1 | 0.1 | 2.1 | |
| 12484 / Stone Ridge / NY / 7.5 mi. | 537 | 1,008 | 53.3 | $46,726 | 5.8 | 2.3 | 1.1 | 0.1 | 1.3 | |
| 12491 / West Hurley / NY / 4.3 mi. | 365 | 648 | 56.3 | $46,053 | 5.5 | 1.6 | 1.5 | 0.1 | 1.4 | |
| 12472 / Rosendale / NY / 6.6 mi. | 364 | 730 | 49.9 | $36,250 | 8.8 | 4.2 | 2.2 | 0.3 | 0.6 | |
| 12446 / Kerhonkson / NY / 16.3 mi. | 363 | 1,915 | 19.0 | $40,394 | 11.0 | 6.4 | 2.1 | 0.3 | 0.8 | |
| 12487 / Ulster Park / NY / 6 mi. | 273 | 1,384 | 19.7 | $49,818 | 6.1 | 1.9 | 2.2 | 0.1 | 0.6 | |
| 12404 / Accord / NY / 12.4 mi. | 272 | 1,424 | 19.1 | $48,606 | 8.6 | 4.1 | 1.8 | 0.3 | 0.4 | |
| 12481 / Shokan / NY / 8.7 mi. | 245 | 505 | 48.5 | $52,411 | 6.0 | 2.7 | 0.7 | 0.2 | 1.6 | |
| 12486 / Tillson / NY / 7.3 mi. | 210 | 598 | 35.1 | $49,353 | 4.5 | 2.1 | 0.8 | 0.1 | 0.3 | |
| 12526 / Germantown / NY / 16.5 mi. | 204 | 1,421 | 14.4 | $43,025 | 4.9 | 2.1 | 1.4 | 0.1 | 0.5 | |
| 12464 / Phoenicia / NY / 18.4 mi. | 183 | 544 | 33.6 | $29,706 | 6.1 | 2.3 | 0.6 | 0.4 | 0.8 | |
| 12440 / High Falls / NY / 10.7 mi. | 181 | 866 | 20.9 | $38,203 | 6.9 | 3.0 | 1.6 | 0.2 | 0.4 | |
| 12461 / Olivebridge / NY / 10 mi. | 170 | 722 | 23.5 | $42,400 | 5.0 | 1.9 | 0.5 | 0.1 | 1.2 | |
| 12412 / Boiceville / NY / 10.7 mi. | 157 | 393 | 39.9 | $39,948 | 6.7 | 3.2 | 0.4 | 0.7 | 0.4 | |
| 12428 / Ellenville / NY / 24.2 mi. | 139 | 2,573 | 5.4 | $34,198 | 44.3 | 23.4 | 16.6 | 0.3 | 1.3 | |
| 12583 / Tivoli / NY / 11.9 mi. | 133 | 919 | 14.5 | $44,458 | 6.1 | 3.1 | 0.4 | 0.1 | 1.0 | |
| 12463 / Palenville / NY / 17.3 mi. | 127 | 533 | 23.8 | $36,908 | 4.9 | 1.9 | 0.4 | 0.2 | 0.9 | |
| 12413 / Cairo / NY / 26.6 mi. | 119 | 1,141 | 10.4 | $30,521 | 7.0 | 4.0 | 0.6 | 0.4 | 0.5 | |
| 12528 / Highland / NY / 15.5 mi. | 117 | 4,692 | 2.5 | $49,131 | 14.7 | 7.1 | 4.4 | 0.2 | 1.2 | |
| 12456 / Mount Marion / NY / 7.7 mi. | 116 | 239 | 48.5 | $31,739 | 5.2 | 0.8 | 4.0 | 0.3 | 0.0 | |
| 12538 / Hyde Park / NY / 12.3 mi. | 109 | 4,849 | 2.2 | $48,758 | 9.9 | 3.3 | 3.5 | 0.2 | 1.5 | |
| 12485 / Tannersville / NY / 19.1 mi. | 104 | 508 | 20.5 | $29,850 | 3.9 | 1.6 | 0.4 | 0.0 | 0.2 | |
| 12409 / Bearsville / NY / 9.3 mi. | 96 | 232 | 41.4 | $37,813 | 5.4 | 3.2 | 0.9 | 0.2 | 0.0 | |
| 12523 / Elizaville / NY / 18.8 mi. | 89 | 798 | 11.2 | $40,385 | 4.3 | 2.5 | 0.6 | 0.1 | 0.5 | |
| 12419 / Cottekill / NY / 6.3 mi. | 81 | 128 | 63.3 | $35,893 | 6.7 | 1.6 | 1.9 | 0.3 | 0.0 | |
| 12534 / Hudson / NY / 25.9 mi. | 80 | 7,422 | 1.1 | $32,741 | 20.2 | 4.9 | 11.6 | 0.2 | 1.4 | |
| 12429 / Esopus / NY / 8.6 mi. | 73 | 21 | 347.6 | $200,001 | 9.8 | 0.0 | 5.9 | 0.0 | 3.9 | |
| 12494 / West Shokan / NY / 12.5 mi. | 68 | 302 | 22.5 | $48,654 | 5.3 | 2.5 | 0.4 | 0.1 | 0.4 | |
| 12457 / Mount Tremper / NY / 13.2 mi. | 66 | 501 | 13.2 | $42,026 | 5.8 | 2.4 | 0.9 | 0.2 | 0.6 | |
| 12471 / Rifton / NY / 6.6 mi. | 61 | 77 | 79.2 | $35,833 | 6.9 | 1.7 | 0.6 | 1.7 | 1.7 | |
| 12525 / Gardiner / NY / 18 mi. | 60 | 1,096 | 5.5 | $52,841 | 9.8 | 6.4 | 1.3 | 0.0 | 0.8 | |
| 12601 / Poughkeepsie / NY / 16.9 mi. | 57 | 15,394 | 0.4 | $32,594 | 40.4 | 8.6 | 25.9 | 0.2 | 2.8 | |
| 12015 / Athens / NY / 27.5 mi. | 56 | 1,123 | 5.0 | $42,143 | 4.8 | 1.5 | 0.9 | 0.1 | 0.6 | |
| 12455 / Margaretville / NY / 34.3 mi. | 52 | 868 | 6.0 | $31,569 | 8.0 | 6.3 | 0.6 | 0.1 | 0.4 | |
| 12411 / Bloomington / NY / 3.8 mi. | 50 | 151 | 33.1 | $37,679 | 3.4 | 0.5 | 0.5 | 0.0 | 1.1 | |
| 12580 / Staatsburg / NY / 10.6 mi. | 48 | 1,433 | 3.3 | $61,250 | 5.8 | 2.0 | 1.7 | 0.0 | 0.7 | |
| 12433 / Glenford / NY / 7.2 mi. | 42 | 187 | 22.5 | $38,958 | 4.5 | 1.5 | 0.7 | 0.3 | 1.2 | |
| 12480 / Shandaken / NY / 21.2 mi. | 41 | 341 | 12.0 | $36,750 | 9.2 | 2.9 | 1.0 | 0.4 | 2.3 | |
| 12458 / Napanoch / NY / 19.8 mi. | 37 | 909 | 4.1 | $38,750 | 11.1 | 7.1 | 1.4 | 0.1 | 0.7 | |
| 12442 / Hunter / NY / 22.5 mi. | 34 | 282 | 12.1 | $30,682 | 4.0 | 1.5 | 1.2 | 0.0 | 0.2 | |
| 12451 / Leeds / NY / 26.8 mi. | 34 | 611 | 5.6 | $35,929 | 5.9 | 4.4 | 0.8 | 0.3 | 0.1 | |
| 12410 / Big Indian / NY / 24.1 mi. | 28 | 354 | 7.9 | $32,344 | 8.2 | 3.3 | 1.0 | 0.2 | 1.8 | |
| 12567 / Pine Plains / NY / 20.5 mi. | 28 | 1,130 | 2.5 | $44,147 | 4.4 | 1.4 | 0.7 | 0.4 | 0.8 | |
| 12430 / Fleischmanns / NY / 29.9 mi. | 27 | 484 | 5.6 | $32,065 | 12.0 | 9.0 | 0.6 | 0.1 | 1.0 | |
| 12495 / Willow / NY / 13.2 mi. | 24 | 87 | 27.6 | $55,000 | 4.8 | 3.2 | 0.0 | 0.0 | 1.1 | |
| 12482 / South Cairo / NY / 24.1 mi. | 23 | 192 | 12.0 | $28,036 | 7.3 | 4.2 | 0.9 | 0.0 | 0.0 | |
| 12548 / Modena / NY / 19.7 mi. | 23 | 583 | 3.9 | $43,409 | 14.0 | 7.1 | 4.4 | 0.1 | 0.6 | |
| 12192 / West Coxsackie / NY / 35 mi. | 22 | 857 | 2.6 | $44,250 | 4.6 | 2.6 | 0.7 | 0.2 | 0.4 | |
| 12542 / Marlboro / NY / 22.3 mi. | 21 | 2,133 | 1.0 | $49,250 | 8.3 | 4.4 | 2.3 | 0.2 | 0.4 | |
| 12405 / Acra / NY / 28.1 mi. | 19 | 194 | 9.8 | $48,846 | 6.4 | 4.6 | 0.2 | 0.0 | 0.0 | |
| 12514 / Clinton Corners / NY / 15.4 mi. | 19 | 1,066 | 1.8 | $62,553 | 5.7 | 1.7 | 1.7 | 0.1 | 1.3 | |
| 12589 / Wallkill / NY / 22.4 mi. | 19 | 4,162 | 0.5 | $54,333 | 22.8 | 13.3 | 7.8 | 0.2 | 0.7 | |
| 12489 / Wawarsing / NY / 19.6 mi. | 17 | 115 | 14.8 | $46,875 | 16.6 | 8.3 | 6.2 | 0.0 | 0.3 | |
| 12578 / Salt Point / NY / 15.9 mi. | 16 | 765 | 2.1 | $60,650 | 6.4 | 2.0 | 1.8 | 0.4 | 0.4 | |
| 12496 / Windham / NY / 29.4 mi. | 15 | 489 | 3.1 | $36,641 | 2.9 | 1.8 | 0.0 | 0.6 | 0.1 | |
| 12406 / Arkville / NY / 26.4 mi. | 11 | 410 | 2.7 | $27,054 | 4.9 | 2.9 | 0.2 | 0.1 | 1.0 | |
| 12474 / Roxbury / NY / 36.2 mi. | 3 | 422 | 0.7 | $34,519 | 3.5 | 1.7 | 0.2 | 0.4 | 0.4 | |
| File | ny_daily_freeman__kingston | |||||||||
| Time | 5/21/05 10:01 AM | |||||||||
| Page | 474 | |||||||||
| Member | 129830 | |||||||||