
|
| Comparing the racial diversity of the journalists | ||||||||||
| at America's daily newspapers | ||||||||||
| with the communities that they serve | ||||||||||
| Newsroom diversity report for | ||||||||||
| The Independent, Gallup | ||||||||||
| Gallup, New Mexico | ||||||||||
| From a report for the Knight Foundation | ||||||||||
| by Bill Dedman and Stephen K. Doig, June 2005 | ||||||||||
| Click here to read the national report or to select another newspaper | ||||||||||
| Year | Non-white % of newsroom staff | 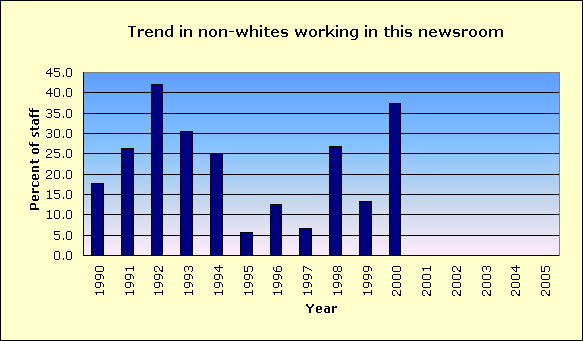
|
||||||||
| 2005 | Did not report | |||||||||
| 2004 | 0.0 | |||||||||
| 2003 | Did not report | |||||||||
| 2002 | Did not report | |||||||||
| 2001 | Did not report | |||||||||
| 2000 | 37.5 | |||||||||
| 1999 | 13.3 | |||||||||
| 1998 | 26.7 | |||||||||
| 1997 | 6.7 | |||||||||
| 1996 | 12.5 | |||||||||
| 1995 | 5.6 | |||||||||
| 1994 | 25.0 | |||||||||
| 1993 | 30.4 | |||||||||
| 1992 | 42.1 | |||||||||
| 1991 | 26.3 | |||||||||
| 1990 | 17.7 | |||||||||
| The latest year at peak is | 1992 | |||||||||
| See the notes and definitions section below for the sources of these figures. | ||||||||||
| Newsroom Diversity Index | ||||||||||
| for The Independent, Gallup | ||||||||||
| Year | Non-white % of newsroom staff | Non-white % of circulation area | Newsroom Diversity Index (parity=100) | |||||||
| 2005 | N/A | 92.7 | N/A | |||||||
| 2004 | 0.0 | 92.7 | 0 | |||||||
| How the index is calculated | ||||||||||
| The Newsroom Diversity Index is the non-white percentage of the newsroom staff | ||||||||||
| divided by the non-white percentage of residents in the circulation area. | ||||||||||
| (Parity = 100.) | ||||||||||
| See the notes and definitions section below for the sources of these figures. | ||||||||||
| Peer group comparison | ||||||||||
| for The Independent, Gallup | ||||||||||
| This paper | ||||||||||
| Peer group | ||||||||||
| The median Diversity Index is 33 for all newspapers | ||||||||||
| reporting in this circulation category of 10,001 to 25,000 daily sales. | ||||||||||
| An example of a newspaper of similar circulation, in an area of similar level of non-white residents, but one that has a relatively high Diversity Index, is Laredo Morning Times, Texas, with a 91.3 percent non-white staff in a community that is 94.4 percent non-white. Its index is 97. | ||||||||||
| FYI, in circulation, this newspaper's average weekday circulation of | ||||||||||
| approximately 15,552 ranks 599 out of 1,410 daily newspapers in the US. | ||||||||||
| See the notes and definitions section below for the sources of these figures. | ||||||||||
| Details on race/ethnicity | ||||||||||
| in the circulation area | ||||||||||
| and the home county | ||||||||||
| of The Independent, Gallup | ||||||||||
| Circulation area | ||||||||||
| Race/ethnicity | % of population | Number of residents | 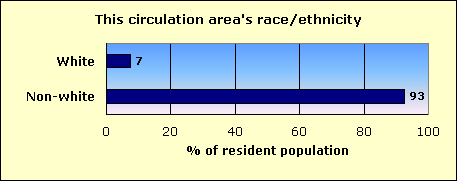
|
|||||||
| Hispanic | 6.2 | 9,000 | ||||||||
| Black | 0.2 | 341 | ||||||||
| Asian and Pacific Islander | 0.3 | 441 | ||||||||
| Native-American | 84.8 | 123,679 | ||||||||
| Other non-white | 0.0 | 45 | ||||||||
| Multi-racial | 1.1 | 1,655 | ||||||||
| Non-white | 92.7 | 135,161 | ||||||||
| White | 7.3 | 10,669 | ||||||||
| Total | 145,830 | |||||||||
| Home county: McKinley | ||||||||||
| Race/ethnicity | % of population | Number of residents | 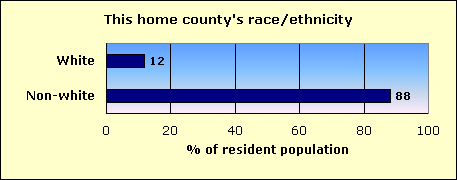
|
|||||||
| Hispanic | 12.4 | 9,276 | ||||||||
| Black | 0.4 | 287 | ||||||||
| Asian and Pacific Islander | 0.5 | 352 | ||||||||
| Native-American | 73.2 | 54,742 | ||||||||
| Other non-white | 0.1 | 46 | ||||||||
| Multi-racial | 1.6 | 1,193 | ||||||||
| Non-white | 88.1 | 65,896 | ||||||||
| White | 11.9 | 8,902 | ||||||||
| Total | 74,798 | |||||||||
| The home county of this newspaper is McKinley. | ||||||||||
| About this report | ||||||||||
| This third annual report for the Knight Foundation adds context to an annual survey by the American Society of Newspaper Editors. ASNE has set a goal that | ||||||||||
| every newspaper, to help it know its community and gather the news, should employ at least one non-white journalist, and that newspapers should strive to | ||||||||||
| employ non-whites in proportion to their share of the community. ASNE's report, at www.asne.org, shows each newspaper's non-white employment, but does | ||||||||||
| not disclose how closely that employment mirrors the newspaper's circulation area. | ||||||||||
| That gap is filled by the report you are reading now. This report was not done by ASNE, but was done for the Knight Foundation by Bill Dedman and | ||||||||||
| Stephen K. Doig. It shows how close each newspaper is to ASNE's goal, by comparing the newsroom staffing with the circulation area population. | ||||||||||
| The full report is at www.powerreporting.com/knight. | ||||||||||
| Notes and definitions | ||||||||||
| 1. The Newsroom Diversity Index is the non-white percentage of the newsroom staff divided by the non-white percentage of the circulation area's residents. Parity = 100. | ||||||||||
| 2. Source for staffing: Survey by American Society of Newspaper Editors, April 2005. Newspapers report non-white staff as of the end of the previous year. | ||||||||||
| 3. Following ASNE's definition, newsroom staff includes only supervisors, reporters, editors, copy/layout editors and photographers. | ||||||||||
| 4. Also following ASNE's definition, "whites," "blacks," etc., exclude Hispanics, who are counted in a separate category. | ||||||||||
| 5. Source for boundaries of this newspaper's circulation area: ZIP Code circulation data, Audit Bureau of Circulations, latest available. | ||||||||||
| 6. A paper may define its circulation area differently for marketing efforts, or news coverage, or to set advertising rates. | ||||||||||
| 7. If ZIP Codes or counties are used, this report applies a threshold: 10 percent household penetration is required to include an area in the circulation area. | ||||||||||
| 8. Source for the demographics of residents of that circulation area: US Census 2000. | ||||||||||
| 9. Source for total circulation: Editor & Publisher magazine, Monday-Friday average at year-end 2004. | ||||||||||
| 10. Staff of non-English publications, such as the Miami Herald's El Nuevo Herald, are excluded from the ASNE staffing survey for the first time this year. | ||||||||||
| Demographics of ZIP Codes | ||||||||||
| where sales were reported by | ||||||||||
| The Independent, Gallup | ||||||||||
| Note that some ZIP Codes listed here may not have been included in determining the newspaper's circulation area. In calculating the Diversity Index, a | ||||||||||
| ZIP Code was included only if the household penetration was at least 10 percent. Any lower-penetration ZIP Codes are also listed here for your information. | ||||||||||
| Also, if the newspaper reported more than 300 ZIP Codes, only the top 300 in weekday sales are listed here. | ||||||||||
| ZIP / City / State / Approx. distance in miles from the newspaper's home office | Weekday sales | Households | Penetration % (daily sales per 100 households) | Median household income | Non-white % of population |
Hispanic % of population |
Black % of population |
Native % of population |
Asian % of population |
|
| 87301 / Gallup / NM / 0 mi. | 4,956 | 7,482 | 66.2 | $33,632 | 74.4 | 31.0 | 1.0 | 37.7 | 1.4 | |
| 86515 / Window Rock / AZ / 24.8 mi. | 1,516 | 1,237 | 122.6 | $37,206 | 95.8 | 1.7 | 0.2 | 92.8 | 0.3 | |
| 87313 / Crownpoint / NM / 53.2 mi. | 811 | 1,692 | 47.9 | $21,276 | 96.1 | 0.9 | 0.2 | 94.2 | 0.2 | |
| 86503 / Chinle / AZ / 66.8 mi. | 808 | 2,920 | 27.7 | $21,201 | 96.7 | 1.3 | 0.1 | 94.5 | 0.1 | |
| 87327 / Zuni / NM / 23.7 mi. | 737 | 1,869 | 39.4 | $21,010 | 97.1 | 2.1 | 0.1 | 94.3 | 0.1 | |
| 86504 / Fort Defiance / AZ / 30.5 mi. | 568 | 1,434 | 39.6 | $30,266 | 96.4 | 1.1 | 0.1 | 93.7 | 0.3 | |
| 86505 / Ganado / AZ / 43 mi. | 551 | 2,598 | 21.2 | $20,449 | 97.2 | 1.0 | 0.0 | 95.8 | 0.1 | |
| 86033 / Kayenta / AZ / 122.3 mi. | 450 | 2,210 | 20.4 | $22,911 | 96.0 | 1.0 | 0.1 | 94.0 | 0.1 | |
| 86511 / Saint Michaels / AZ / 26.3 mi. | 436 | 826 | 52.8 | $29,643 | 96.8 | 1.3 | 0.0 | 94.7 | 0.0 | |
| 87020 / Grants / NM / 57 mi. | 404 | 4,966 | 8.1 | $29,728 | 64.4 | 50.8 | 1.5 | 9.9 | 0.7 | |
| 87323 / Thoreau / NM / 65.4 mi. | 382 | 1,245 | 30.7 | $23,496 | 87.9 | 5.4 | 0.2 | 81.1 | 0.2 | |
| 87420 / Shiprock / NM / 66.6 mi. | 375 | 2,864 | 13.1 | $23,724 | 98.3 | 1.2 | 0.1 | 96.4 | 0.1 | |
| 86045 / Tuba City / AZ / 152.6 mi. | 367 | 2,649 | 13.9 | $36,192 | 95.7 | 2.1 | 0.1 | 92.2 | 0.2 | |
| 87325 / Tohatchi / NM / 27.9 mi. | 319 | 647 | 49.3 | $19,811 | 96.9 | 2.5 | 0.0 | 93.1 | 0.2 | |
| 86512 / Sanders / AZ / 35.8 mi. | 290 | 631 | 46.0 | $20,798 | 91.4 | 2.0 | 0.4 | 87.7 | 0.0 | |
| 87328 / Navajo / NM / 33.8 mi. | 231 | 807 | 28.6 | $14,922 | 97.8 | 1.0 | 0.0 | 96.5 | 0.0 | |
| 87007 / Casa Blanca / NM / 81.2 mi. | 204 | 246 | 82.9 | $29,688 | 99.0 | 3.3 | 0.0 | 94.6 | 0.0 | |
| 87321 / Ramah / NM / 24.4 mi. | 196 | 841 | 23.3 | $24,447 | 77.3 | 3.7 | 0.1 | 71.1 | 0.3 | |
| 87417 / Kirtland / NM / 93.2 mi. | 171 | 1,828 | 9.4 | $44,455 | 58.4 | 9.5 | 0.2 | 46.3 | 0.3 | |
| 86510 / Pinon / AZ / 99.2 mi. | 156 | 1,359 | 11.5 | $13,797 | 97.7 | 0.8 | 0.0 | 96.7 | 0.0 | |
| 87034 / Pueblo of Acoma / NM / 68 mi. | 156 | 667 | 23.4 | $26,149 | 98.5 | 2.1 | 0.1 | 96.0 | 0.0 | |
| 87326 / Vanderwagen / NM / 11.2 mi. | 156 | 414 | 37.7 | $19,167 | 90.4 | 4.2 | 0.0 | 84.6 | 0.0 | |
| 87311 / Church Rock / NM / 9.8 mi. | 152 | 1,026 | 14.8 | $14,964 | 98.8 | 0.9 | 0.0 | 97.3 | 0.0 | |
| 87320 / Mexican Springs / NM / 24.2 mi. | 151 | 206 | 73.3 | $25,125 | 99.9 | 0.1 | 0.0 | 99.5 | 0.1 | |
| 87316 / Fort Wingate / NM / 11 mi. | 147 | 365 | 40.3 | $22,933 | 93.7 | 2.6 | 0.1 | 89.3 | 0.0 | |
| 86538 / Many Farms / AZ / 85 mi. | 143 | 699 | 20.5 | $25,675 | 95.2 | 1.6 | 0.2 | 91.6 | 0.1 | |
| 86025 / Holbrook / AZ / 83.8 mi. | 132 | 2,310 | 5.7 | $32,123 | 44.9 | 18.5 | 1.8 | 21.2 | 0.9 | |
| 86535 / Dennehotso / AZ / 110.3 mi. | 110 | 315 | 34.9 | $12,222 | 99.3 | 0.8 | 0.0 | 97.7 | 0.0 | |
| 86508 / Lupton / AZ / 19.5 mi. | 91 | 263 | 34.6 | $9,936 | 95.9 | 3.2 | 0.2 | 91.0 | 0.0 | |
| 87401 / Farmington / NM / 70.9 mi. | 85 | 14,190 | 0.6 | $34,207 | 45.0 | 18.8 | 0.7 | 23.2 | 0.4 | |
| 86514 / Teec Nos Pos / AZ / 98 mi. | 84 | 1,051 | 8.0 | $12,979 | 97.9 | 0.9 | 0.0 | 95.8 | 0.2 | |
| 86507 / Lukachukai / AZ / 76.2 mi. | 78 | 587 | 13.3 | $9,808 | 99.1 | 1.0 | 0.0 | 98.0 | 0.1 | |
| 87455 / Newcomb / NM / 66.7 mi. | 75 | 469 | 16.0 | $12,188 | 98.5 | 1.2 | 0.0 | 96.5 | 0.0 | |
| 86039 / Kykotsmovi Village / AZ / 110.8 mi. | 64 | 694 | 9.2 | $13,487 | 97.0 | 1.3 | 0.3 | 94.5 | 0.1 | |
| 87312 / Continental Divide / NM / 15.7 mi. | 63 | 193 | 32.6 | $21,667 | 80.7 | 9.1 | 0.2 | 69.0 | 1.0 | |
| 84534 / Montezuma Creek / UT / 131.7 mi. | 61 | 438 | 13.9 | $14,583 | 97.6 | 0.8 | 0.0 | 96.3 | 0.0 | |
| 86042 / Polacca / AZ / 103.1 mi. | 61 | 396 | 15.4 | $17,963 | 97.8 | 2.2 | 0.0 | 94.9 | 0.1 | |
| 86556 / Tsaile / AZ / 68.5 mi. | 48 | 479 | 10.0 | $16,250 | 97.6 | 0.9 | 0.1 | 95.0 | 0.1 | |
| 86034 / Keams Canyon / AZ / 86.6 mi. | 44 | 588 | 7.5 | $23,281 | 93.2 | 2.7 | 0.2 | 89.7 | 0.1 | |
| 87416 / Fruitland / NM / 93.4 mi. | 43 | 1,329 | 3.2 | $26,926 | 89.6 | 3.1 | 0.0 | 85.1 | 0.1 | |
| 87375 / Yatahey / NM / 6.6 mi. | 41 | 1,105 | 3.7 | $30,357 | 98.1 | 3.5 | 0.0 | 93.8 | 0.1 | |
| 87364 / Sheep Springs / NM / 49.3 mi. | 39 | 769 | 5.1 | $16,646 | 97.8 | 0.8 | 0.0 | 96.2 | 0.0 | |
| 86506 / Houck / AZ / 26.3 mi. | 30 | 451 | 6.7 | $16,094 | 97.3 | 1.0 | 0.0 | 94.8 | 0.0 | |
| 86030 / Hotevilla / AZ / 118.5 mi. | 22 | 165 | 13.3 | $10,625 | 97.2 | 2.4 | 0.0 | 94.6 | 0.0 | |
| File | nm_the_independent__gallup | |||||||||
| Time | 5/19/05 9:03 PM | |||||||||
| Page | 598 | |||||||||
| Member | 128600 | |||||||||