
|
| Comparing the racial diversity of the journalists | ||||||||||
| at America's daily newspapers | ||||||||||
| with the communities that they serve | ||||||||||
| Newsroom diversity report for | ||||||||||
| The Record, Hackensack | ||||||||||
| Hackensack, New Jersey | ||||||||||
| From a report for the Knight Foundation | ||||||||||
| by Bill Dedman and Stephen K. Doig, June 2005 | ||||||||||
| Click here to read the national report or to select another newspaper | ||||||||||
| Year | Non-white % of newsroom staff | 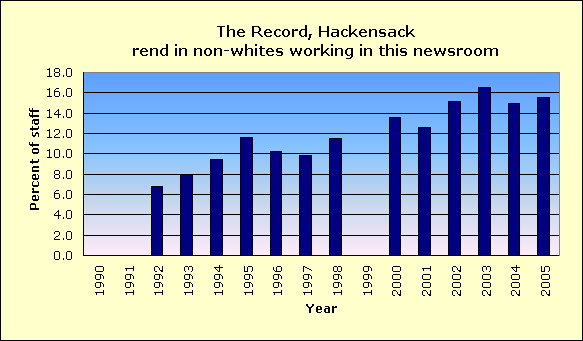
|
||||||||
| 2005 | 15.5 | |||||||||
| 2004 | 15.0 | |||||||||
| 2003 | 16.5 | |||||||||
| 2002 | 15.1 | |||||||||
| 2001 | 12.6 | |||||||||
| 2000 | 13.6 | |||||||||
| 1999 | Did not report | |||||||||
| 1998 | 11.5 | |||||||||
| 1997 | 9.8 | |||||||||
| 1996 | 10.2 | |||||||||
| 1995 | 11.6 | |||||||||
| 1994 | 9.4 | |||||||||
| 1993 | 8.0 | |||||||||
| 1992 | 6.8 | |||||||||
| 1991 | Did not report | |||||||||
| 1990 | Did not report | |||||||||
| The latest year at peak is | 2003 | |||||||||
| See the notes and definitions section below for the sources of these figures. | ||||||||||
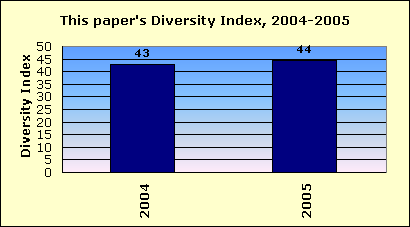
| Newsroom Diversity Index | ||||||||||
| for The Record, Hackensack | ||||||||||
 |
||||||||||
| Year | Non-white % of newsroom staff | Non-white % of circulation area | Newsroom Diversity Index (parity=100) | |||||||
| 2005 | 15.5 | 34.9 | 44 | |||||||
| 2004 | 15.0 | 34.9 | 43 | |||||||
| How the index is calculated | ||||||||||
| The Newsroom Diversity Index is the non-white percentage of the newsroom staff | ||||||||||
| divided by the non-white percentage of residents in the circulation area. | ||||||||||
| (Parity = 100.) | ||||||||||
| See the notes and definitions section below for the sources of these figures. | ||||||||||
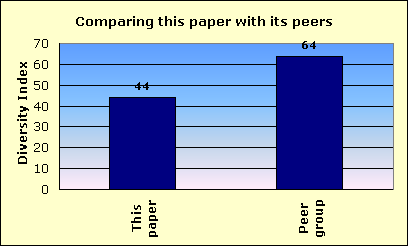
| Peer group comparison | ||||||||||
| for The Record, Hackensack | ||||||||||
 |
||||||||||
| This newspaper's Newsroom Diversity Index is 44. | This paper | |||||||||
| Peer group | ||||||||||
| Compare that with 64, which is the median Diversity Index for all newspapers | ||||||||||
| reporting in this circulation category of 100,001 to 250,000 daily sales. | ||||||||||
| In that group, this newspaper's Diversity Index ranks 45 out of 58 | ||||||||||
| newspapers reporting in the category of 100,001 to 250,000 daily sales. | ||||||||||
| An example of a newspaper of similar circulation, in an area of similar level of non-white residents, but one that has a relatively high Diversity Index, is The News & Observer, Raleigh, North Carolina, with a 21 percent non-white staff in a community that is 30.8 percent non-white. Its index is 68. | ||||||||||
| FYI, in circulation, this newspaper's average weekday circulation of | ||||||||||
| approximately 176,177 ranks 62 out of 1,410 daily newspapers in the US. | ||||||||||
| See the notes and definitions section below for the sources of these figures. | ||||||||||
| Details on race/ethnicity | ||||||||||
| in the circulation area | ||||||||||
| and the home county | ||||||||||
| of The Record, Hackensack | ||||||||||
| Circulation area | ||||||||||
| Race/ethnicity | % of population | Number of residents | 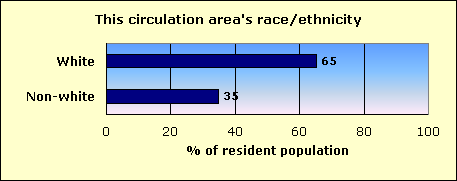
|
|||||||
| Hispanic | 16.9 | 244,923 | ||||||||
| Black | 8.0 | 115,239 | ||||||||
| Asian and Pacific Islander | 8.0 | 115,363 | ||||||||
| Native-American | 0.1 | 1,713 | ||||||||
| Other non-white | 0.2 | 2,959 | ||||||||
| Multi-racial | 1.7 | 24,360 | ||||||||
| Non-white | 34.9 | 504,557 | ||||||||
| White | 65.1 | 941,030 | ||||||||
| Total | 1,445,587 | |||||||||
| Home county: Bergen | ||||||||||
| Race/ethnicity | % of population | Number of residents | 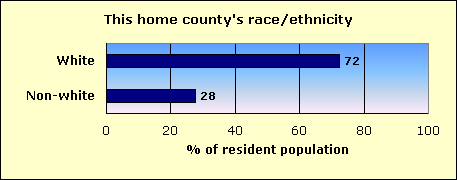
|
|||||||
| Hispanic | 10.3 | 91,377 | ||||||||
| Black | 5.0 | 44,149 | ||||||||
| Asian and Pacific Islander | 10.7 | 94,116 | ||||||||
| Native-American | 0.1 | 824 | ||||||||
| Other non-white | 0.2 | 1,659 | ||||||||
| Multi-racial | 1.5 | 13,040 | ||||||||
| Non-white | 27.7 | 245,165 | ||||||||
| White | 72.3 | 638,953 | ||||||||
| Total | 884,118 | |||||||||
| The home county of this newspaper is Bergen. | ||||||||||
| About this report | ||||||||||
| This third annual report for the Knight Foundation adds context to an annual survey by the American Society of Newspaper Editors. ASNE has set a goal that | ||||||||||
| every newspaper, to help it know its community and gather the news, should employ at least one non-white journalist, and that newspapers should strive to | ||||||||||
| employ non-whites in proportion to their share of the community. ASNE's report, at www.asne.org, shows each newspaper's non-white employment, but does | ||||||||||
| not disclose how closely that employment mirrors the newspaper's circulation area. | ||||||||||
| That gap is filled by the report you are reading now. This report was not done by ASNE, but was done for the Knight Foundation by Bill Dedman and | ||||||||||
| Stephen K. Doig. It shows how close each newspaper is to ASNE's goal, by comparing the newsroom staffing with the circulation area population. | ||||||||||
| The full report is at www.powerreporting.com/knight. | ||||||||||
| Notes and definitions | ||||||||||
| 1. The Newsroom Diversity Index is the non-white percentage of the newsroom staff divided by the non-white percentage of the circulation area's residents. Parity = 100. | ||||||||||
| 2. Source for staffing: Survey by American Society of Newspaper Editors, April 2005. Newspapers report non-white staff as of the end of the previous year. | ||||||||||
| 3. Following ASNE's definition, newsroom staff includes only supervisors, reporters, editors, copy/layout editors and photographers. | ||||||||||
| 4. Also following ASNE's definition, "whites," "blacks," etc., exclude Hispanics, who are counted in a separate category. | ||||||||||
| 5. Source for boundaries of this newspaper's circulation area: ZIP Code circulation data, Audit Bureau of Circulations, latest available. | ||||||||||
| 6. A paper may define its circulation area differently for marketing efforts, or news coverage, or to set advertising rates. | ||||||||||
| 7. If ZIP Codes or counties are used, this report applies a threshold: 10 percent household penetration is required to include an area in the circulation area. | ||||||||||
| 8. Source for the demographics of residents of that circulation area: US Census 2000. | ||||||||||
| 9. Source for total circulation: Editor & Publisher magazine, Monday-Friday average at year-end 2004. | ||||||||||
| 10. Staff of non-English publications, such as the Miami Herald's El Nuevo Herald, are excluded from the ASNE staffing survey for the first time this year. | ||||||||||
| Demographics of ZIP Codes | ||||||||||
| where sales were reported by | ||||||||||
| The Record, Hackensack | ||||||||||
| Note that some ZIP Codes listed here may not have been included in determining the newspaper's circulation area. In calculating the Diversity Index, a | ||||||||||
| ZIP Code was included only if the household penetration was at least 10 percent. Any lower-penetration ZIP Codes are also listed here for your information. | ||||||||||
| Also, if the newspaper reported more than 300 ZIP Codes, only the top 300 in weekday sales are listed here. | ||||||||||
| ZIP / City / State / Approx. distance in miles from the newspaper's home office | Weekday sales | Households | Penetration % (daily sales per 100 households) | Median household income | Non-white % of population |
Hispanic % of population |
Black % of population |
Native % of population |
Asian % of population |
|
| 07501 / Paterson / NJ / 6.7 mi. | 9,767 | 10,299 | 94.8 | $24,938 | 89.4 | 56.3 | 29.9 | 0.2 | 1.4 | |
| 07470 / Wayne / NJ / 11.1 mi. | 8,041 | 18,755 | 42.9 | $83,651 | 13.5 | 5.1 | 1.6 | 0.1 | 5.7 | |
| 07601 / Hackensack / NJ / 0 mi. | 6,517 | 18,113 | 36.0 | $49,316 | 60.1 | 25.9 | 23.7 | 0.2 | 7.4 | |
| 07055 / Passaic / NJ / 4.8 mi. | 5,379 | 19,459 | 27.6 | $33,633 | 81.8 | 62.5 | 11.9 | 0.1 | 5.3 | |
| 07652 / Paramus / NJ / 4.1 mi. | 4,729 | 8,082 | 58.5 | $76,918 | 24.5 | 4.9 | 1.1 | 0.0 | 17.2 | |
| 07410 / Fair Lawn / NJ / 4.9 mi. | 4,448 | 11,806 | 37.7 | $72,127 | 12.3 | 5.5 | 0.7 | 0.0 | 4.9 | |
| 07011 / Clifton / NJ / 5.2 mi. | 3,831 | 13,061 | 29.3 | $43,850 | 45.7 | 31.9 | 3.7 | 0.1 | 4.5 | |
| 07675 / Westwood / NJ / 7.9 mi. | 3,705 | 14,581 | 25.4 | $82,723 | 13.2 | 3.8 | 2.1 | 0.0 | 6.5 | |
| 07424 / Little Falls / NJ / 8.3 mi. | 3,589 | 9,084 | 39.5 | $59,611 | 15.7 | 7.7 | 1.8 | 0.1 | 4.0 | |
| 07666 / Teaneck / NJ / 1.9 mi. | 3,476 | 13,418 | 25.9 | $74,903 | 48.5 | 10.5 | 27.8 | 0.1 | 7.1 | |
| 07430 / Mahwah / NJ / 15.2 mi. | 3,129 | 9,340 | 33.5 | $79,500 | 14.6 | 4.3 | 2.1 | 0.6 | 6.3 | |
| 07013 / Clifton / NJ / 6.7 mi. | 2,929 | 9,826 | 29.8 | $60,118 | 18.5 | 8.5 | 1.0 | 0.1 | 7.2 | |
| 07450 / Ridgewood / NJ / 7.3 mi. | 2,857 | 8,603 | 33.2 | $104,286 | 15.1 | 3.8 | 1.6 | 0.0 | 8.6 | |
| 07508 / Haledon / NJ / 8.5 mi. | 2,691 | 7,270 | 37.0 | $52,695 | 31.9 | 20.0 | 6.0 | 0.1 | 2.9 | |
| 07506 / Hawthorne / NJ / 7.5 mi. | 2,664 | 7,258 | 36.7 | $55,340 | 11.4 | 7.4 | 0.7 | 0.1 | 1.9 | |
| 07621 / Bergenfield / NJ / 3.5 mi. | 2,643 | 8,991 | 29.4 | $62,166 | 46.0 | 17.0 | 6.3 | 0.2 | 20.3 | |
| 07012 / Clifton / NJ / 6.6 mi. | 2,603 | 5,461 | 47.7 | $49,873 | 21.0 | 7.8 | 2.4 | 0.0 | 9.1 | |
| 07503 / Paterson / NJ / 5.7 mi. | 2,578 | 5,893 | 43.7 | $32,668 | 73.8 | 55.2 | 7.4 | 0.1 | 2.4 | |
| 07644 / Lodi / NJ / 2 mi. | 2,559 | 9,528 | 26.9 | $43,421 | 32.1 | 18.0 | 3.2 | 0.1 | 8.8 | |
| 07481 / Wyckoff / NJ / 9.8 mi. | 2,512 | 5,541 | 45.3 | $103,614 | 7.2 | 2.3 | 0.4 | 0.1 | 3.7 | |
| 07026 / Garfield / NJ / 3.3 mi. | 2,469 | 11,278 | 21.9 | $42,770 | 27.6 | 20.1 | 2.6 | 0.1 | 2.7 | |
| 07522 / Paterson / NJ / 7.3 mi. | 2,440 | 6,402 | 38.1 | $31,728 | 90.9 | 45.7 | 39.7 | 0.1 | 3.2 | |
| 07407 / Elmwood Park / NJ / 4 mi. | 2,408 | 7,089 | 34.0 | $52,319 | 25.3 | 13.4 | 2.0 | 0.1 | 7.8 | |
| 07024 / Fort Lee / NJ / 4.7 mi. | 2,393 | 16,544 | 14.5 | $58,161 | 42.6 | 7.9 | 1.6 | 0.1 | 31.4 | |
| 07446 / Ramsey / NJ / 12.8 mi. | 2,311 | 5,324 | 43.4 | $88,318 | 10.5 | 2.9 | 0.8 | 0.1 | 5.8 | |
| 07663 / Saddle Brook / NJ / 2.7 mi. | 2,293 | 5,062 | 45.3 | $63,545 | 13.3 | 6.3 | 1.2 | 0.0 | 4.6 | |
| 07514 / Paterson / NJ / 5.7 mi. | 2,262 | 6,126 | 36.9 | $35,115 | 89.3 | 34.2 | 51.2 | 0.3 | 0.7 | |
| 07628 / Dumont / NJ / 4.8 mi. | 2,203 | 6,360 | 34.6 | $65,497 | 21.8 | 8.4 | 1.3 | 0.1 | 11.0 | |
| 07631 / Englewood / NJ / 3.8 mi. | 2,131 | 9,273 | 23.0 | $58,379 | 68.0 | 21.8 | 37.7 | 0.1 | 5.2 | |
| 07646 / New Milford / NJ / 3.4 mi. | 2,080 | 6,346 | 32.8 | $59,118 | 26.8 | 8.1 | 2.4 | 0.1 | 14.7 | |
| 07436 / Oakland / NJ / 14.1 mi. | 1,989 | 4,255 | 46.7 | $86,629 | 8.2 | 3.9 | 0.8 | 0.0 | 2.7 | |
| 07070 / Rutherford / NJ / 5.5 mi. | 1,955 | 7,055 | 27.7 | $63,820 | 24.4 | 8.6 | 2.6 | 0.0 | 11.4 | |
| 07073 / East Rutherford / NJ / 5.5 mi. | 1,941 | 3,644 | 53.3 | $50,163 | 26.5 | 10.7 | 3.4 | 0.0 | 10.7 | |
| 07512 / Totowa / NJ / 9.2 mi. | 1,826 | 3,539 | 51.6 | $60,408 | 10.8 | 6.4 | 1.1 | 0.0 | 2.3 | |
| 07071 / Lyndhurst / NJ / 7.2 mi. | 1,792 | 7,877 | 22.7 | $53,375 | 16.6 | 9.0 | 0.5 | 0.0 | 5.4 | |
| 07604 / Hasbrouck Heights / NJ / 2.4 mi. | 1,742 | 4,521 | 38.5 | $64,529 | 17.6 | 8.3 | 1.6 | 0.0 | 6.6 | |
| 07502 / Paterson / NJ / 8 mi. | 1,728 | 4,277 | 40.4 | $44,087 | 70.2 | 46.0 | 15.5 | 0.1 | 5.4 | |
| 07452 / Glen Rock / NJ / 6.4 mi. | 1,705 | 3,977 | 42.9 | $104,192 | 12.0 | 2.7 | 1.8 | 0.1 | 6.5 | |
| 07642 / Hillsdale / NJ / 8.2 mi. | 1,657 | 3,502 | 47.3 | $82,904 | 10.9 | 4.3 | 0.9 | 0.1 | 5.1 | |
| 07661 / River Edge / NJ / 2.6 mi. | 1,619 | 4,165 | 38.9 | $71,792 | 20.0 | 5.3 | 1.0 | 0.1 | 12.6 | |
| 07010 / Cliffside Park / NJ / 5.6 mi. | 1,466 | 10,027 | 14.6 | $46,288 | 33.7 | 18.2 | 1.6 | 0.1 | 12.0 | |
| 07463 / Waldwick / NJ / 9.5 mi. | 1,466 | 3,428 | 42.8 | $75,532 | 11.2 | 5.3 | 0.6 | 0.0 | 4.5 | |
| 07456 / Ringwood / NJ / 19.2 mi. | 1,448 | 4,108 | 35.2 | $81,636 | 9.2 | 4.3 | 1.5 | 1.3 | 1.2 | |
| 07417 / Franklin Lakes / NJ / 11.8 mi. | 1,400 | 3,322 | 42.1 | $132,373 | 10.9 | 2.7 | 0.9 | 0.1 | 6.3 | |
| 07607 / Maywood / NJ / 1.3 mi. | 1,384 | 3,710 | 37.3 | $62,113 | 23.0 | 11.7 | 2.6 | 0.1 | 7.1 | |
| 07505 / Paterson / NJ / 6.8 mi. | 1,362 | 782 | 174.2 | $24,135 | 89.3 | 46.9 | 39.8 | 0.2 | 1.1 | |
| 07480 / West Milford / NJ / 22 mi. | 1,351 | 5,558 | 24.3 | $75,691 | 6.7 | 2.9 | 1.3 | 0.3 | 1.1 | |
| 07656 / Park Ridge / NJ / 10.1 mi. | 1,316 | 3,161 | 41.6 | $86,632 | 10.7 | 5.3 | 0.8 | 0.1 | 3.9 | |
| 07432 / Midland Park / NJ / 8.8 mi. | 1,287 | 2,613 | 49.3 | $76,462 | 7.0 | 3.7 | 0.4 | 0.1 | 2.2 | |
| 07649 / Oradell / NJ / 4.6 mi. | 1,283 | 2,789 | 46.0 | $91,014 | 12.4 | 3.1 | 0.4 | 0.0 | 8.1 | |
| 07670 / Tenafly / NJ / 5.1 mi. | 1,261 | 4,774 | 26.4 | $90,931 | 26.3 | 4.7 | 0.9 | 0.1 | 19.1 | |
| 07458 / Saddle River / NJ / 11.1 mi. | 1,242 | 3,614 | 34.4 | $129,163 | 10.9 | 2.3 | 0.9 | 0.0 | 6.5 | |
| 07057 / Wallington / NJ / 4 mi. | 1,230 | 4,752 | 25.9 | $45,656 | 16.0 | 6.7 | 2.5 | 0.1 | 5.0 | |
| 07630 / Emerson / NJ / 5.9 mi. | 1,199 | 2,373 | 50.5 | $74,556 | 13.7 | 4.6 | 0.7 | 0.1 | 7.9 | |
| 07660 / Ridgefield Park / NJ / 2.8 mi. | 1,184 | 5,012 | 23.6 | $51,825 | 35.2 | 22.2 | 3.5 | 0.1 | 7.8 | |
| 07513 / Paterson / NJ / 5.5 mi. | 1,159 | 3,458 | 33.5 | $38,190 | 91.9 | 66.4 | 22.5 | 0.2 | 0.9 | |
| 07075 / Wood Ridge / NJ / 3.6 mi. | 1,143 | 3,024 | 37.8 | $60,949 | 14.2 | 7.3 | 0.8 | 0.1 | 5.0 | |
| 07442 / Pompton Lakes / NJ / 14.8 mi. | 1,138 | 3,965 | 28.7 | $65,659 | 11.3 | 5.8 | 1.6 | 0.1 | 3.0 | |
| 07504 / Paterson / NJ / 5.2 mi. | 1,131 | 3,731 | 30.3 | $45,412 | 95.3 | 32.2 | 58.1 | 0.2 | 0.8 | |
| 07645 / Montvale / NJ / 11.3 mi. | 1,120 | 2,509 | 44.6 | $93,031 | 9.6 | 3.1 | 0.4 | 0.1 | 5.3 | |
| 07643 / Little Ferry / NJ / 2.9 mi. | 1,115 | 4,366 | 25.5 | $49,958 | 39.8 | 15.2 | 4.5 | 0.1 | 17.1 | |
| 07524 / Paterson / NJ / 6.5 mi. | 1,048 | 3,748 | 28.0 | $32,558 | 91.4 | 64.0 | 24.7 | 0.1 | 0.3 | |
| 07662 / Rochelle Park / NJ / 2.1 mi. | 1,047 | 2,061 | 50.8 | $60,818 | 15.9 | 8.6 | 0.5 | 0.0 | 5.9 | |
| 07657 / Ridgefield / NJ / 4.4 mi. | 1,020 | 4,020 | 25.4 | $54,081 | 33.6 | 13.8 | 0.7 | 0.1 | 17.4 | |
| 07047 / North Bergen / NJ / 6.7 mi. | 1,013 | 21,243 | 4.8 | $40,844 | 68.3 | 57.3 | 1.6 | 0.1 | 6.4 | |
| 07624 / Closter / NJ / 7.4 mi. | 938 | 2,963 | 31.7 | $85,485 | 27.2 | 3.9 | 1.0 | 0.1 | 21.1 | |
| 07603 / Bogota / NJ / 1.3 mi. | 913 | 2,874 | 31.8 | $59,813 | 36.9 | 21.3 | 4.8 | 0.1 | 7.8 | |
| 07401 / Allendale / NJ / 10.9 mi. | 895 | 2,100 | 42.6 | $105,387 | 9.8 | 2.6 | 0.4 | 0.1 | 6.1 | |
| 07626 / Cresskill / NJ / 5.8 mi. | 878 | 2,630 | 33.4 | $84,692 | 25.1 | 4.0 | 0.9 | 0.0 | 18.6 | |
| 07405 / Butler / NJ / 18.8 mi. | 843 | 5,925 | 14.2 | $76,750 | 7.3 | 3.6 | 0.5 | 0.1 | 2.4 | |
| 07650 / Palisades Park / NJ / 4 mi. | 843 | 6,247 | 13.5 | $48,015 | 60.9 | 16.5 | 1.0 | 0.1 | 41.1 | |
| 07605 / Leonia / NJ / 3.5 mi. | 806 | 3,271 | 24.6 | $72,440 | 42.5 | 12.7 | 2.1 | 0.0 | 26.0 | |
| 07465 / Wanaque / NJ / 16.2 mi. | 803 | 1,892 | 42.4 | $73,048 | 9.7 | 4.2 | 1.0 | 0.0 | 3.3 | |
| 07022 / Fairview / NJ / 5.4 mi. | 724 | 4,861 | 14.9 | $40,393 | 48.2 | 37.1 | 1.2 | 0.2 | 5.0 | |
| 07072 / Carlstadt / NJ / 4.5 mi. | 724 | 2,393 | 30.3 | $55,058 | 16.0 | 8.0 | 1.1 | 0.1 | 6.2 | |
| 07094 / Secaucus / NJ / 7.6 mi. | 679 | 6,214 | 10.9 | $59,800 | 29.9 | 12.3 | 4.1 | 0.1 | 11.8 | |
| 07031 / North Arlington / NJ / 8.2 mi. | 668 | 6,392 | 10.5 | $51,787 | 18.1 | 10.6 | 0.4 | 0.1 | 5.6 | |
| 07647 / Northvale / NJ / 9.8 mi. | 668 | 1,649 | 40.5 | $74,423 | 19.8 | 4.7 | 0.9 | 0.0 | 13.2 | |
| 07444 / Pompton Plains / NJ / 14.7 mi. | 623 | 3,378 | 18.4 | $76,854 | 5.5 | 2.6 | 0.3 | 0.1 | 1.9 | |
| 07648 / Norwood / NJ / 8.8 mi. | 610 | 1,859 | 32.8 | $92,754 | 24.2 | 3.0 | 0.8 | 0.0 | 19.0 | |
| 07640 / Harrington Park / NJ / 8 mi. | 583 | 1,563 | 37.3 | $100,302 | 18.4 | 2.6 | 0.6 | 0.0 | 14.6 | |
| 07423 / Ho Ho Kus / NJ / 8.1 mi. | 577 | 1,433 | 40.3 | $129,900 | 9.0 | 2.0 | 0.5 | 0.1 | 5.4 | |
| 07403 / Bloomingdale / NJ / 17.5 mi. | 558 | 2,834 | 19.7 | $68,462 | 7.9 | 4.4 | 0.3 | 0.1 | 2.2 | |
| 07627 / Demarest / NJ / 6.5 mi. | 549 | 1,601 | 34.3 | $103,286 | 25.4 | 3.5 | 0.5 | 0.0 | 20.2 | |
| 07306 / Jersey City / NJ / 10.7 mi. | 519 | 20,304 | 2.6 | $34,808 | 74.6 | 29.0 | 14.7 | 0.3 | 23.4 | |
| 07632 / Englewood Cliffs / NJ / 5 mi. | 511 | 1,818 | 28.1 | $106,478 | 37.2 | 4.9 | 1.4 | 0.0 | 29.7 | |
| 07421 / Hewitt / NJ / 25.7 mi. | 502 | 2,675 | 18.8 | $67,229 | 9.0 | 4.3 | 1.1 | 1.0 | 0.9 | |
| 07093 / West New York / NJ / 7.2 mi. | 491 | 21,205 | 2.3 | $34,745 | 81.3 | 74.1 | 1.7 | 0.1 | 3.7 | |
| 07420 / Haskell / NJ / 16.5 mi. | 484 | 1,549 | 31.2 | $60,428 | 14.5 | 6.6 | 1.1 | 0.6 | 4.0 | |
| 07014 / Clifton / NJ / 6.1 mi. | 475 | 1,756 | 27.1 | $58,359 | 30.1 | 16.2 | 2.2 | 0.1 | 10.0 | |
| 07102 / Newark / NJ / 12.6 mi. | 472 | 4,607 | 10.2 | $13,421 | 91.3 | 22.8 | 63.7 | 0.4 | 2.0 | |
| 07020 / Edgewater / NJ / 5.8 mi. | 440 | 3,836 | 11.5 | $63,455 | 39.3 | 10.5 | 3.2 | 0.1 | 23.0 | |
| 07035 / Lincoln Park / NJ / 13.6 mi. | 440 | 4,029 | 10.9 | $68,988 | 14.0 | 5.8 | 1.6 | 0.1 | 5.3 | |
| 07440 / Pequannock / NJ / 13.5 mi. | 434 | 1,648 | 26.3 | $65,856 | 6.1 | 3.6 | 0.3 | 0.0 | 1.9 | |
| 07641 / Haworth / NJ / 5.7 mi. | 406 | 1,134 | 35.8 | $101,836 | 14.2 | 2.7 | 1.2 | 0.0 | 9.2 | |
| 07087 / Union City / NJ / 8.3 mi. | 392 | 28,847 | 1.4 | $33,132 | 80.6 | 75.3 | 1.5 | 0.1 | 2.4 | |
| 07074 / Moonachie / NJ / 3.2 mi. | 372 | 1,041 | 35.7 | $50,571 | 22.2 | 12.7 | 0.8 | 0.1 | 6.4 | |
| 10001 / New York / NY / 10 mi. | 260 | 8,941 | 2.9 | $40,932 | 47.1 | 20.1 | 8.3 | 0.2 | 15.3 | |
| 07606 / South Hackensack / NJ / 1.7 mi. | 251 | 783 | 32.1 | $59,167 | 24.6 | 15.2 | 2.2 | 0.2 | 5.9 | |
| 07003 / Bloomfield / NJ / 9.2 mi. | 243 | 18,998 | 1.3 | $53,225 | 37.1 | 14.5 | 11.2 | 0.1 | 8.4 | |
| 07030 / Hoboken / NJ / 10 mi. | 232 | 19,418 | 1.2 | $62,550 | 29.5 | 20.2 | 3.4 | 0.1 | 4.3 | |
| 07438 / Oak Ridge / NJ / 26.4 mi. | 211 | 4,162 | 5.1 | $75,813 | 5.8 | 2.9 | 0.6 | 0.2 | 1.2 | |
| 07110 / Nutley / NJ / 7.5 mi. | 210 | 10,884 | 1.9 | $59,634 | 16.7 | 6.7 | 1.8 | 0.0 | 7.1 | |
| 07457 / Riverdale / NJ / 15.6 mi. | 210 | 919 | 22.9 | $71,083 | 9.3 | 4.4 | 1.1 | 0.0 | 2.7 | |
| 08753 / Toms River / NJ / 63 mi. | 208 | 22,983 | 0.9 | $56,526 | 9.2 | 4.8 | 1.4 | 0.1 | 2.1 | |
| 07032 / Kearny / NJ / 10 mi. | 148 | 13,550 | 1.1 | $47,757 | 39.7 | 27.4 | 3.6 | 0.1 | 5.5 | |
| 07002 / Bayonne / NJ / 15.9 mi. | 146 | 25,545 | 0.6 | $41,566 | 30.1 | 17.8 | 5.0 | 0.1 | 4.1 | |
| 07620 / Alpine / NJ / 8.2 mi. | 126 | 532 | 23.7 | $128,287 | 26.2 | 2.9 | 1.4 | 0.1 | 20.4 | |
| 07004 / Fairfield / NJ / 13.5 mi. | 121 | 2,296 | 5.3 | $83,120 | 7.4 | 3.5 | 0.5 | 0.1 | 2.8 | |
| 07054 / Parsippany / NJ / 18.6 mi. | 116 | 10,823 | 1.1 | $62,106 | 35.3 | 8.2 | 3.0 | 0.1 | 21.8 | |
| 07109 / Belleville / NJ / 8.9 mi. | 100 | 13,718 | 0.7 | $48,608 | 42.5 | 23.7 | 4.8 | 0.1 | 11.3 | |
| 07307 / Jersey City / NJ / 9.5 mi. | 96 | 16,146 | 0.6 | $38,720 | 68.6 | 45.2 | 4.7 | 0.2 | 14.0 | |
| 07042 / Montclair / NJ / 10.4 mi. | 93 | 10,637 | 0.9 | $60,962 | 55.0 | 5.7 | 42.5 | 0.2 | 2.9 | |
| 07058 / Pine Brook / NJ / 15.5 mi. | 88 | 1,883 | 4.7 | $90,286 | 27.0 | 2.8 | 1.6 | 0.0 | 21.0 | |
| 10901 / Suffern / NY / 18.3 mi. | 86 | 8,089 | 1.1 | $71,051 | 15.4 | 8.5 | 2.9 | 0.2 | 2.8 | |
| 10954 / Nanuet / NY / 14.6 mi. | 84 | 8,193 | 1.0 | $72,476 | 30.9 | 7.9 | 11.9 | 0.1 | 9.1 | |
| 08005 / Barnegat / NJ / 77.8 mi. | 78 | 6,060 | 1.3 | $49,292 | 7.8 | 3.8 | 2.0 | 0.1 | 1.0 | |
| 08723 / Brick / NJ / 58.8 mi. | 78 | 12,470 | 0.6 | $50,069 | 7.7 | 4.7 | 0.9 | 0.1 | 1.2 | |
| 10965 / Pearl River / NY / 12 mi. | 78 | 5,293 | 1.5 | $72,736 | 7.4 | 3.5 | 0.4 | 0.0 | 2.9 | |
| 08050 / Manahawkin / NJ / 82.2 mi. | 76 | 7,847 | 1.0 | $51,726 | 5.0 | 2.5 | 0.7 | 0.1 | 1.0 | |
| 07719 / Belmar / NJ / 49.8 mi. | 62 | 8,915 | 0.7 | $57,113 | 8.1 | 3.8 | 1.9 | 0.1 | 1.3 | |
| 08008 / Beach Haven / NJ / 87.8 mi. | 62 | 3,787 | 1.6 | $45,974 | 4.4 | 3.2 | 0.2 | 0.1 | 0.6 | |
| 07608 / Teterboro / NJ / 2.2 mi. | 60 | 7 | 857.1 | $44,167 | 16.7 | 0.0 | 0.0 | 0.0 | 0.0 | |
| 07114 / Newark / NJ / 14.5 mi. | 58 | 3,360 | 1.7 | $14,457 | 91.6 | 37.6 | 51.0 | 0.3 | 0.5 | |
| 07029 / Harrison / NJ / 11.4 mi. | 56 | 5,892 | 1.0 | $41,864 | 53.5 | 38.4 | 0.6 | 0.1 | 10.5 | |
| 10977 / Spring Valley / NY / 15.9 mi. | 55 | 13,662 | 0.4 | $53,473 | 54.5 | 11.4 | 32.4 | 0.2 | 6.9 | |
| 10990 / Warwick / NY / 30.9 mi. | 54 | 6,540 | 0.8 | $67,194 | 14.4 | 6.7 | 5.4 | 0.2 | 0.9 | |
| 07009 / Cedar Grove / NJ / 9.8 mi. | 53 | 4,403 | 1.2 | $78,863 | 12.4 | 3.2 | 3.0 | 0.0 | 5.4 | |
| 07834 / Denville / NJ / 22.9 mi. | 51 | 6,477 | 0.8 | $78,074 | 10.1 | 2.7 | 1.2 | 0.1 | 5.2 | |
| 10956 / New City / NY / 18.6 mi. | 49 | 9,883 | 0.5 | $94,838 | 18.2 | 5.9 | 4.4 | 0.1 | 6.8 | |
| 07435 / Newfoundland / NJ / 23 mi. | 48 | 797 | 6.0 | $79,762 | 5.9 | 3.2 | 0.5 | 0.2 | 0.7 | |
| 08087 / Tuckerton / NJ / 89.6 mi. | 47 | 7,862 | 0.6 | $45,075 | 5.6 | 3.3 | 0.7 | 0.2 | 0.6 | |
| 07006 / Caldwell / NJ / 12.6 mi. | 46 | 9,371 | 0.5 | $82,196 | 13.2 | 3.2 | 5.0 | 0.0 | 4.2 | |
| 07052 / West Orange / NJ / 13.2 mi. | 46 | 16,572 | 0.3 | $69,115 | 37.9 | 10.0 | 17.1 | 0.1 | 8.1 | |
| 08759 / Manchester Township / NJ / 69.4 mi. | 45 | 10,644 | 0.4 | $23,914 | 2.9 | 1.3 | 0.8 | 0.1 | 0.4 | |
| 07302 / Jersey City / NJ / 11.6 mi. | 44 | 14,172 | 0.3 | $45,223 | 65.2 | 29.4 | 16.8 | 0.2 | 15.1 | |
| 08608 / Trenton / NJ / 59.7 mi. | 44 | 434 | 10.1 | $17,083 | 85.5 | 32.9 | 50.1 | 0.3 | 0.6 | |
| 07461 / Sussex / NJ / 38 mi. | 43 | 6,121 | 0.7 | $59,458 | 5.3 | 2.9 | 0.7 | 0.1 | 0.8 | |
| 07416 / Franklin / NJ / 32.9 mi. | 42 | 2,111 | 2.0 | $46,885 | 7.8 | 4.3 | 0.6 | 0.3 | 1.5 | |
| 08625 / Trenton / NJ / 60.2 mi. | 42 | 1 | 4200.0 | $0 | 79.0 | 15.0 | 62.8 | 0.3 | 0.6 | |
| 08757 / Toms River / NJ / 65.4 mi. | 42 | 17,215 | 0.2 | $30,177 | 8.6 | 3.0 | 4.0 | 0.1 | 0.7 | |
| 07460 / Stockholm / NJ / 28.2 mi. | 36 | 1,251 | 2.9 | $69,459 | 4.8 | 2.6 | 0.4 | 0.1 | 0.8 | |
| 07039 / Livingston / NJ / 16.4 mi. | 35 | 9,220 | 0.4 | $99,494 | 19.0 | 2.5 | 1.1 | 0.0 | 14.5 | |
| 07043 / Montclair / NJ / 8.7 mi. | 34 | 4,280 | 0.8 | $115,498 | 15.5 | 3.9 | 5.6 | 0.0 | 3.8 | |
| 07305 / Jersey City / NJ / 13.5 mi. | 34 | 20,185 | 0.2 | $38,169 | 83.3 | 17.4 | 50.1 | 0.2 | 11.9 | |
| 07462 / Vernon / NJ / 31.2 mi. | 34 | 2,565 | 1.3 | $59,187 | 7.2 | 4.7 | 0.8 | 0.1 | 0.8 | |
| 07728 / Freehold / NJ / 47.9 mi. | 34 | 17,798 | 0.2 | $65,399 | 22.0 | 9.9 | 6.6 | 0.1 | 4.4 | |
| 07950 / Morris Plains / NJ / 23 mi. | 34 | 6,614 | 0.5 | $91,165 | 18.2 | 3.6 | 1.7 | 0.1 | 11.7 | |
| 10950 / Monroe / NY / 30 mi. | 34 | 10,501 | 0.3 | $54,651 | 9.5 | 5.5 | 1.5 | 0.3 | 1.3 | |
| 07840 / Hackettstown / NJ / 41.3 mi. | 33 | 10,227 | 0.3 | $60,862 | 11.2 | 5.5 | 1.6 | 0.1 | 2.4 | |
| 07860 / Newton / NJ / 41.2 mi. | 33 | 9,436 | 0.3 | $60,904 | 6.1 | 2.5 | 1.5 | 0.1 | 1.2 | |
| 08734 / Lanoka Harbor / NJ / 71.2 mi. | 33 | 2,492 | 1.3 | $66,928 | 3.5 | 2.0 | 0.2 | 0.1 | 0.6 | |
| 18428 / Hawley / PA / 73.5 mi. | 33 | 3,972 | 0.8 | $37,775 | 7.1 | 3.0 | 2.3 | 0.1 | 0.5 | |
| 07079 / South Orange / NJ / 14.8 mi. | 32 | 5,566 | 0.6 | $82,865 | 42.0 | 4.9 | 30.6 | 0.1 | 3.9 | |
| 07866 / Rockaway / NJ / 23.5 mi. | 32 | 8,054 | 0.4 | $75,453 | 14.7 | 6.1 | 1.7 | 0.1 | 5.9 | |
| 10018 / New York / NY / 9.6 mi. | 32 | 2,061 | 1.6 | $48,705 | 55.5 | 23.2 | 6.5 | 0.3 | 22.0 | |
| 10983 / Tappan / NY / 10.9 mi. | 32 | 2,030 | 1.6 | $78,157 | 18.4 | 6.3 | 0.9 | 0.1 | 9.4 | |
| 07419 / Hamburg / NJ / 33.4 mi. | 30 | 2,718 | 1.1 | $60,396 | 8.4 | 3.8 | 1.0 | 0.3 | 2.0 | |
| 07105 / Newark / NJ / 12.5 mi. | 29 | 15,365 | 0.2 | $35,044 | 47.7 | 35.2 | 5.1 | 0.1 | 0.4 | |
| 07871 / Sparta / NJ / 32.2 mi. | 29 | 6,623 | 0.4 | $89,313 | 5.3 | 2.5 | 0.3 | 0.1 | 1.5 | |
| 08701 / Lakewood / NJ / 56.7 mi. | 29 | 19,889 | 0.1 | $35,647 | 29.1 | 14.8 | 11.4 | 0.1 | 1.3 | |
| 08721 / Bayville / NJ / 68.1 mi. | 28 | 6,150 | 0.5 | $52,778 | 6.9 | 3.9 | 1.2 | 0.1 | 0.8 | |
| 18301 / East Stroudsburg / PA / 58.8 mi. | 28 | 12,221 | 0.2 | $47,638 | 18.7 | 7.9 | 7.2 | 0.2 | 1.4 | |
| 07044 / Verona / NJ / 11 mi. | 27 | 5,794 | 0.5 | $74,284 | 9.5 | 3.4 | 1.6 | 0.0 | 3.4 | |
| 07083 / Union / NJ / 17.8 mi. | 27 | 18,124 | 0.1 | $60,487 | 34.5 | 9.3 | 15.2 | 0.1 | 8.1 | |
| 07936 / East Hanover / NJ / 17.3 mi. | 27 | 3,843 | 0.7 | $82,133 | 15.1 | 2.7 | 0.6 | 0.0 | 11.0 | |
| 10952 / Monsey / NY / 15.4 mi. | 27 | 7,817 | 0.3 | $53,191 | 11.5 | 4.0 | 4.4 | 0.1 | 2.0 | |
| 07731 / Howell / NJ / 52 mi. | 26 | 11,865 | 0.2 | $71,153 | 14.2 | 5.7 | 3.6 | 0.1 | 3.6 | |
| 10960 / Nyack / NY / 15.5 mi. | 25 | 6,027 | 0.4 | $60,766 | 35.7 | 7.6 | 20.7 | 0.1 | 3.7 | |
| 10913 / Blauvelt / NY / 13.3 mi. | 24 | 1,518 | 1.6 | $87,866 | 15.1 | 5.7 | 1.5 | 0.0 | 7.0 | |
| 18360 / Stroudsburg / PA / 65.6 mi. | 24 | 10,019 | 0.2 | $46,039 | 11.5 | 4.7 | 4.0 | 0.2 | 1.4 | |
| 10974 / Sloatsburg / NY / 20 mi. | 23 | 1,069 | 2.2 | $71,106 | 12.5 | 5.5 | 2.9 | 0.4 | 2.5 | |
| 07304 / Jersey City / NJ / 12.1 mi. | 22 | 14,588 | 0.2 | $31,685 | 87.7 | 25.8 | 44.4 | 0.3 | 12.2 | |
| 10970 / Pomona / NY / 21.3 mi. | 22 | 3,617 | 0.6 | $62,025 | 27.7 | 11.0 | 8.5 | 0.2 | 5.8 | |
| 18337 / Milford / PA / 54.2 mi. | 22 | 4,162 | 0.5 | $51,525 | 8.6 | 4.6 | 1.9 | 0.2 | 0.6 | |
| 07005 / Boonton / NJ / 19.7 mi. | 21 | 5,537 | 0.4 | $75,762 | 16.1 | 4.8 | 2.6 | 0.1 | 6.6 | |
| 07034 / Lake Hiawatha / NJ / 17.6 mi. | 21 | 3,719 | 0.6 | $60,187 | 26.1 | 7.3 | 2.7 | 0.1 | 12.8 | |
| 07762 / Spring Lake / NJ / 50.9 mi. | 21 | 4,206 | 0.5 | $59,883 | 3.2 | 1.6 | 0.8 | 0.0 | 0.3 | |
| 07826 / Branchville / NJ / 42.4 mi. | 21 | 2,130 | 1.0 | $59,875 | 3.0 | 1.7 | 0.3 | 0.1 | 0.5 | |
| 07980 / Stirling / NJ / 27.7 mi. | 21 | 897 | 2.3 | $71,250 | 10.4 | 4.7 | 0.2 | 0.1 | 4.2 | |
| 08527 / Jackson / NJ / 56.5 mi. | 21 | 14,071 | 0.1 | $65,198 | 12.8 | 5.8 | 3.6 | 0.1 | 2.0 | |
| 08733 / Lakehurst / NJ / 62.6 mi. | 21 | 7,891 | 0.3 | $36,147 | 11.3 | 3.6 | 5.5 | 0.2 | 1.1 | |
| 10923 / Garnerville / NY / 21.7 mi. | 21 | 2,981 | 0.7 | $57,276 | 39.0 | 22.4 | 9.8 | 0.2 | 4.4 | |
| 10994 / West Nyack / NY / 14.8 mi. | 21 | 2,109 | 1.0 | $106,416 | 16.6 | 5.2 | 1.9 | 0.1 | 7.9 | |
| 12550 / Newburgh / NY / 44.9 mi. | 21 | 17,672 | 0.1 | $42,277 | 48.6 | 24.2 | 20.6 | 0.2 | 1.4 | |
| 07701 / Red Bank / NJ / 36.5 mi. | 20 | 9,634 | 0.2 | $59,851 | 23.7 | 10.0 | 10.4 | 0.0 | 2.1 | |
| 18425 / Greeley / PA / 63.8 mi. | 20 | 527 | 3.8 | $31,758 | 5.8 | 2.8 | 1.1 | 0.2 | 0.7 | |
| 07045 / Montville / NJ / 16.9 mi. | 19 | 3,778 | 0.5 | $100,213 | 14.9 | 2.6 | 0.8 | 0.1 | 10.7 | |
| 07849 / Lake Hopatcong / NJ / 30.6 mi. | 19 | 2,660 | 0.7 | $63,785 | 7.4 | 4.4 | 0.8 | 0.1 | 0.8 | |
| 10925 / Greenwood Lake / NY / 24.8 mi. | 19 | 1,995 | 1.0 | $51,657 | 9.0 | 5.5 | 0.8 | 0.2 | 1.0 | |
| 10989 / Valley Cottage / NY / 17.2 mi. | 18 | 3,390 | 0.5 | $76,578 | 20.3 | 6.3 | 3.1 | 0.1 | 9.0 | |
| 07724 / Eatontown / NJ / 40.8 mi. | 17 | 9,266 | 0.2 | $58,265 | 29.3 | 5.8 | 13.2 | 0.2 | 7.6 | |
| 07428 / Mc Afee / NJ / 33.2 mi. | 16 | 55 | 29.1 | $56,500 | 6.3 | 4.7 | 0.0 | 0.0 | 0.0 | |
| 07836 / Flanders / NJ / 34.8 mi. | 16 | 4,386 | 0.4 | $76,040 | 14.8 | 4.1 | 3.5 | 0.2 | 5.8 | |
| 07422 / Highland Lakes / NJ / 28.7 mi. | 15 | 2,436 | 0.6 | $67,222 | 5.7 | 3.7 | 0.7 | 0.1 | 0.4 | |
| 10920 / Congers / NY / 19.2 mi. | 14 | 2,931 | 0.5 | $78,958 | 20.9 | 8.0 | 2.0 | 0.1 | 9.8 | |
| 07928 / Chatham / NJ / 22.3 mi. | 13 | 6,967 | 0.2 | $104,936 | 7.3 | 2.3 | 0.3 | 0.1 | 4.0 | |
| 10980 / Stony Point / NY / 24.2 mi. | 13 | 4,317 | 0.3 | $71,451 | 10.5 | 6.8 | 1.2 | 0.1 | 1.3 | |
| 10940 / Middletown / NY / 44.3 mi. | 10 | 15,471 | 0.1 | $44,550 | 34.6 | 19.7 | 10.5 | 0.3 | 1.7 | |
| 18344 / Mount Pocono / PA / 72.3 mi. | 10 | 1,204 | 0.8 | $41,947 | 21.6 | 9.4 | 9.3 | 0.1 | 1.0 | |
| 10917 / Central Valley / NY / 30.4 mi. | 9 | 596 | 1.5 | $68,472 | 10.7 | 7.7 | 0.8 | 0.1 | 1.7 | |
| 10918 / Chester / NY / 33.7 mi. | 9 | 3,727 | 0.2 | $71,016 | 19.7 | 9.7 | 6.4 | 0.3 | 2.4 | |
| 18426 / Greentown / PA / 70.3 mi. | 8 | 1,663 | 0.5 | $36,865 | 4.6 | 2.7 | 0.5 | 0.2 | 0.4 | |
| 10992 / Washingtonville / NY / 37.3 mi. | 7 | 3,061 | 0.2 | $68,329 | 16.9 | 9.6 | 4.3 | 0.3 | 1.3 | |
| 18336 / Matamoras / PA / 49.4 mi. | 7 | 1,547 | 0.5 | $40,348 | 5.8 | 2.7 | 0.4 | 0.3 | 1.2 | |
| 18372 / Tannersville / PA / 67.1 mi. | 7 | 1,021 | 0.7 | $46,891 | 12.5 | 6.2 | 3.6 | 0.2 | 1.1 | |
| 08520 / Hightstown / NJ / 50.4 mi. | 5 | 9,299 | 0.1 | $67,655 | 29.7 | 12.7 | 8.0 | 0.1 | 7.4 | |
| 12561 / New Paltz / NY / 59.6 mi. | 3 | 6,145 | 0.0 | $43,110 | 17.2 | 6.8 | 4.6 | 0.2 | 3.1 | |
| File | nj_the_record__hackensack | |||||||||
| Time | 5/13/05 5:23 PM | |||||||||
| Page | 62 | |||||||||
| Member | 127450 | |||||||||