
|
| Comparing the racial diversity of the journalists | ||||||||||
| at America's daily newspapers | ||||||||||
| with the communities that they serve | ||||||||||
| Newsroom diversity report for | ||||||||||
| Portsmouth Herald | ||||||||||
| Portsmouth, New Hampshire | ||||||||||
| Owner: Dow Jones (N.Y.) | ||||||||||
| From a report for the Knight Foundation | ||||||||||
| by Bill Dedman and Stephen K. Doig, June 2005 | ||||||||||
| Click here to read the national report or to select another newspaper | ||||||||||
| Year | Non-white % of newsroom staff | |||||||||
| 2005 | Did not report | |||||||||
| 2004 | Did not report | |||||||||
| 2003 | 0.0 | |||||||||
| 2002 | 0.0 | |||||||||
| 2001 | 0.0 | |||||||||
| 2000 | 0.0 | |||||||||
| 1999 | 0.0 | |||||||||
| 1998 | 0.0 | |||||||||
| 1997 | 0.0 | |||||||||
| 1996 | 0.0 | |||||||||
| 1995 | 0.0 | |||||||||
| 1994 | 0.0 | |||||||||
| 1993 | 0.0 | |||||||||
| 1992 | 0.0 | |||||||||
| 1991 | 0.0 | |||||||||
| 1990 | Did not report | |||||||||
| The latest year at peak is | 2003 | |||||||||
| See the notes and definitions section below for the sources of these figures. | ||||||||||
| Newsroom Diversity Index | ||||||||||
| for Portsmouth Herald | ||||||||||
| Year | Non-white % of newsroom staff | Non-white % of circulation area | Newsroom Diversity Index (parity=100) | |||||||
| 2005 | N/A | 3.9 | N/A | |||||||
| 2004 | N/A | 3.9 | N/A | |||||||
| How the index is calculated | ||||||||||
| The Newsroom Diversity Index is the non-white percentage of the newsroom staff | ||||||||||
| divided by the non-white percentage of residents in the circulation area. | ||||||||||
| (Parity = 100.) | ||||||||||
| Company index | ||||||||||
| This newspaper's owner, Dow Jones (N.Y.), | ||||||||||
| has a companywide, circulation-weighted Diversity Index of 53. | ||||||||||
| See the notes and definitions section below for the sources of these figures. | ||||||||||
| Peer group comparison | ||||||||||
| for Portsmouth Herald | ||||||||||
| This paper | ||||||||||
| Peer group | ||||||||||
| The median Diversity Index is 33 for all newspapers | ||||||||||
| reporting in this circulation category of 10,001 to 25,000 daily sales. | ||||||||||
| An example of a newspaper of similar circulation, in an area of similar level of non-white residents, but one that has a relatively high Diversity Index, is Clinton Herald, Iowa, with a 10 percent non-white staff in a community that is 4.4 percent non-white. Its index is 226. | ||||||||||
| FYI, in circulation, this newspaper's average weekday circulation of | ||||||||||
| approximately 14,380 ranks 629 out of 1,410 daily newspapers in the US. | ||||||||||
| See the notes and definitions section below for the sources of these figures. | ||||||||||
| Details on race/ethnicity | ||||||||||
| in the circulation area | ||||||||||
| and the home county | ||||||||||
| of Portsmouth Herald | ||||||||||
| Circulation area | ||||||||||
| Race/ethnicity | % of population | Number of residents | 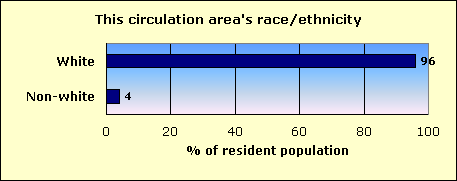
|
|||||||
| Hispanic | 1.0 | 841 | ||||||||
| Black | 0.8 | 728 | ||||||||
| Asian and Pacific Islander | 1.1 | 973 | ||||||||
| Native-American | 0.1 | 112 | ||||||||
| Other non-white | 0.1 | 45 | ||||||||
| Multi-racial | 0.8 | 669 | ||||||||
| Non-white | 3.9 | 3,368 | ||||||||
| White | 96.1 | 83,269 | ||||||||
| Total | 86,637 | |||||||||
| Home county: Rockingham | ||||||||||
| Race/ethnicity | % of population | Number of residents | 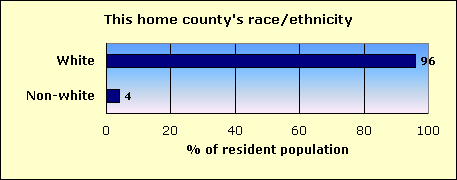
|
|||||||
| Hispanic | 1.2 | 3,314 | ||||||||
| Black | 0.5 | 1,497 | ||||||||
| Asian and Pacific Islander | 1.1 | 3,159 | ||||||||
| Native-American | 0.2 | 445 | ||||||||
| Other non-white | 0.1 | 240 | ||||||||
| Multi-racial | 0.8 | 2,280 | ||||||||
| Non-white | 3.9 | 10,935 | ||||||||
| White | 96.1 | 266,424 | ||||||||
| Total | 277,359 | |||||||||
| The home county of this newspaper is Rockingham. | ||||||||||
| About this report | ||||||||||
| This third annual report for the Knight Foundation adds context to an annual survey by the American Society of Newspaper Editors. ASNE has set a goal that | ||||||||||
| every newspaper, to help it know its community and gather the news, should employ at least one non-white journalist, and that newspapers should strive to | ||||||||||
| employ non-whites in proportion to their share of the community. ASNE's report, at www.asne.org, shows each newspaper's non-white employment, but does | ||||||||||
| not disclose how closely that employment mirrors the newspaper's circulation area. | ||||||||||
| That gap is filled by the report you are reading now. This report was not done by ASNE, but was done for the Knight Foundation by Bill Dedman and | ||||||||||
| Stephen K. Doig. It shows how close each newspaper is to ASNE's goal, by comparing the newsroom staffing with the circulation area population. | ||||||||||
| The full report is at www.powerreporting.com/knight. | ||||||||||
| Notes and definitions | ||||||||||
| 1. The Newsroom Diversity Index is the non-white percentage of the newsroom staff divided by the non-white percentage of the circulation area's residents. Parity = 100. | ||||||||||
| 2. Source for staffing: Survey by American Society of Newspaper Editors, April 2005. Newspapers report non-white staff as of the end of the previous year. | ||||||||||
| 3. Following ASNE's definition, newsroom staff includes only supervisors, reporters, editors, copy/layout editors and photographers. | ||||||||||
| 4. Also following ASNE's definition, "whites," "blacks," etc., exclude Hispanics, who are counted in a separate category. | ||||||||||
| 5. Source for boundaries of this newspaper's circulation area: ZIP Code circulation data, Audit Bureau of Circulations, latest available. | ||||||||||
| 6. A paper may define its circulation area differently for marketing efforts, or news coverage, or to set advertising rates. | ||||||||||
| 7. If ZIP Codes or counties are used, this report applies a threshold: 10 percent household penetration is required to include an area in the circulation area. | ||||||||||
| 8. Source for the demographics of residents of that circulation area: US Census 2000. | ||||||||||
| 9. Source for total circulation: Editor & Publisher magazine, Monday-Friday average at year-end 2004. | ||||||||||
| 10. Staff of non-English publications, such as the Miami Herald's El Nuevo Herald, are excluded from the ASNE staffing survey for the first time this year. | ||||||||||
| Demographics of ZIP Codes | ||||||||||
| where sales were reported by | ||||||||||
| Portsmouth Herald | ||||||||||
| Note that some ZIP Codes listed here may not have been included in determining the newspaper's circulation area. In calculating the Diversity Index, a | ||||||||||
| ZIP Code was included only if the household penetration was at least 10 percent. Any lower-penetration ZIP Codes are also listed here for your information. | ||||||||||
| Also, if the newspaper reported more than 300 ZIP Codes, only the top 300 in weekday sales are listed here. | ||||||||||
| ZIP / City / State / Approx. distance in miles from the newspaper's home office | Weekday sales | Households | Penetration % (daily sales per 100 households) | Median household income | Non-white % of population |
Hispanic % of population |
Black % of population |
Native % of population |
Asian % of population |
|
| 03801 / Portsmouth / NH / 0 mi. | 5,148 | 10,168 | 50.6 | $45,591 | 7.2 | 1.4 | 2.0 | 0.2 | 2.4 | |
| 03904 / Kittery / ME / 4.7 mi. | 1,195 | 3,246 | 36.8 | $42,050 | 5.5 | 1.7 | 2.0 | 0.1 | 0.7 | |
| 03909 / York / ME / 9 mi. | 1,104 | 4,349 | 25.4 | $54,363 | 2.3 | 0.7 | 0.2 | 0.1 | 0.6 | |
| 03870 / Rye / NH / 4.4 mi. | 1,094 | 2,176 | 50.3 | $63,152 | 1.8 | 0.6 | 0.1 | 0.1 | 0.5 | |
| 03842 / Hampton / NH / 9.1 mi. | 871 | 6,411 | 13.6 | $54,419 | 3.0 | 0.9 | 0.4 | 0.2 | 0.9 | |
| 03903 / Eliot / ME / 5.7 mi. | 722 | 2,307 | 31.3 | $52,606 | 1.9 | 0.5 | 0.2 | 0.1 | 0.4 | |
| 03840 / Greenland / NH / 3.3 mi. | 665 | 1,204 | 55.2 | $62,172 | 2.8 | 0.7 | 0.3 | 0.0 | 1.3 | |
| 03885 / Stratham / NH / 6.2 mi. | 586 | 2,306 | 25.4 | $76,726 | 2.5 | 0.7 | 0.2 | 0.1 | 0.8 | |
| 03862 / North Hampton / NH / 6.4 mi. | 500 | 1,671 | 29.9 | $66,696 | 2.2 | 0.8 | 0.3 | 0.1 | 0.6 | |
| 03905 / Kittery Point / ME / 6 mi. | 450 | 832 | 54.1 | $55,288 | 2.3 | 0.6 | 0.6 | 0.1 | 0.5 | |
| 03833 / Exeter / NH / 11.3 mi. | 406 | 7,470 | 5.4 | $51,858 | 3.3 | 0.9 | 0.4 | 0.2 | 0.9 | |
| 03820 / Dover / NH / 9.8 mi. | 361 | 12,170 | 3.0 | $44,493 | 6.0 | 1.1 | 1.0 | 0.2 | 2.3 | |
| 03854 / New Castle / NH / 4.1 mi. | 236 | 444 | 53.2 | $83,708 | 2.7 | 0.5 | 0.6 | 0.0 | 0.5 | |
| 03857 / Newmarket / NH / 8.7 mi. | 192 | 3,379 | 5.7 | $46,058 | 7.0 | 1.7 | 0.6 | 0.1 | 3.0 | |
| 03874 / Seabrook / NH / 13 mi. | 187 | 3,475 | 5.4 | $42,951 | 3.1 | 0.9 | 0.3 | 0.2 | 0.5 | |
| 03824 / Durham / NH / 9.6 mi. | 170 | 4,347 | 3.9 | $54,263 | 5.9 | 1.2 | 0.6 | 0.1 | 2.8 | |
| 03878 / Somersworth / NH / 13.4 mi. | 137 | 4,682 | 2.9 | $43,177 | 4.8 | 1.6 | 0.6 | 0.2 | 0.9 | |
| 03902 / Cape Neddick / ME / 13.3 mi. | 136 | 886 | 15.3 | $62,069 | 1.9 | 0.8 | 0.5 | 0.3 | 0.2 | |
| 03867 / Rochester / NH / 21.4 mi. | 98 | 9,240 | 1.1 | $40,780 | 3.3 | 0.9 | 0.5 | 0.2 | 0.9 | |
| 03844 / Hampton Falls / NH / 10.7 mi. | 78 | 708 | 11.0 | $75,513 | 2.2 | 0.7 | 0.1 | 0.0 | 0.7 | |
| 03856 / Newfields / NH / 9.6 mi. | 49 | 516 | 9.5 | $71,375 | 2.3 | 0.5 | 0.1 | 0.0 | 0.8 | |
| 04090 / Wells / ME / 20.6 mi. | 45 | 4,003 | 1.1 | $46,229 | 2.2 | 0.6 | 0.2 | 0.2 | 0.5 | |
| 03908 / South Berwick / ME / 12 mi. | 38 | 2,407 | 1.6 | $53,294 | 2.8 | 0.7 | 0.3 | 0.3 | 0.7 | |
| 03042 / Epping / NH / 13.9 mi. | 36 | 2,047 | 1.8 | $50,739 | 3.4 | 0.8 | 0.2 | 0.2 | 0.4 | |
| 03848 / Kingston / NH / 17.2 mi. | 34 | 2,117 | 1.6 | $61,522 | 2.4 | 0.8 | 0.2 | 0.1 | 0.4 | |
| 03907 / Ogunquit / ME / 15.5 mi. | 28 | 668 | 4.2 | $47,727 | 1.8 | 0.7 | 0.4 | 0.1 | 0.5 | |
| 03077 / Raymond / NH / 19.8 mi. | 22 | 3,491 | 0.6 | $48,829 | 2.7 | 0.8 | 0.5 | 0.2 | 0.2 | |
| 03827 / East Kingston / NH / 14.3 mi. | 3 | 930 | 0.3 | $64,940 | 2.3 | 0.3 | 0.3 | 0.0 | 0.5 | |
| File | nh_portsmouth_herald | |||||||||
| Time | 5/21/05 4:58 PM | |||||||||
| Page | 628 | |||||||||
| Member | 126950 | |||||||||