
|
| Comparing the racial diversity of the journalists | ||||||||||
| at America's daily newspapers | ||||||||||
| with the communities that they serve | ||||||||||
| Newsroom diversity report for | ||||||||||
| Omaha World-Herald | ||||||||||
| Omaha, Nebraska | ||||||||||
| Owner: Omaha World-Herald | ||||||||||
| From a report for the Knight Foundation | ||||||||||
| by Bill Dedman and Stephen K. Doig, June 2005 | ||||||||||
| Click here to read the national report or to select another newspaper | ||||||||||
| Year | Non-white % of newsroom staff | 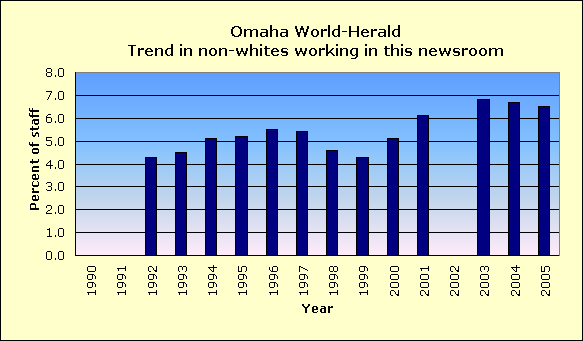
|
||||||||
| 2005 | 6.5 | |||||||||
| 2004 | 6.7 | |||||||||
| 2003 | 6.8 | |||||||||
| 2002 | Did not report | |||||||||
| 2001 | 6.1 | |||||||||
| 2000 | 5.1 | |||||||||
| 1999 | 4.3 | |||||||||
| 1998 | 4.6 | |||||||||
| 1997 | 5.4 | |||||||||
| 1996 | 5.5 | |||||||||
| 1995 | 5.2 | |||||||||
| 1994 | 5.1 | |||||||||
| 1993 | 4.5 | |||||||||
| 1992 | 4.3 | |||||||||
| 1991 | Did not report | |||||||||
| 1990 | Did not report | |||||||||
| The latest year at peak is | 2003 | |||||||||
| See the notes and definitions section below for the sources of these figures. | ||||||||||
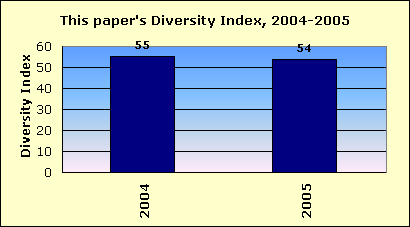
| Newsroom Diversity Index | ||||||||||
| for Omaha World-Herald | ||||||||||
 |
||||||||||
| Year | Non-white % of newsroom staff | Non-white % of circulation area | Newsroom Diversity Index (parity=100) | |||||||
| 2005 | 6.5 | 12.1 | 54 | |||||||
| 2004 | 6.7 | 12.1 | 55 | |||||||
| How the index is calculated | ||||||||||
| The Newsroom Diversity Index is the non-white percentage of the newsroom staff | ||||||||||
| divided by the non-white percentage of residents in the circulation area. | ||||||||||
| (Parity = 100.) | ||||||||||
| Company index | ||||||||||
| This newspaper's owner, Omaha World-Herald, | ||||||||||
| has a companywide, circulation-weighted Diversity Index of 61. | ||||||||||
| See the notes and definitions section below for the sources of these figures. | ||||||||||
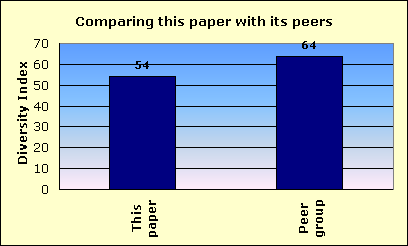
| Peer group comparison | ||||||||||
| for Omaha World-Herald | ||||||||||
 |
||||||||||
| This newspaper's Newsroom Diversity Index is 54. | This paper | |||||||||
| Peer group | ||||||||||
| Compare that with 64, which is the median Diversity Index for all newspapers | ||||||||||
| reporting in this circulation category of 100,001 to 250,000 daily sales. | ||||||||||
| In that group, this newspaper's Diversity Index ranks 37 out of 58 | ||||||||||
| newspapers reporting in the category of 100,001 to 250,000 daily sales. | ||||||||||
| An example of a newspaper of similar circulation, in an area of similar level of non-white residents, but one that has a relatively high Diversity Index, is The Akron Beacon Journal, Ohio, with a 20.8 percent non-white staff in a community that is 11.8 percent non-white. Its index is 177. | ||||||||||
| FYI, in circulation, this newspaper's average weekday circulation of | ||||||||||
| approximately 192,607 ranks 52 out of 1,410 daily newspapers in the US. | ||||||||||
| See the notes and definitions section below for the sources of these figures. | ||||||||||
| Details on race/ethnicity | ||||||||||
| in the circulation area | ||||||||||
| and the home county | ||||||||||
| of Omaha World-Herald | ||||||||||
| Circulation area | ||||||||||
| Race/ethnicity | % of population | Number of residents | 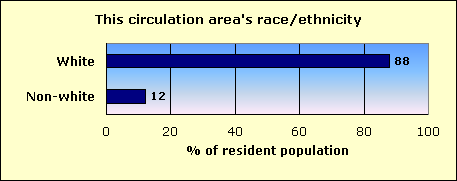
|
|||||||
| Hispanic | 5.0 | 69,508 | ||||||||
| Black | 4.5 | 61,697 | ||||||||
| Asian and Pacific Islander | 1.0 | 14,384 | ||||||||
| Native-American | 0.6 | 7,594 | ||||||||
| Other non-white | 0.1 | 966 | ||||||||
| Multi-racial | 1.0 | 13,516 | ||||||||
| Non-white | 12.1 | 167,665 | ||||||||
| White | 87.9 | 1,214,925 | ||||||||
| Total | 1,382,590 | |||||||||
| Home county: Douglas | ||||||||||
| Race/ethnicity | % of population | Number of residents | 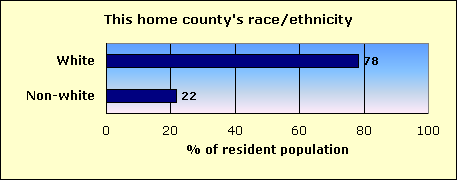
|
|||||||
| Hispanic | 6.7 | 30,928 | ||||||||
| Black | 11.4 | 52,821 | ||||||||
| Asian and Pacific Islander | 1.7 | 8,061 | ||||||||
| Native-American | 0.5 | 2,411 | ||||||||
| Other non-white | 0.1 | 512 | ||||||||
| Multi-racial | 1.4 | 6,324 | ||||||||
| Non-white | 21.8 | 101,057 | ||||||||
| White | 78.2 | 362,528 | ||||||||
| Total | 463,585 | |||||||||
| The home county of this newspaper is Douglas. | ||||||||||
| About this report | ||||||||||
| This third annual report for the Knight Foundation adds context to an annual survey by the American Society of Newspaper Editors. ASNE has set a goal that | ||||||||||
| every newspaper, to help it know its community and gather the news, should employ at least one non-white journalist, and that newspapers should strive to | ||||||||||
| employ non-whites in proportion to their share of the community. ASNE's report, at www.asne.org, shows each newspaper's non-white employment, but does | ||||||||||
| not disclose how closely that employment mirrors the newspaper's circulation area. | ||||||||||
| That gap is filled by the report you are reading now. This report was not done by ASNE, but was done for the Knight Foundation by Bill Dedman and | ||||||||||
| Stephen K. Doig. It shows how close each newspaper is to ASNE's goal, by comparing the newsroom staffing with the circulation area population. | ||||||||||
| The full report is at www.powerreporting.com/knight. | ||||||||||
| Notes and definitions | ||||||||||
| 1. The Newsroom Diversity Index is the non-white percentage of the newsroom staff divided by the non-white percentage of the circulation area's residents. Parity = 100. | ||||||||||
| 2. Source for staffing: Survey by American Society of Newspaper Editors, April 2005. Newspapers report non-white staff as of the end of the previous year. | ||||||||||
| 3. Following ASNE's definition, newsroom staff includes only supervisors, reporters, editors, copy/layout editors and photographers. | ||||||||||
| 4. Also following ASNE's definition, "whites," "blacks," etc., exclude Hispanics, who are counted in a separate category. | ||||||||||
| 5. Source for boundaries of this newspaper's circulation area: ZIP Code circulation data, Audit Bureau of Circulations, latest available. | ||||||||||
| 6. A paper may define its circulation area differently for marketing efforts, or news coverage, or to set advertising rates. | ||||||||||
| 7. If ZIP Codes or counties are used, this report applies a threshold: 10 percent household penetration is required to include an area in the circulation area. | ||||||||||
| 8. Source for the demographics of residents of that circulation area: US Census 2000. | ||||||||||
| 9. Source for total circulation: Editor & Publisher magazine, Monday-Friday average at year-end 2004. | ||||||||||
| 10. Staff of non-English publications, such as the Miami Herald's El Nuevo Herald, are excluded from the ASNE staffing survey for the first time this year. | ||||||||||
| Demographics of ZIP Codes | ||||||||||
| where sales were reported by | ||||||||||
| Omaha World-Herald | ||||||||||
| Note that some ZIP Codes listed here may not have been included in determining the newspaper's circulation area. In calculating the Diversity Index, a | ||||||||||
| ZIP Code was included only if the household penetration was at least 10 percent. Any lower-penetration ZIP Codes are also listed here for your information. | ||||||||||
| Also, if the newspaper reported more than 300 ZIP Codes, only the top 300 in weekday sales are listed here. | ||||||||||
| ZIP / City / State / Approx. distance in miles from the newspaper's home office | Weekday sales | Households | Penetration % (daily sales per 100 households) | Median household income | Non-white % of population |
Hispanic % of population |
Black % of population |
Native % of population |
Asian % of population |
|
| 68134 / Omaha / NE / 6.4 mi. | 5,884 | 12,111 | 48.6 | $43,294 | 13.7 | 2.5 | 7.3 | 0.3 | 2.2 | |
| 68144 / Omaha / NE / 9.7 mi. | 5,870 | 10,061 | 58.3 | $56,331 | 6.5 | 2.4 | 1.4 | 0.2 | 1.5 | |
| 68154 / Omaha / NE / 9.6 mi. | 5,681 | 9,851 | 57.7 | $58,373 | 7.8 | 1.8 | 2.2 | 0.2 | 2.6 | |
| 68137 / Omaha / NE / 10.3 mi. | 5,465 | 9,351 | 58.4 | $58,173 | 6.5 | 2.7 | 1.2 | 0.2 | 1.4 | |
| 68114 / Omaha / NE / 6 mi. | 5,441 | 8,256 | 65.9 | $41,851 | 9.4 | 2.0 | 3.2 | 0.3 | 2.9 | |
| 68164 / Omaha / NE / 9.2 mi. | 5,097 | 9,844 | 51.8 | $58,983 | 12.3 | 2.1 | 5.8 | 0.3 | 2.7 | |
| 68127 / Omaha / NE / 7.2 mi. | 4,531 | 9,982 | 45.4 | $45,141 | 11.8 | 5.1 | 2.3 | 0.3 | 3.0 | |
| 68104 / Omaha / NE / 4.1 mi. | 4,520 | 14,044 | 32.2 | $36,298 | 33.8 | 3.2 | 27.0 | 0.6 | 1.0 | |
| 68124 / Omaha / NE / 6.3 mi. | 4,443 | 6,471 | 68.7 | $51,417 | 6.6 | 2.0 | 1.9 | 0.2 | 1.7 | |
| 68106 / Omaha / NE / 3.8 mi. | 4,402 | 9,402 | 46.8 | $39,834 | 8.5 | 3.4 | 2.2 | 0.3 | 1.9 | |
| 68025 / Fremont / NE / 34.5 mi. | 3,954 | 11,765 | 33.6 | $38,312 | 6.2 | 4.2 | 0.5 | 0.2 | 0.6 | |
| 68005 / Bellevue / NE / 8.9 mi. | 3,819 | 9,406 | 40.6 | $44,542 | 16.6 | 5.1 | 6.2 | 0.5 | 2.5 | |
| 68046 / Papillion / NE / 11.7 mi. | 3,565 | 6,539 | 54.5 | $65,939 | 8.0 | 2.8 | 2.2 | 0.3 | 1.4 | |
| 68102 / Omaha / NE / 0 mi. | 3,544 | 2,373 | 149.3 | $20,510 | 39.6 | 8.9 | 22.1 | 1.4 | 4.7 | |
| 51503 / Council Bluffs / IA / 7.5 mi. | 3,211 | 13,048 | 24.6 | $44,101 | 4.3 | 2.3 | 0.6 | 0.2 | 0.5 | |
| 68107 / Omaha / NE / 3.8 mi. | 3,121 | 9,485 | 32.9 | $31,067 | 44.3 | 34.7 | 6.3 | 0.9 | 0.7 | |
| 68105 / Omaha / NE / 2.1 mi. | 3,055 | 10,045 | 30.4 | $30,851 | 29.0 | 20.0 | 5.0 | 1.1 | 1.4 | |
| 68123 / Bellevue / NE / 11.1 mi. | 3,042 | 8,277 | 36.8 | $54,692 | 19.8 | 5.2 | 8.3 | 0.4 | 2.9 | |
| 68135 / Omaha / NE / 14.1 mi. | 2,949 | 3,848 | 76.6 | $90,263 | 4.5 | 1.3 | 0.3 | 0.1 | 2.1 | |
| 68130 / Omaha / NE / 13.2 mi. | 2,804 | 3,692 | 75.9 | $80,602 | 4.4 | 1.4 | 0.9 | 0.2 | 1.4 | |
| 68601 / Columbus / NE / 71.7 mi. | 2,593 | 10,499 | 24.7 | $40,161 | 9.2 | 7.6 | 0.3 | 0.3 | 0.4 | |
| 68132 / Omaha / NE / 3.5 mi. | 2,577 | 6,146 | 41.9 | $36,765 | 15.3 | 4.4 | 5.8 | 0.4 | 2.6 | |
| 51501 / Council Bluffs / IA / 5.2 mi. | 2,500 | 13,346 | 18.7 | $34,139 | 9.1 | 5.6 | 1.3 | 0.4 | 0.6 | |
| 68701 / Norfolk / NE / 94.8 mi. | 2,318 | 11,698 | 19.8 | $36,179 | 10.3 | 6.9 | 1.1 | 1.2 | 0.4 | |
| 68131 / Omaha / NE / 1.5 mi. | 2,198 | 5,745 | 38.3 | $24,882 | 40.0 | 10.4 | 21.1 | 1.1 | 4.7 | |
| 68116 / Omaha / NE / 12.3 mi. | 2,094 | 3,149 | 66.5 | $76,518 | 7.5 | 1.7 | 1.6 | 0.1 | 3.0 | |
| 68108 / Omaha / NE / 1.7 mi. | 1,918 | 5,227 | 36.7 | $30,243 | 35.0 | 28.0 | 2.9 | 1.2 | 1.1 | |
| 68112 / Omaha / NE / 6.7 mi. | 1,899 | 4,494 | 42.3 | $37,608 | 27.0 | 4.9 | 19.1 | 1.0 | 0.4 | |
| 68022 / Elkhorn / NE / 16.6 mi. | 1,885 | 3,038 | 62.0 | $71,571 | 3.0 | 1.7 | 0.2 | 0.2 | 0.4 | |
| 68118 / Omaha / NE / 12.6 mi. | 1,885 | 2,605 | 72.4 | $90,247 | 5.8 | 1.4 | 1.1 | 0.3 | 2.1 | |
| 68138 / Omaha / NE / 12.7 mi. | 1,852 | 4,135 | 44.8 | $60,219 | 6.0 | 2.8 | 0.7 | 0.3 | 1.0 | |
| 68128 / La Vista / NE / 8.8 mi. | 1,844 | 4,431 | 41.6 | $47,431 | 11.6 | 4.1 | 2.9 | 0.4 | 2.4 | |
| 68111 / Omaha / NE / 2.7 mi. | 1,814 | 9,151 | 19.8 | $23,470 | 78.8 | 4.1 | 70.6 | 1.0 | 0.4 | |
| 68117 / Omaha / NE / 5.1 mi. | 1,701 | 3,090 | 55.0 | $40,371 | 11.8 | 7.9 | 1.1 | 0.7 | 1.0 | |
| 68008 / Blair / NE / 25.9 mi. | 1,642 | 4,115 | 39.9 | $47,042 | 2.8 | 1.2 | 0.4 | 0.2 | 0.5 | |
| 68048 / Plattsmouth / NE / 20.4 mi. | 1,471 | 4,456 | 33.0 | $45,872 | 3.7 | 1.8 | 0.3 | 0.3 | 0.4 | |
| 68147 / Bellevue / NE / 5.9 mi. | 1,438 | 3,599 | 40.0 | $44,039 | 17.6 | 8.9 | 4.6 | 0.4 | 1.9 | |
| 68508 / Lincoln / NE / 50.7 mi. | 1,385 | 4,636 | 29.9 | $17,492 | 18.5 | 7.4 | 4.2 | 0.9 | 3.9 | |
| 68152 / Omaha / NE / 7.4 mi. | 1,349 | 2,428 | 55.6 | $51,974 | 27.4 | 1.5 | 23.0 | 0.2 | 0.4 | |
| 68110 / Omaha / NE / 2.6 mi. | 1,312 | 3,065 | 42.8 | $23,242 | 65.3 | 4.5 | 56.3 | 1.1 | 0.3 | |
| 69101 / North Platte / NE / 251.8 mi. | 1,221 | 11,658 | 10.5 | $36,346 | 8.1 | 5.9 | 0.6 | 0.4 | 0.4 | |
| 68901 / Hastings / NE / 136.2 mi. | 1,182 | 10,378 | 11.4 | $36,886 | 8.8 | 5.2 | 0.7 | 0.4 | 1.9 | |
| 68122 / Omaha / NE / 9.1 mi. | 1,164 | 1,903 | 61.2 | $59,063 | 13.1 | 1.6 | 8.6 | 0.3 | 1.6 | |
| 51442 / Denison / IA / 58.5 mi. | 1,153 | 3,238 | 35.6 | $33,535 | 18.1 | 15.4 | 1.2 | 0.2 | 0.8 | |
| 68028 / Gretna / NE / 19.7 mi. | 1,113 | 1,749 | 63.6 | $57,766 | 2.2 | 0.9 | 0.1 | 0.3 | 0.2 | |
| 68845 / Kearney / NE / 163.9 mi. | 1,065 | 6,093 | 17.5 | $38,712 | 6.8 | 3.4 | 0.9 | 0.4 | 1.1 | |
| 68157 / Omaha / NE / 6.4 mi. | 1,062 | 1,859 | 57.1 | $54,098 | 10.6 | 6.1 | 2.5 | 0.2 | 0.9 | |
| 68801 / Grand Island / NE / 127.2 mi. | 946 | 10,336 | 9.2 | $35,494 | 23.3 | 20.5 | 0.4 | 0.4 | 1.3 | |
| 68847 / Kearney / NE / 160.1 mi. | 938 | 5,930 | 15.8 | $35,084 | 6.8 | 4.7 | 0.4 | 0.3 | 0.6 | |
| 68133 / Papillion / NE / 8.9 mi. | 922 | 1,294 | 71.3 | $75,935 | 8.8 | 2.9 | 1.5 | 0.2 | 2.9 | |
| 68850 / Lexington / NE / 201.2 mi. | 894 | 3,802 | 23.5 | $38,304 | 47.6 | 45.2 | 0.3 | 0.7 | 1.0 | |
| 51534 / Glenwood / IA / 20.1 mi. | 888 | 2,959 | 30.0 | $45,490 | 3.3 | 1.4 | 0.4 | 0.3 | 0.3 | |
| 68516 / Lincoln / NE / 52.4 mi. | 885 | 11,923 | 7.4 | $64,415 | 6.1 | 1.7 | 1.0 | 0.1 | 2.4 | |
| 68410 / Nebraska City / NE / 42.2 mi. | 878 | 3,336 | 26.3 | $35,453 | 5.3 | 3.8 | 0.3 | 0.3 | 0.3 | |
| 51632 / Clarinda / IA / 57.3 mi. | 812 | 2,577 | 31.5 | $37,190 | 7.5 | 1.3 | 3.7 | 0.5 | 0.9 | |
| 51566 / Red Oak / IA / 40.4 mi. | 804 | 3,235 | 24.9 | $33,039 | 3.0 | 1.8 | 0.1 | 0.4 | 0.3 | |
| 68788 / West Point / NE / 56.8 mi. | 788 | 2,044 | 38.6 | $33,701 | 10.1 | 9.4 | 0.0 | 0.2 | 0.2 | |
| 51537 / Harlan / IA / 41.9 mi. | 786 | 2,786 | 28.2 | $38,721 | 2.0 | 0.7 | 0.2 | 0.2 | 0.4 | |
| 68510 / Lincoln / NE / 48.7 mi. | 765 | 9,565 | 8.0 | $39,366 | 11.7 | 3.4 | 2.7 | 0.4 | 3.2 | |
| 68136 / Omaha / NE / 14.6 mi. | 751 | 819 | 91.7 | $81,693 | 3.4 | 1.7 | 0.3 | 0.2 | 0.7 | |
| 69001 / Mc Cook / NE / 257.9 mi. | 749 | 3,960 | 18.9 | $32,222 | 3.9 | 2.6 | 0.1 | 0.3 | 0.2 | |
| 68949 / Holdrege / NE / 184.6 mi. | 678 | 2,740 | 24.7 | $37,160 | 4.1 | 2.8 | 0.1 | 0.3 | 0.3 | |
| 68506 / Lincoln / NE / 49.4 mi. | 663 | 11,560 | 5.7 | $48,158 | 6.1 | 1.8 | 1.2 | 0.2 | 1.6 | |
| 68066 / Wahoo / NE / 35.8 mi. | 657 | 1,943 | 33.8 | $36,466 | 1.9 | 0.7 | 0.1 | 0.3 | 0.3 | |
| 68661 / Schuyler / NE / 61.2 mi. | 640 | 2,247 | 28.5 | $37,699 | 39.9 | 39.0 | 0.1 | 0.2 | 0.2 | |
| 50022 / Atlantic / IA / 48.4 mi. | 619 | 3,663 | 16.9 | $33,972 | 1.8 | 0.8 | 0.3 | 0.1 | 0.2 | |
| 51555 / Missouri Valley / IA / 21.6 mi. | 610 | 2,148 | 28.4 | $41,218 | 1.9 | 0.9 | 0.1 | 0.2 | 0.2 | |
| 68064 / Valley / NE / 22.8 mi. | 581 | 1,281 | 45.4 | $42,154 | 3.6 | 1.3 | 0.4 | 0.7 | 0.3 | |
| 68763 / Oneill / NE / 166.6 mi. | 581 | 2,047 | 28.4 | $31,565 | 1.9 | 1.0 | 0.0 | 0.4 | 0.2 | |
| 68787 / Wayne / NE / 85.5 mi. | 581 | 2,235 | 26.0 | $30,170 | 4.1 | 1.2 | 1.3 | 0.4 | 0.4 | |
| 69301 / Alliance / NE / 376.8 mi. | 577 | 4,222 | 13.7 | $39,381 | 13.0 | 8.0 | 0.4 | 2.7 | 0.6 | |
| 68467 / York / NE / 88.6 mi. | 566 | 3,801 | 14.9 | $36,806 | 4.8 | 1.8 | 1.3 | 0.3 | 0.6 | |
| 51601 / Shenandoah / IA / 48.5 mi. | 533 | 2,741 | 19.4 | $31,528 | 3.6 | 2.2 | 0.2 | 0.5 | 0.3 | |
| 68305 / Auburn / NE / 64.3 mi. | 530 | 1,836 | 28.9 | $35,203 | 2.7 | 0.8 | 0.3 | 0.2 | 0.9 | |
| 68310 / Beatrice / NE / 81.4 mi. | 529 | 6,097 | 8.7 | $35,240 | 3.0 | 0.9 | 0.4 | 0.5 | 0.3 | |
| 68502 / Lincoln / NE / 51.8 mi. | 517 | 11,527 | 4.5 | $35,627 | 15.1 | 5.4 | 5.1 | 0.9 | 1.8 | |
| 69201 / Valentine / NE / 262 mi. | 517 | 1,658 | 31.2 | $29,877 | 6.7 | 0.9 | 0.0 | 4.2 | 0.5 | |
| 68504 / Lincoln / NE / 47.2 mi. | 510 | 6,424 | 7.9 | $30,481 | 11.1 | 3.4 | 3.0 | 0.6 | 2.0 | |
| 68007 / Bennington / NE / 14.4 mi. | 480 | 775 | 61.9 | $53,413 | 2.8 | 1.4 | 0.3 | 0.1 | 0.6 | |
| 51401 / Carroll / IA / 79.2 mi. | 477 | 4,886 | 9.8 | $40,078 | 1.5 | 0.5 | 0.1 | 0.1 | 0.5 | |
| 51510 / Carter Lake / IA / 2 mi. | 466 | 1,221 | 38.2 | $37,851 | 5.3 | 2.9 | 0.3 | 0.7 | 0.3 | |
| 69153 / Ogallala / NE / 296.5 mi. | 464 | 2,550 | 18.2 | $34,307 | 5.8 | 4.7 | 0.0 | 0.6 | 0.2 | |
| 68822 / Broken Bow / NE / 190.3 mi. | 456 | 2,015 | 22.6 | $31,777 | 2.0 | 0.7 | 0.1 | 0.5 | 0.1 | |
| 68355 / Falls City / NE / 80.7 mi. | 454 | 2,385 | 19.0 | $30,102 | 4.7 | 0.8 | 0.1 | 2.0 | 0.2 | |
| 68059 / Springfield / NE / 18.5 mi. | 431 | 1,053 | 40.9 | $57,074 | 2.4 | 1.3 | 0.1 | 0.1 | 0.4 | |
| 69162 / Sidney / NE / 368.1 mi. | 431 | 3,053 | 14.1 | $34,271 | 7.2 | 5.3 | 0.1 | 0.7 | 0.5 | |
| 68803 / Grand Island / NE / 134.9 mi. | 426 | 7,972 | 5.3 | $38,555 | 10.2 | 8.1 | 0.3 | 0.2 | 1.1 | |
| 68776 / South Sioux City / NE / 87.4 mi. | 421 | 5,166 | 8.1 | $36,628 | 35.7 | 28.0 | 0.7 | 1.8 | 3.8 | |
| 69361 / Scottsbluff / NE / 400.8 mi. | 412 | 7,203 | 5.7 | $30,962 | 25.0 | 20.8 | 0.3 | 2.2 | 0.7 | |
| 69130 / Cozad / NE / 215 mi. | 410 | 2,247 | 18.2 | $34,022 | 10.5 | 9.1 | 0.1 | 0.2 | 0.3 | |
| 68003 / Ashland / NE / 29.1 mi. | 397 | 1,592 | 24.9 | $46,399 | 2.6 | 1.4 | 0.1 | 0.2 | 0.2 | |
| 68521 / Lincoln / NE / 49 mi. | 396 | 9,794 | 4.0 | $42,023 | 13.3 | 3.6 | 2.7 | 0.6 | 4.5 | |
| 69337 / Chadron / NE / 377.5 mi. | 392 | 2,676 | 14.6 | $29,308 | 8.7 | 2.7 | 1.0 | 3.3 | 0.4 | |
| 68069 / Waterloo / NE / 19.8 mi. | 390 | 875 | 44.6 | $50,129 | 3.0 | 1.8 | 0.4 | 0.1 | 0.1 | |
| 68061 / Tekamah / NE / 39.8 mi. | 387 | 1,114 | 34.7 | $36,495 | 1.6 | 0.8 | 0.1 | 0.3 | 0.1 | |
| 68507 / Lincoln / NE / 44.9 mi. | 367 | 5,395 | 6.8 | $45,056 | 6.2 | 2.3 | 1.1 | 0.4 | 1.2 | |
| 68023 / Fort Calhoun / NE / 12.9 mi. | 363 | 870 | 41.7 | $55,766 | 2.6 | 1.0 | 0.8 | 0.2 | 0.0 | |
| 68045 / Oakland / NE / 48.9 mi. | 347 | 804 | 43.2 | $36,036 | 1.8 | 0.5 | 0.0 | 0.3 | 0.3 | |
| 68620 / Albion / NE / 112.7 mi. | 346 | 1,290 | 26.8 | $32,875 | 1.3 | 0.9 | 0.0 | 0.1 | 0.1 | |
| 69138 / Gothenburg / NE / 218.7 mi. | 344 | 1,802 | 19.1 | $36,121 | 4.8 | 3.6 | 0.4 | 0.3 | 0.2 | |
| 68632 / David City / NE / 62.1 mi. | 328 | 1,503 | 21.8 | $36,078 | 2.6 | 1.8 | 0.0 | 0.2 | 0.3 | |
| 68037 / Louisville / NE / 24.8 mi. | 328 | 786 | 41.7 | $45,556 | 2.3 | 1.2 | 0.1 | 0.3 | 0.3 | |
| 69210 / Ainsworth / NE / 217.1 mi. | 324 | 1,216 | 26.6 | $29,278 | 1.8 | 0.7 | 0.0 | 0.2 | 0.3 | |
| 68959 / Minden / NE / 163.7 mi. | 298 | 1,650 | 18.1 | $40,273 | 3.0 | 2.1 | 0.1 | 0.1 | 0.2 | |
| 68002 / Arlington / NE / 20.5 mi. | 287 | 793 | 36.2 | $47,461 | 2.3 | 1.3 | 0.1 | 0.1 | 0.4 | |
| 68352 / Fairbury / NE / 101 mi. | 276 | 2,429 | 11.4 | $31,164 | 2.9 | 1.6 | 0.1 | 0.5 | 0.2 | |
| 68047 / Pender / NE / 72.8 mi. | 256 | 750 | 34.1 | $32,500 | 2.8 | 1.3 | 0.2 | 0.9 | 0.0 | |
| 68073 / Yutan / NE / 24.6 mi. | 256 | 633 | 40.4 | $47,794 | 3.4 | 1.1 | 0.2 | 0.5 | 0.4 | |
| 68142 / Omaha / NE / 11.6 mi. | 250 | 635 | 39.4 | $43,514 | 5.8 | 2.3 | 0.8 | 0.6 | 0.5 | |
| 51521 / Avoca / IA / 31.8 mi. | 243 | 874 | 27.8 | $40,274 | 1.9 | 1.4 | 0.1 | 0.0 | 0.1 | |
| 68503 / Lincoln / NE / 49 mi. | 239 | 6,317 | 3.8 | $26,755 | 31.4 | 6.9 | 8.7 | 1.6 | 10.1 | |
| 68505 / Lincoln / NE / 46.2 mi. | 238 | 5,817 | 4.1 | $40,884 | 6.7 | 2.0 | 1.1 | 0.3 | 2.1 | |
| 68713 / Atkinson / NE / 182.7 mi. | 233 | 964 | 24.2 | $30,556 | 1.2 | 0.7 | 0.0 | 0.0 | 0.3 | |
| 50833 / Bedford / IA / 75 mi. | 228 | 1,076 | 21.2 | $32,161 | 2.2 | 1.3 | 0.0 | 0.2 | 0.2 | |
| 50841 / Corning / IA / 63.4 mi. | 228 | 1,306 | 17.5 | $29,947 | 1.4 | 0.7 | 0.1 | 0.2 | 0.2 | |
| 51579 / Woodbine / IA / 35.2 mi. | 227 | 944 | 24.0 | $34,044 | 2.3 | 0.9 | 0.1 | 0.3 | 0.4 | |
| 68434 / Seward / NE / 67.2 mi. | 226 | 2,918 | 7.7 | $44,286 | 2.8 | 1.2 | 0.4 | 0.1 | 0.5 | |
| 68038 / Lyons / NE / 55.5 mi. | 225 | 639 | 35.2 | $32,043 | 4.5 | 3.5 | 0.3 | 0.1 | 0.3 | |
| 51529 / Dunlap / IA / 40.9 mi. | 213 | 734 | 29.0 | $31,429 | 1.3 | 0.3 | 0.1 | 0.2 | 0.1 | |
| 68057 / Scribner / NE / 46 mi. | 211 | 663 | 31.8 | $35,833 | 1.5 | 0.6 | 0.2 | 0.1 | 0.3 | |
| 68739 / Hartington / NE / 118 mi. | 211 | 1,168 | 18.1 | $35,313 | 0.9 | 0.3 | 0.2 | 0.1 | 0.0 | |
| 68512 / Lincoln / NE / 54.5 mi. | 204 | 2,848 | 7.2 | $49,406 | 7.3 | 1.9 | 1.6 | 0.2 | 2.5 | |
| 50801 / Creston / IA / 81.3 mi. | 204 | 3,926 | 5.2 | $31,659 | 2.4 | 1.1 | 0.3 | 0.3 | 0.3 | |
| 69033 / Imperial / NE / 302.8 mi. | 203 | 1,013 | 20.0 | $34,432 | 4.8 | 4.3 | 0.1 | 0.0 | 0.2 | |
| 68791 / Wisner / NE / 72.8 mi. | 202 | 770 | 26.2 | $33,547 | 1.6 | 0.7 | 0.3 | 0.0 | 0.3 | |
| 50025 / Audubon / IA / 64 mi. | 198 | 1,523 | 13.0 | $35,266 | 0.8 | 0.2 | 0.2 | 0.1 | 0.0 | |
| 68113 / Offutt A F B / NE / 9.2 mi. | 197 | 322 | 61.2 | $27,111 | 29.1 | 8.7 | 13.8 | 0.7 | 2.7 | |
| 68463 / Weeping Water / NE / 30 mi. | 194 | 617 | 31.4 | $44,602 | 1.1 | 0.4 | 0.0 | 0.1 | 0.2 | |
| 68862 / Ord / NE / 158.9 mi. | 191 | 1,342 | 14.2 | $29,329 | 2.7 | 1.6 | 0.0 | 0.5 | 0.1 | |
| 69343 / Gordon / NE / 338.2 mi. | 191 | 1,278 | 14.9 | $27,979 | 13.0 | 1.4 | 0.0 | 9.5 | 0.2 | |
| 51535 / Griswold / IA / 46.6 mi. | 190 | 810 | 23.5 | $34,844 | 1.7 | 0.7 | 0.5 | 0.3 | 0.1 | |
| 69129 / Chappell / NE / 337.5 mi. | 189 | 616 | 30.7 | $36,065 | 2.5 | 1.0 | 0.1 | 0.2 | 0.5 | |
| 51546 / Logan / IA / 26.4 mi. | 188 | 1,091 | 17.2 | $40,614 | 1.5 | 0.7 | 0.1 | 0.1 | 0.1 | |
| 68333 / Crete / NE / 71.4 mi. | 187 | 2,606 | 7.2 | $37,661 | 16.0 | 11.0 | 0.6 | 0.4 | 2.9 | |
| 69341 / Gering / NE / 402.2 mi. | 186 | 4,233 | 4.4 | $34,486 | 16.5 | 14.5 | 0.1 | 1.0 | 0.3 | |
| 68031 / Hooper / NE / 40.8 mi. | 185 | 753 | 24.6 | $39,306 | 2.3 | 1.9 | 0.1 | 0.1 | 0.2 | |
| 68649 / North Bend / NE / 46.9 mi. | 184 | 713 | 25.8 | $38,189 | 1.7 | 1.4 | 0.1 | 0.1 | 0.1 | |
| 51640 / Hamburg / IA / 49.8 mi. | 181 | 766 | 23.6 | $33,021 | 5.1 | 4.2 | 0.1 | 0.2 | 0.4 | |
| 50864 / Villisca / IA / 53 mi. | 179 | 936 | 19.1 | $31,400 | 1.1 | 0.4 | 0.1 | 0.2 | 0.0 | |
| 68633 / Dodge / NE / 51.5 mi. | 178 | 533 | 33.4 | $32,639 | 1.9 | 1.3 | 0.0 | 0.1 | 0.2 | |
| 68756 / Neligh / NE / 121.6 mi. | 176 | 909 | 19.4 | $30,719 | 1.6 | 1.1 | 0.0 | 0.1 | 0.0 | |
| 51040 / Onawa / IA / 55.5 mi. | 175 | 1,553 | 11.3 | $35,849 | 3.1 | 1.1 | 0.0 | 1.4 | 0.2 | |
| 51526 / Crescent / IA / 9.5 mi. | 173 | 631 | 27.4 | $60,100 | 2.5 | 1.2 | 0.1 | 0.4 | 0.3 | |
| 51560 / Oakland / IA / 34.1 mi. | 171 | 835 | 20.5 | $38,487 | 1.7 | 0.3 | 0.4 | 0.2 | 0.2 | |
| 68641 / Howells / NE / 59.8 mi. | 171 | 480 | 35.6 | $34,618 | 1.9 | 0.7 | 0.0 | 0.1 | 0.3 | |
| 51455 / Manning / IA / 64.4 mi. | 169 | 955 | 17.7 | $33,469 | 1.4 | 0.7 | 0.0 | 0.1 | 0.4 | |
| 68446 / Syracuse / NE / 44 mi. | 167 | 1,006 | 16.6 | $39,770 | 1.4 | 0.5 | 0.0 | 0.0 | 0.2 | |
| 68779 / Stanton / NE / 77.8 mi. | 167 | 936 | 17.8 | $34,963 | 3.1 | 1.6 | 0.2 | 0.4 | 0.2 | |
| 51551 / Malvern / IA / 24.2 mi. | 165 | 702 | 23.5 | $38,603 | 1.5 | 0.4 | 0.1 | 0.1 | 0.2 | |
| 51652 / Sidney / IA / 37.8 mi. | 165 | 772 | 21.4 | $41,023 | 2.7 | 1.9 | 0.1 | 0.4 | 0.1 | |
| 57078 / Yankton / SD / 136.7 mi. | 165 | 6,845 | 2.4 | $35,446 | 6.6 | 2.0 | 1.4 | 1.7 | 0.5 | |
| 68718 / Bloomfield / NE / 129.3 mi. | 164 | 847 | 19.4 | $28,060 | 4.3 | 0.6 | 0.0 | 3.1 | 0.3 | |
| 68784 / Wakefield / NE / 86.2 mi. | 163 | 815 | 20.0 | $36,450 | 15.2 | 13.9 | 0.0 | 0.4 | 0.3 | |
| 68978 / Superior / NE / 142.1 mi. | 161 | 1,134 | 14.2 | $26,936 | 1.4 | 0.9 | 0.0 | 0.0 | 0.2 | |
| 68714 / Bassett / NE / 206.5 mi. | 159 | 614 | 25.9 | $25,505 | 1.5 | 0.7 | 0.0 | 0.4 | 0.1 | |
| 68651 / Osceola / NE / 85.1 mi. | 158 | 612 | 25.8 | $37,773 | 0.7 | 0.3 | 0.0 | 0.2 | 0.0 | |
| 50316 / Des Moines / IA / 123.4 mi. | 156 | 5,945 | 2.6 | $32,129 | 36.8 | 11.8 | 15.6 | 0.5 | 6.5 | |
| 68920 / Alma / NE / 193.8 mi. | 155 | 660 | 23.5 | $31,118 | 1.2 | 0.5 | 0.2 | 0.1 | 0.1 | |
| 68748 / Madison / NE / 91.6 mi. | 154 | 1,086 | 14.2 | $36,644 | 26.0 | 25.0 | 0.3 | 0.2 | 0.2 | |
| 68361 / Geneva / NE / 103.2 mi. | 148 | 1,102 | 13.4 | $34,534 | 3.6 | 2.1 | 0.4 | 0.6 | 0.0 | |
| 51653 / Tabor / IA / 28.5 mi. | 144 | 554 | 26.0 | $39,773 | 1.9 | 1.2 | 0.0 | 0.1 | 0.1 | |
| 68450 / Tecumseh / NE / 64.4 mi. | 143 | 1,016 | 14.1 | $31,135 | 11.4 | 4.9 | 0.1 | 0.3 | 4.5 | |
| 51105 / Sioux City / IA / 88.9 mi. | 141 | 4,279 | 3.3 | $26,972 | 43.3 | 26.7 | 3.5 | 3.5 | 7.0 | |
| 68818 / Aurora / NE / 114.2 mi. | 140 | 2,051 | 6.8 | $38,889 | 2.3 | 1.3 | 0.2 | 0.1 | 0.3 | |
| 68937 / Elwood / NE / 210.8 mi. | 139 | 796 | 17.5 | $37,804 | 2.6 | 2.0 | 0.1 | 0.1 | 0.2 | |
| 68666 / Stromsburg / NE / 82.5 mi. | 137 | 659 | 20.8 | $37,794 | 1.1 | 0.5 | 0.0 | 0.1 | 0.1 | |
| 69154 / Oshkosh / NE / 332.3 mi. | 136 | 606 | 22.4 | $27,803 | 2.0 | 1.5 | 0.0 | 0.1 | 0.1 | |
| 51577 / Walnut / IA / 39 mi. | 136 | 508 | 26.8 | $38,819 | 2.4 | 0.5 | 0.6 | 0.1 | 0.2 | |
| 68767 / Pierce / NE / 104.3 mi. | 132 | 1,166 | 11.3 | $36,743 | 1.2 | 0.6 | 0.0 | 0.2 | 0.2 | |
| 68729 / Creighton / NE / 128.8 mi. | 131 | 807 | 16.2 | $29,107 | 1.7 | 0.1 | 0.3 | 0.7 | 0.3 | |
| 69140 / Grant / NE / 302 mi. | 131 | 739 | 17.7 | $34,148 | 2.5 | 1.1 | 0.0 | 0.3 | 0.1 | |
| 68769 / Plainview / NE / 119.2 mi. | 130 | 829 | 15.7 | $29,015 | 2.1 | 0.3 | 0.1 | 0.8 | 0.3 | |
| 68922 / Arapahoe / NE / 219.9 mi. | 126 | 612 | 20.6 | $29,357 | 3.1 | 1.4 | 0.0 | 0.6 | 0.6 | |
| 69022 / Cambridge / NE / 231.2 mi. | 126 | 698 | 18.1 | $33,333 | 1.6 | 0.9 | 0.1 | 0.2 | 0.1 | |
| 68370 / Hebron / NE / 116.8 mi. | 124 | 913 | 13.6 | $31,371 | 1.3 | 0.5 | 0.0 | 0.2 | 0.1 | |
| 68636 / Elgin / NE / 120.1 mi. | 122 | 616 | 19.8 | $30,400 | 0.5 | 0.1 | 0.1 | 0.0 | 0.0 | |
| 68642 / Humphrey / NE / 86.1 mi. | 122 | 648 | 18.8 | $37,989 | 1.7 | 1.1 | 0.2 | 0.0 | 0.2 | |
| 68716 / Beemer / NE / 66.8 mi. | 122 | 475 | 25.7 | $30,815 | 3.6 | 2.6 | 0.0 | 0.3 | 0.3 | |
| 51454 / Manilla / IA / 56.4 mi. | 121 | 598 | 20.2 | $33,850 | 1.9 | 0.4 | 0.2 | 0.3 | 0.0 | |
| 68629 / Clarkson / NE / 65.2 mi. | 120 | 570 | 21.1 | $31,458 | 2.3 | 2.2 | 0.0 | 0.0 | 0.0 | |
| 68745 / Laurel / NE / 99.4 mi. | 119 | 654 | 18.2 | $31,786 | 0.8 | 0.5 | 0.0 | 0.1 | 0.1 | |
| 51573 / Stanton / IA / 47.5 mi. | 119 | 464 | 25.6 | $37,143 | 1.4 | 0.5 | 0.0 | 0.3 | 0.1 | |
| 68771 / Randolph / NE / 105.7 mi. | 118 | 671 | 17.6 | $30,786 | 1.8 | 0.5 | 0.1 | 0.3 | 0.2 | |
| 68863 / Overton / NE / 189.5 mi. | 118 | 439 | 26.9 | $34,464 | 6.3 | 5.2 | 0.0 | 0.4 | 0.2 | |
| 68660 / Saint Edward / NE / 106.6 mi. | 115 | 504 | 22.8 | $29,940 | 1.6 | 1.1 | 0.2 | 0.1 | 0.0 | |
| 68640 / Genoa / NE / 98.7 mi. | 114 | 650 | 17.5 | $32,375 | 1.6 | 0.6 | 0.0 | 0.2 | 0.1 | |
| 68004 / Bancroft / NE / 66.2 mi. | 113 | 403 | 28.0 | $30,380 | 1.6 | 0.0 | 0.0 | 0.5 | 0.4 | |
| 68020 / Decatur / NE / 52.1 mi. | 113 | 394 | 28.7 | $30,104 | 12.8 | 1.1 | 0.6 | 8.5 | 0.2 | |
| 68715 / Battle Creek / NE / 99.3 mi. | 112 | 564 | 19.9 | $41,447 | 3.4 | 1.5 | 0.1 | 1.1 | 0.0 | |
| 69145 / Kimball / NE / 402.3 mi. | 112 | 1,415 | 7.9 | $30,616 | 5.6 | 3.0 | 0.3 | 0.8 | 0.1 | |
| 68777 / Spencer / NE / 182.3 mi. | 111 | 384 | 28.9 | $29,514 | 0.5 | 0.0 | 0.0 | 0.2 | 0.3 | |
| 68826 / Central City / NE / 108 mi. | 110 | 1,550 | 7.1 | $34,831 | 2.1 | 1.0 | 0.3 | 0.1 | 0.3 | |
| 50848 / Gravity / IA / 69.2 mi. | 110 | 181 | 60.8 | $29,500 | 2.8 | 1.5 | 0.2 | 0.2 | 0.2 | |
| 51575 / Treynor / IA / 17.2 mi. | 110 | 247 | 44.5 | $54,464 | 0.6 | 0.2 | 0.2 | 0.0 | 0.3 | |
| 68873 / Saint Paul / NE / 129.4 mi. | 107 | 1,380 | 7.8 | $33,041 | 1.6 | 0.8 | 0.2 | 0.3 | 0.2 | |
| 68041 / Mead / NE / 30.3 mi. | 106 | 329 | 32.2 | $50,000 | 2.2 | 1.7 | 0.0 | 0.1 | 0.1 | |
| 68376 / Humboldt / NE / 78.2 mi. | 105 | 711 | 14.8 | $31,250 | 3.9 | 1.5 | 0.2 | 1.2 | 0.1 | |
| 68034 / Kennard / NE / 19.5 mi. | 103 | 264 | 39.0 | $47,222 | 2.4 | 0.6 | 0.1 | 0.4 | 0.4 | |
| 51530 / Earling / IA / 45.7 mi. | 102 | 378 | 27.0 | $32,750 | 1.1 | 0.2 | 0.0 | 0.5 | 0.0 | |
| 68662 / Shelby / NE / 77.8 mi. | 102 | 467 | 21.8 | $39,342 | 2.1 | 1.1 | 0.1 | 0.0 | 0.3 | |
| 68643 / Leigh / NE / 72.1 mi. | 101 | 417 | 24.2 | $32,386 | 0.8 | 0.7 | 0.0 | 0.0 | 0.0 | |
| 68780 / Stuart / NE / 186.6 mi. | 101 | 426 | 23.7 | $30,703 | 1.6 | 0.3 | 0.0 | 0.8 | 0.4 | |
| 68869 / Ravenna / NE / 151.8 mi. | 101 | 897 | 11.3 | $31,354 | 1.5 | 0.8 | 0.0 | 0.0 | 0.2 | |
| 68967 / Oxford / NE / 204.1 mi. | 101 | 528 | 19.1 | $32,222 | 2.2 | 0.8 | 0.1 | 0.4 | 0.2 | |
| 68786 / Wausa / NE / 120.5 mi. | 100 | 468 | 21.4 | $28,478 | 1.8 | 1.0 | 0.3 | 0.1 | 0.1 | |
| 68823 / Burwell / NE / 163.9 mi. | 100 | 958 | 10.4 | $26,750 | 1.6 | 0.9 | 0.0 | 0.2 | 0.1 | |
| 69336 / Bridgeport / NE / 363.7 mi. | 99 | 1,021 | 9.7 | $30,274 | 12.8 | 11.1 | 0.1 | 0.9 | 0.2 | |
| 68765 / Osmond / NE / 112.5 mi. | 98 | 545 | 18.0 | $28,828 | 1.4 | 0.7 | 0.1 | 0.2 | 0.3 | |
| 68781 / Tilden / NE / 112.3 mi. | 98 | 626 | 15.7 | $32,266 | 5.8 | 4.6 | 0.1 | 0.8 | 0.1 | |
| 51570 / Shelby / IA / 32.6 mi. | 97 | 439 | 22.1 | $37,632 | 2.2 | 0.8 | 0.0 | 0.4 | 0.1 | |
| 68010 / Boys Town / NE / 10 mi. | 96 | 54 | 177.8 | $51,058 | 36.7 | 7.7 | 20.9 | 1.2 | 0.5 | |
| 68015 / Cedar Bluffs / NE / 34.4 mi. | 95 | 476 | 20.0 | $36,774 | 1.3 | 0.3 | 0.3 | 0.3 | 0.3 | |
| 51542 / Honey Creek / IA / 14.4 mi. | 94 | 349 | 26.9 | $52,361 | 2.3 | 0.3 | 0.0 | 0.0 | 0.3 | |
| 51638 / Essex / IA / 44.5 mi. | 94 | 649 | 14.5 | $37,188 | 3.8 | 2.2 | 0.0 | 0.7 | 0.0 | |
| 68455 / Union / NE / 30.1 mi. | 94 | 290 | 32.4 | $42,232 | 4.0 | 2.3 | 0.0 | 0.1 | 0.9 | |
| 69360 / Rushville / NE / 349.1 mi. | 93 | 631 | 14.7 | $28,702 | 17.7 | 1.9 | 0.1 | 13.0 | 0.0 | |
| 68638 / Fullerton / NE / 113.8 mi. | 92 | 740 | 12.4 | $30,625 | 3.0 | 1.9 | 0.0 | 0.4 | 0.1 | |
| 50851 / Lenox / IA / 75.9 mi. | 92 | 903 | 10.2 | $31,488 | 9.7 | 8.9 | 0.0 | 0.0 | 0.5 | |
| 68939 / Franklin / NE / 172.5 mi. | 91 | 553 | 16.5 | $28,600 | 1.2 | 0.8 | 0.0 | 0.3 | 0.1 | |
| 68652 / Petersburg / NE / 121.6 mi. | 89 | 314 | 28.3 | $29,868 | 1.2 | 1.0 | 0.0 | 0.0 | 0.0 | |
| 68029 / Herman / NE / 33.1 mi. | 87 | 392 | 22.2 | $40,096 | 1.3 | 0.8 | 0.0 | 0.2 | 0.1 | |
| 68420 / Pawnee City / NE / 81.3 mi. | 86 | 677 | 12.7 | $27,069 | 1.3 | 0.8 | 0.0 | 0.2 | 0.0 | |
| 51553 / Minden / IA / 24 mi. | 85 | 368 | 23.1 | $46,667 | 0.5 | 0.3 | 0.0 | 0.0 | 0.2 | |
| 51559 / Neola / IA / 17.6 mi. | 85 | 659 | 12.9 | $47,663 | 2.0 | 0.7 | 0.2 | 0.4 | 0.5 | |
| 68528 / Lincoln / NE / 55.2 mi. | 84 | 1,695 | 5.0 | $41,923 | 15.5 | 5.5 | 2.5 | 0.6 | 5.5 | |
| 68421 / Peru / NE / 55.1 mi. | 83 | 327 | 25.4 | $27,298 | 4.7 | 2.2 | 1.3 | 0.3 | 0.4 | |
| 68927 / Bertrand / NE / 193.9 mi. | 83 | 513 | 16.2 | $37,132 | 1.3 | 0.7 | 0.1 | 0.2 | 0.2 | |
| 68970 / Red Cloud / NE / 156.9 mi. | 83 | 689 | 12.0 | $29,231 | 2.8 | 0.7 | 0.1 | 0.0 | 0.9 | |
| 69339 / Crawford / NE / 396.1 mi. | 82 | 672 | 12.2 | $30,500 | 6.0 | 1.9 | 0.1 | 2.6 | 0.0 | |
| 68730 / Crofton / NE / 133.5 mi. | 81 | 813 | 10.0 | $31,038 | 2.2 | 0.8 | 0.0 | 0.7 | 0.1 | |
| 68733 / Emerson / NE / 81.9 mi. | 80 | 546 | 14.7 | $36,157 | 5.7 | 4.2 | 0.0 | 0.6 | 0.6 | |
| 68735 / Ewing / NE / 141.7 mi. | 80 | 427 | 18.7 | $30,508 | 0.5 | 0.3 | 0.0 | 0.0 | 0.0 | |
| 69357 / Mitchell / NE / 407.2 mi. | 80 | 1,543 | 5.2 | $33,089 | 15.1 | 13.1 | 0.1 | 0.4 | 1.0 | |
| 51533 / Emerson / IA / 31.8 mi. | 80 | 406 | 19.7 | $33,194 | 1.0 | 0.3 | 0.1 | 0.1 | 0.2 | |
| 51104 / Sioux City / IA / 91.2 mi. | 79 | 8,564 | 0.9 | $46,380 | 13.6 | 6.9 | 1.6 | 0.9 | 2.8 | |
| 69024 / Culbertson / NE / 269.2 mi. | 78 | 462 | 16.9 | $33,333 | 2.4 | 1.3 | 0.2 | 0.1 | 0.1 | |
| 69155 / Paxton / NE / 282.7 mi. | 78 | 434 | 18.0 | $30,781 | 3.7 | 1.8 | 0.4 | 0.6 | 0.4 | |
| 51031 / Le Mars / IA / 108.2 mi. | 77 | 4,539 | 1.7 | $40,287 | 3.6 | 2.1 | 0.4 | 0.2 | 0.4 | |
| 51639 / Farragut / IA / 44.7 mi. | 77 | 319 | 24.1 | $35,625 | 3.6 | 2.3 | 0.0 | 0.1 | 0.3 | |
| 50076 / Exira / IA / 61.4 mi. | 76 | 645 | 11.8 | $30,061 | 1.7 | 0.5 | 0.1 | 0.1 | 0.5 | |
| 51528 / Dow City / IA / 49.9 mi. | 76 | 430 | 17.7 | $33,333 | 2.5 | 1.0 | 0.0 | 0.4 | 0.8 | |
| 51531 / Elk Horn / IA / 47.8 mi. | 76 | 357 | 21.3 | $36,964 | 1.1 | 0.2 | 0.0 | 0.0 | 0.8 | |
| 68409 / Murray / NE / 24.1 mi. | 76 | 290 | 26.2 | $54,250 | 2.7 | 1.3 | 0.0 | 0.0 | 0.9 | |
| 68758 / Newman Grove / NE / 101.2 mi. | 76 | 500 | 15.2 | $30,655 | 10.1 | 9.5 | 0.0 | 0.0 | 0.5 | |
| 68825 / Callaway / NE / 214.8 mi. | 76 | 441 | 17.2 | $32,969 | 2.5 | 1.1 | 0.0 | 0.3 | 0.5 | |
| 68840 / Gibbon / NE / 158.4 mi. | 75 | 1,017 | 7.4 | $36,500 | 15.6 | 14.8 | 0.1 | 0.1 | 0.1 | |
| 69045 / Wauneta / NE / 290.4 mi. | 75 | 465 | 16.1 | $30,129 | 2.5 | 1.5 | 0.4 | 0.0 | 0.4 | |
| 51557 / Mondamin / IA / 30.2 mi. | 73 | 357 | 20.4 | $41,007 | 2.0 | 0.9 | 0.0 | 0.3 | 0.0 | |
| 51561 / Pacific Junction / IA / 18.5 mi. | 73 | 589 | 12.4 | $44,167 | 3.2 | 1.3 | 0.0 | 0.3 | 0.7 | |
| 68624 / Bellwood / NE / 68.8 mi. | 72 | 399 | 18.0 | $35,781 | 1.2 | 0.8 | 0.1 | 0.0 | 0.3 | |
| 69034 / Indianola / NE / 245.6 mi. | 71 | 430 | 16.5 | $31,103 | 3.2 | 1.3 | 0.0 | 0.6 | 0.5 | |
| 69021 / Benkelman / NE / 302.5 mi. | 70 | 636 | 11.0 | $26,875 | 2.3 | 0.3 | 0.0 | 0.8 | 0.6 | |
| 68874 / Sargent / NE / 181 mi. | 69 | 437 | 15.8 | $27,011 | 2.6 | 1.8 | 0.0 | 0.5 | 0.2 | |
| 69122 / Big Springs / NE / 323.3 mi. | 69 | 320 | 21.6 | $29,265 | 6.9 | 6.2 | 0.0 | 0.5 | 0.0 | |
| 50849 / Greenfield / IA / 81.2 mi. | 69 | 1,239 | 5.6 | $36,947 | 0.9 | 0.3 | 0.0 | 0.0 | 0.3 | |
| 51525 / Carson / IA / 32.2 mi. | 69 | 440 | 15.7 | $46,111 | 1.1 | 0.0 | 0.0 | 0.0 | 0.2 | |
| 68016 / Cedar Creek / NE / 17.4 mi. | 68 | 153 | 44.4 | $45,625 | 0.6 | 0.0 | 0.0 | 0.0 | 0.0 | |
| 68050 / Prague / NE / 47.6 mi. | 68 | 281 | 24.2 | $30,795 | 2.1 | 1.2 | 0.0 | 0.0 | 0.1 | |
| 51445 / Ida Grove / IA / 78.7 mi. | 67 | 1,315 | 5.1 | $38,090 | 1.9 | 0.9 | 0.2 | 0.1 | 0.3 | |
| 51461 / Schleswig / IA / 66.9 mi. | 67 | 494 | 13.6 | $35,000 | 1.1 | 0.8 | 0.0 | 0.2 | 0.1 | |
| 64482 / Rock Port / MO / 59.5 mi. | 67 | 998 | 6.7 | $30,893 | 1.2 | 0.7 | 0.1 | 0.1 | 0.1 | |
| 68522 / Lincoln / NE / 53.7 mi. | 67 | 2,667 | 2.5 | $44,948 | 13.5 | 3.5 | 3.4 | 1.1 | 4.0 | |
| 68462 / Waverly / NE / 36.8 mi. | 66 | 1,044 | 6.3 | $51,324 | 2.5 | 1.0 | 0.2 | 0.4 | 0.3 | |
| 68760 / Niobrara / NE / 142.9 mi. | 66 | 449 | 14.7 | $20,993 | 49.5 | 2.0 | 0.0 | 46.1 | 0.0 | |
| 69347 / Hay Springs / NE / 358.1 mi. | 66 | 610 | 10.8 | $31,111 | 6.0 | 1.6 | 0.0 | 2.7 | 0.1 | |
| 68979 / Sutton / NE / 109.9 mi. | 65 | 749 | 8.7 | $35,152 | 3.7 | 2.9 | 0.1 | 0.2 | 0.3 | |
| 68407 / Murdock / NE / 30.5 mi. | 64 | 284 | 22.5 | $42,500 | 3.2 | 1.3 | 0.0 | 0.1 | 0.1 | |
| 68644 / Lindsay / NE / 93.7 mi. | 64 | 320 | 20.0 | $34,559 | 1.0 | 1.0 | 0.0 | 0.0 | 0.0 | |
| 51106 / Sioux City / IA / 83.8 mi. | 64 | 10,331 | 0.6 | $42,413 | 8.5 | 5.0 | 0.9 | 0.5 | 1.1 | |
| 66508 / Marysville / KS / 105.8 mi. | 63 | 1,930 | 3.3 | $33,750 | 2.0 | 0.6 | 0.1 | 0.4 | 0.4 | |
| 69025 / Curtis / NE / 243.6 mi. | 63 | 485 | 13.0 | $32,361 | 2.5 | 1.1 | 0.2 | 0.2 | 0.2 | |
| 68722 / Butte / NE / 187.4 mi. | 61 | 245 | 24.9 | $25,000 | 1.3 | 0.2 | 0.0 | 0.6 | 0.0 | |
| 68770 / Ponca / NE / 99.8 mi. | 61 | 647 | 9.4 | $40,049 | 2.8 | 1.8 | 0.0 | 0.4 | 0.0 | |
| 68933 / Clay Center / NE / 120.3 mi. | 61 | 427 | 14.3 | $37,313 | 4.6 | 2.9 | 0.2 | 0.2 | 0.7 | |
| 69044 / Trenton / NE / 278.5 mi. | 61 | 387 | 15.8 | $26,806 | 2.7 | 2.3 | 0.0 | 0.0 | 0.1 | |
| 51446 / Irwin / IA / 53.1 mi. | 61 | 253 | 24.1 | $30,789 | 2.2 | 1.5 | 0.2 | 0.2 | 0.0 | |
| 68746 / Lynch / NE / 169.4 mi. | 60 | 234 | 25.6 | $27,132 | 2.1 | 0.0 | 0.0 | 0.9 | 0.4 | |
| 68764 / Orchard / NE / 141.5 mi. | 59 | 331 | 17.8 | $23,750 | 1.1 | 0.2 | 0.0 | 0.1 | 0.0 | |
| 51430 / Arcadia / IA / 71 mi. | 59 | 313 | 18.8 | $34,875 | 0.5 | 0.1 | 0.0 | 0.0 | 0.3 | |
| 51565 / Portsmouth / IA / 34.8 mi. | 59 | 218 | 27.1 | $36,250 | 0.9 | 0.2 | 0.0 | 0.0 | 0.2 | |
| 51576 / Underwood / IA / 18.9 mi. | 59 | 522 | 11.3 | $53,047 | 1.3 | 0.7 | 0.1 | 0.0 | 0.1 | |
| 68019 / Craig / NE / 42 mi. | 59 | 253 | 23.3 | $31,000 | 0.8 | 0.0 | 0.0 | 0.2 | 0.0 | |
| 68924 / Axtell / NE / 173.6 mi. | 58 | 616 | 9.4 | $39,345 | 2.6 | 1.7 | 0.1 | 0.1 | 0.3 | |
| 68627 / Cedar Rapids / NE / 117.3 mi. | 57 | 324 | 17.6 | $28,359 | 0.8 | 0.6 | 0.0 | 0.0 | 0.0 | |
| 68665 / Spalding / NE / 130.6 mi. | 57 | 384 | 14.8 | $30,833 | 1.2 | 1.0 | 0.1 | 0.0 | 0.0 | |
| 68790 / Winside / NE / 89.6 mi. | 57 | 323 | 17.6 | $28,875 | 1.3 | 0.5 | 0.2 | 0.0 | 0.4 | |
| 68058 / South Bend / NE / 24.2 mi. | 57 | 32 | 178.1 | $41,250 | 11.1 | 2.5 | 0.0 | 0.0 | 0.0 | |
| 57580 / Winner / SD / 246.2 mi. | 56 | 1,889 | 3.0 | $29,007 | 15.1 | 1.1 | 0.0 | 12.6 | 0.0 | |
| 69120 / Arnold / NE / 216.5 mi. | 56 | 446 | 12.6 | $27,450 | 1.7 | 1.2 | 0.0 | 0.3 | 0.0 | |
| 68727 / Coleridge / NE / 108.2 mi. | 55 | 358 | 15.4 | $31,957 | 1.0 | 0.3 | 0.0 | 0.0 | 0.0 | |
| 51532 / Elliott / IA / 41.8 mi. | 55 | 293 | 18.8 | $38,409 | 1.3 | 0.1 | 0.0 | 0.0 | 0.3 | |
| 51571 / Silver City / IA / 19.6 mi. | 55 | 238 | 23.1 | $42,143 | 1.5 | 1.0 | 0.2 | 0.0 | 0.2 | |
| 51646 / New Market / IA / 65 mi. | 55 | 351 | 15.7 | $35,139 | 0.6 | 0.3 | 0.0 | 0.1 | 0.3 | |
| 51527 / Defiance / IA / 49.5 mi. | 54 | 237 | 22.8 | $40,662 | 2.6 | 1.7 | 0.0 | 0.6 | 0.2 | |
| 51562 / Panama / IA / 39.6 mi. | 54 | 181 | 29.8 | $39,205 | 1.5 | 0.7 | 0.2 | 0.0 | 0.0 | |
| 51564 / Pisgah / IA / 38.2 mi. | 53 | 232 | 22.8 | $32,188 | 2.2 | 0.9 | 0.6 | 0.0 | 0.4 | |
| 68663 / Silver Creek / NE / 90.3 mi. | 53 | 353 | 15.0 | $35,956 | 0.5 | 0.1 | 0.1 | 0.0 | 0.0 | |
| 68783 / Verdigre / NE / 149.5 mi. | 53 | 510 | 10.4 | $24,583 | 3.6 | 0.8 | 0.0 | 1.9 | 0.3 | |
| 68883 / Wood River / NE / 143 mi. | 53 | 852 | 6.2 | $38,464 | 8.8 | 8.3 | 0.1 | 0.0 | 0.2 | |
| 68926 / Beaver City / NE / 215.3 mi. | 53 | 348 | 15.2 | $28,359 | 3.4 | 2.0 | 0.1 | 0.4 | 0.0 | |
| File | ne_omaha_world-herald | |||||||||
| Time | 5/13/05 5:31 PM | |||||||||
| Page | 52 | |||||||||
| Member | 126400 | |||||||||