
|
| Comparing the racial diversity of the journalists | ||||||||||
| at America's daily newspapers | ||||||||||
| with the communities that they serve | ||||||||||
| Newsroom diversity report for | ||||||||||
| Lincoln Journal Star | ||||||||||
| Lincoln, Nebraska | ||||||||||
| Owner: Lee Enterprises (Iowa) | ||||||||||
| From a report for the Knight Foundation | ||||||||||
| by Bill Dedman and Stephen K. Doig, June 2005 | ||||||||||
| Click here to read the national report or to select another newspaper | ||||||||||
| Year | Non-white % of newsroom staff | 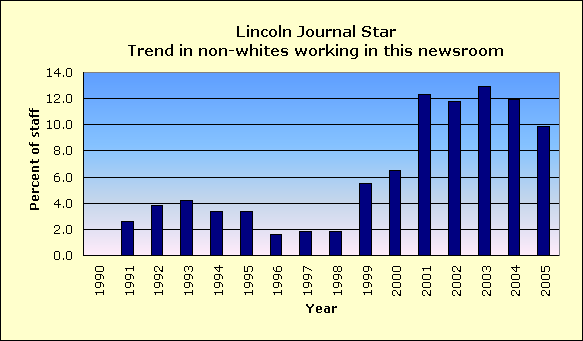
|
||||||||
| 2005 | 9.9 | |||||||||
| 2004 | 11.9 | |||||||||
| 2003 | 12.9 | |||||||||
| 2002 | 11.8 | |||||||||
| 2001 | 12.3 | |||||||||
| 2000 | 6.5 | |||||||||
| 1999 | 5.5 | |||||||||
| 1998 | 1.8 | |||||||||
| 1997 | 1.8 | |||||||||
| 1996 | 1.6 | |||||||||
| 1995 | 3.4 | |||||||||
| 1994 | 3.4 | |||||||||
| 1993 | 4.2 | |||||||||
| 1992 | 3.8 | |||||||||
| 1991 | 2.6 | |||||||||
| 1990 | Did not report | |||||||||
| The latest year at peak is | 2003 | |||||||||
| See the notes and definitions section below for the sources of these figures. | ||||||||||
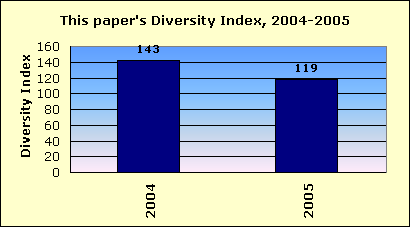
| Newsroom Diversity Index | ||||||||||
| for Lincoln Journal Star | ||||||||||
 |
||||||||||
| Year | Non-white % of newsroom staff | Non-white % of circulation area | Newsroom Diversity Index (parity=100) | |||||||
| 2005 | 9.9 | 8.3 | 119 | |||||||
| 2004 | 11.9 | 8.4 | 143 | |||||||
| How the index is calculated | ||||||||||
| The Newsroom Diversity Index is the non-white percentage of the newsroom staff | ||||||||||
| divided by the non-white percentage of residents in the circulation area. | ||||||||||
| (Parity = 100.) | ||||||||||
| Company index | ||||||||||
| This newspaper's owner, Lee Enterprises (Iowa), | ||||||||||
| has a companywide, circulation-weighted Diversity Index of 47. | ||||||||||
| See the notes and definitions section below for the sources of these figures. | ||||||||||
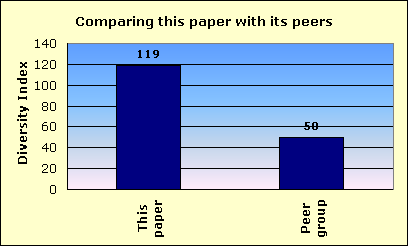
| Peer group comparison | ||||||||||
| for Lincoln Journal Star | ||||||||||
 |
||||||||||
| This newspaper's Newsroom Diversity Index is 119. | This paper | |||||||||
| Peer group | ||||||||||
| Compare that with 50, which is the median Diversity Index for all newspapers | ||||||||||
| reporting in this circulation category of 50,001 to 100,000 daily sales. | ||||||||||
| In that group, this newspaper's Diversity Index ranks 8 out of 90 | ||||||||||
| newspapers reporting in the category of 50,001 to 100,000 daily sales. | ||||||||||
| FYI, in circulation, this newspaper's average weekday circulation of | ||||||||||
| approximately 74,893 ranks 133 out of 1,410 daily newspapers in the US. | ||||||||||
| See the notes and definitions section below for the sources of these figures. | ||||||||||
| Details on race/ethnicity | ||||||||||
| in the circulation area | ||||||||||
| and the home county | ||||||||||
| of Lincoln Journal Star | ||||||||||
| Circulation area | ||||||||||
| Race/ethnicity | % of population | Number of residents | 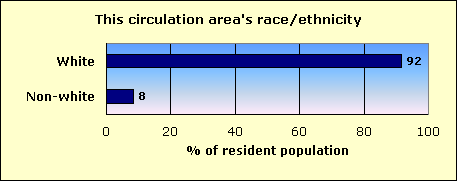
|
|||||||
| Hispanic | 2.7 | 10,950 | ||||||||
| Black | 1.8 | 7,290 | ||||||||
| Asian and Pacific Islander | 2.0 | 7,961 | ||||||||
| Native-American | 0.5 | 1,940 | ||||||||
| Other non-white | 0.1 | 393 | ||||||||
| Multi-racial | 1.2 | 4,861 | ||||||||
| Non-white | 8.4 | 33,395 | ||||||||
| White | 91.7 | 366,603 | ||||||||
| Total | 399,998 | |||||||||
| Home county: Lancaster | ||||||||||
| Race/ethnicity | % of population | Number of residents | 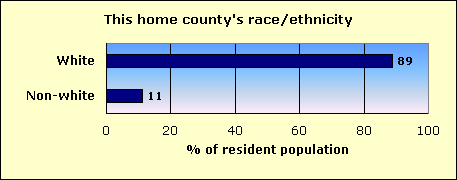
|
|||||||
| Hispanic | 3.4 | 8,437 | ||||||||
| Black | 2.8 | 6,892 | ||||||||
| Asian and Pacific Islander | 2.9 | 7,252 | ||||||||
| Native-American | 0.6 | 1,411 | ||||||||
| Other non-white | 0.1 | 352 | ||||||||
| Multi-racial | 1.6 | 3,880 | ||||||||
| Non-white | 11.3 | 28,224 | ||||||||
| White | 88.7 | 222,067 | ||||||||
| Total | 250,291 | |||||||||
| The home county of this newspaper is Lancaster. | ||||||||||
| About this report | ||||||||||
| This third annual report for the Knight Foundation adds context to an annual survey by the American Society of Newspaper Editors. ASNE has set a goal that | ||||||||||
| every newspaper, to help it know its community and gather the news, should employ at least one non-white journalist, and that newspapers should strive to | ||||||||||
| employ non-whites in proportion to their share of the community. ASNE's report, at www.asne.org, shows each newspaper's non-white employment, but does | ||||||||||
| not disclose how closely that employment mirrors the newspaper's circulation area. | ||||||||||
| That gap is filled by the report you are reading now. This report was not done by ASNE, but was done for the Knight Foundation by Bill Dedman and | ||||||||||
| Stephen K. Doig. It shows how close each newspaper is to ASNE's goal, by comparing the newsroom staffing with the circulation area population. | ||||||||||
| The full report is at www.powerreporting.com/knight. | ||||||||||
| Notes and definitions | ||||||||||
| 1. The Newsroom Diversity Index is the non-white percentage of the newsroom staff divided by the non-white percentage of the circulation area's residents. Parity = 100. | ||||||||||
| 2. Source for staffing: Survey by American Society of Newspaper Editors, April 2005. Newspapers report non-white staff as of the end of the previous year. | ||||||||||
| 3. Following ASNE's definition, newsroom staff includes only supervisors, reporters, editors, copy/layout editors and photographers. | ||||||||||
| 4. Also following ASNE's definition, "whites," "blacks," etc., exclude Hispanics, who are counted in a separate category. | ||||||||||
| 5. Source for boundaries of this newspaper's circulation area: ZIP Code circulation data, Audit Bureau of Circulations, latest available. | ||||||||||
| 6. A paper may define its circulation area differently for marketing efforts, or news coverage, or to set advertising rates. | ||||||||||
| 7. If ZIP Codes or counties are used, this report applies a threshold: 10 percent household penetration is required to include an area in the circulation area. | ||||||||||
| 8. Source for the demographics of residents of that circulation area: US Census 2000. | ||||||||||
| 9. Source for total circulation: Editor & Publisher magazine, Monday-Friday average at year-end 2004. | ||||||||||
| 10. Staff of non-English publications, such as the Miami Herald's El Nuevo Herald, are excluded from the ASNE staffing survey for the first time this year. | ||||||||||
| Demographics of ZIP Codes | ||||||||||
| where sales were reported by | ||||||||||
| Lincoln Journal Star | ||||||||||
| Note that some ZIP Codes listed here may not have been included in determining the newspaper's circulation area. In calculating the Diversity Index, a | ||||||||||
| ZIP Code was included only if the household penetration was at least 10 percent. Any lower-penetration ZIP Codes are also listed here for your information. | ||||||||||
| Also, if the newspaper reported more than 300 ZIP Codes, only the top 300 in weekday sales are listed here. | ||||||||||
| ZIP / City / State / Approx. distance in miles from the newspaper's home office | Weekday sales | Households | Penetration % (daily sales per 100 households) | Median household income | Non-white % of population |
Hispanic % of population |
Black % of population |
Native % of population |
Asian % of population |
|
| 68516 / Lincoln / NE / 7.8 mi. | 7,791 | 11,923 | 65.3 | $64,415 | 6.1 | 1.7 | 1.0 | 0.1 | 2.4 | |
| 68506 / Lincoln / NE / 6.5 mi. | 6,849 | 11,560 | 59.2 | $48,158 | 6.1 | 1.8 | 1.2 | 0.2 | 1.6 | |
| 68510 / Lincoln / NE / 6.2 mi. | 5,317 | 9,565 | 55.6 | $39,366 | 11.7 | 3.4 | 2.7 | 0.4 | 3.2 | |
| 68521 / Lincoln / NE / 3.4 mi. | 4,633 | 9,794 | 47.3 | $42,023 | 13.3 | 3.6 | 2.7 | 0.6 | 4.5 | |
| 68508 / Lincoln / NE / 3.2 mi. | 4,617 | 4,636 | 99.6 | $17,492 | 18.5 | 7.4 | 4.2 | 0.9 | 3.9 | |
| 68502 / Lincoln / NE / 3.8 mi. | 4,521 | 11,527 | 39.2 | $35,627 | 15.1 | 5.4 | 5.1 | 0.9 | 1.8 | |
| 68507 / Lincoln / NE / 7.5 mi. | 3,276 | 5,395 | 60.7 | $45,056 | 6.2 | 2.3 | 1.1 | 0.4 | 1.2 | |
| 68504 / University Place / NE / 5.8 mi. | 3,097 | 6,424 | 48.2 | $30,481 | 11.1 | 3.4 | 3.0 | 0.6 | 2.0 | |
| 68505 / Lincoln / NE / 7.4 mi. | 2,995 | 5,817 | 51.5 | $40,884 | 6.7 | 2.0 | 1.1 | 0.3 | 2.1 | |
| 68512 / Lincoln / NE / 5.9 mi. | 2,172 | 2,848 | 76.3 | $49,406 | 7.3 | 1.9 | 1.6 | 0.2 | 2.5 | |
| 68310 / Rockford / NE / 35.8 mi. | 1,488 | 6,097 | 24.4 | $35,240 | 3.0 | 0.9 | 0.4 | 0.5 | 0.3 | |
| 68434 / Tamora / NE / 16.6 mi. | 1,455 | 2,918 | 49.9 | $44,286 | 2.8 | 1.2 | 0.4 | 0.1 | 0.5 | |
| 68503 / Lincoln / NE / 4.9 mi. | 1,343 | 6,317 | 21.3 | $26,755 | 31.4 | 6.9 | 8.7 | 1.6 | 10.1 | |
| 68522 / Lincoln / NE / 2.8 mi. | 1,312 | 2,667 | 49.2 | $44,948 | 13.5 | 3.5 | 3.4 | 1.1 | 4.0 | |
| 68333 / Kramer / NE / 15.7 mi. | 1,083 | 2,606 | 41.6 | $37,661 | 16.0 | 11.0 | 0.6 | 0.4 | 2.9 | |
| 68528 / Lincoln / NE / 0.6 mi. | 887 | 1,695 | 52.3 | $41,923 | 15.5 | 5.5 | 2.5 | 0.6 | 5.5 | |
| 68467 / York / NE / 39.7 mi. | 777 | 3,801 | 20.4 | $36,806 | 4.8 | 1.8 | 1.3 | 0.3 | 0.6 | |
| 68462 / Waverly / NE / 13.5 mi. | 705 | 1,044 | 67.5 | $51,324 | 2.5 | 1.0 | 0.2 | 0.4 | 0.3 | |
| 68524 / Lincoln / NE / 2.2 mi. | 652 | 1,459 | 44.7 | $43,354 | 19.2 | 5.7 | 7.0 | 1.9 | 1.1 | |
| 68352 / Thompson / NE / 48.1 mi. | 615 | 2,429 | 25.3 | $31,164 | 2.9 | 1.6 | 0.1 | 0.5 | 0.2 | |
| 68526 / Lincoln / NE / 10.7 mi. | 551 | 353 | 156.1 | $71,250 | 2.9 | 1.0 | 0.1 | 0.1 | 0.6 | |
| 68358 / Firth / NE / 20.2 mi. | 520 | 461 | 112.8 | $52,438 | 1.7 | 0.4 | 0.2 | 0.3 | 0.5 | |
| 68405 / Milford / NE / 13.9 mi. | 497 | 1,136 | 43.8 | $40,389 | 2.9 | 1.6 | 0.2 | 0.3 | 0.2 | |
| 68446 / Syracuse / NE / 30.9 mi. | 491 | 1,006 | 48.8 | $39,770 | 1.4 | 0.5 | 0.0 | 0.0 | 0.2 | |
| 68066 / Wahoo / NE / 26.1 mi. | 483 | 1,943 | 24.9 | $36,466 | 1.9 | 0.7 | 0.1 | 0.3 | 0.3 | |
| 68361 / Geneva / NE / 44.5 mi. | 420 | 1,102 | 38.1 | $34,534 | 3.6 | 2.1 | 0.4 | 0.6 | 0.0 | |
| 68901 / West Blue / NE / 80.4 mi. | 417 | 10,378 | 4.0 | $36,886 | 8.8 | 5.2 | 0.7 | 0.4 | 1.9 | |
| 68465 / Wilber / NE / 23.9 mi. | 410 | 927 | 44.2 | $36,364 | 2.7 | 1.7 | 0.0 | 0.0 | 0.7 | |
| 68372 / Holland / NE / 15.3 mi. | 374 | 670 | 55.8 | $49,432 | 2.2 | 0.9 | 0.4 | 0.3 | 0.0 | |
| 68450 / Tecumseh / NE / 40.8 mi. | 359 | 1,016 | 35.3 | $31,135 | 11.4 | 4.9 | 0.1 | 0.3 | 4.5 | |
| 68370 / Hebron / NE / 58 mi. | 347 | 913 | 38.0 | $31,371 | 1.3 | 0.5 | 0.0 | 0.2 | 0.1 | |
| 68347 / Eagle / NE / 16.9 mi. | 339 | 773 | 43.9 | $53,836 | 2.8 | 1.5 | 0.0 | 0.3 | 0.1 | |
| 68410 / Wyoming / NE / 45.7 mi. | 335 | 3,336 | 10.0 | $35,453 | 5.3 | 3.8 | 0.3 | 0.3 | 0.3 | |
| 68359 / Friend / NE / 26.7 mi. | 331 | 656 | 50.5 | $35,600 | 1.5 | 0.8 | 0.0 | 0.2 | 0.0 | |
| 68520 / Lincoln / NE / 9.6 mi. | 317 | 459 | 69.1 | $71,477 | 2.6 | 0.2 | 0.6 | 0.0 | 1.0 | |
| 68632 / Octavia / NE / 32.1 mi. | 310 | 1,503 | 20.6 | $36,078 | 2.6 | 1.8 | 0.0 | 0.2 | 0.3 | |
| 68305 / Rohrs / NE / 53.7 mi. | 308 | 1,836 | 16.8 | $35,203 | 2.7 | 0.8 | 0.3 | 0.2 | 0.9 | |
| 68317 / Bennet / NE / 15.8 mi. | 302 | 505 | 59.8 | $47,455 | 2.5 | 0.8 | 0.1 | 0.0 | 0.5 | |
| 68017 / Ceresco / NE / 16.5 mi. | 284 | 602 | 47.2 | $48,871 | 1.8 | 1.5 | 0.1 | 0.1 | 0.0 | |
| 68430 / Saltillo / NE / 11 mi. | 272 | 434 | 62.7 | $54,375 | 2.2 | 1.2 | 0.1 | 0.1 | 0.2 | |
| 68065 / Valparaiso / NE / 16.7 mi. | 257 | 515 | 49.9 | $44,167 | 3.3 | 1.7 | 0.7 | 0.5 | 0.1 | |
| 68402 / Malcolm / NE / 7.2 mi. | 252 | 386 | 65.3 | $51,953 | 1.3 | 0.2 | 0.0 | 0.5 | 0.4 | |
| 68523 / Rokeby / NE / 5.7 mi. | 248 | 397 | 62.5 | $73,333 | 2.6 | 0.9 | 0.4 | 0.1 | 0.5 | |
| 68003 / Ashland / NE / 24 mi. | 245 | 1,592 | 15.4 | $46,399 | 2.6 | 1.4 | 0.1 | 0.2 | 0.2 | |
| 68428 / Raymond / NE / 9.4 mi. | 232 | 407 | 57.0 | $58,333 | 2.9 | 1.2 | 0.2 | 0.0 | 0.1 | |
| 68355 / Preston / NE / 75.7 mi. | 231 | 2,385 | 9.7 | $30,102 | 4.7 | 0.8 | 0.1 | 2.0 | 0.2 | |
| 68339 / Denton / NE / 6.6 mi. | 208 | 351 | 59.3 | $58,750 | 1.9 | 0.9 | 0.0 | 0.3 | 0.3 | |
| 68301 / Adams / NE / 27 mi. | 204 | 475 | 42.9 | $39,931 | 1.3 | 0.5 | 0.0 | 0.2 | 0.2 | |
| 68601 / Richland / NE / 48.6 mi. | 191 | 10,499 | 1.8 | $40,161 | 9.2 | 7.6 | 0.3 | 0.3 | 0.4 | |
| 68456 / Utica / NE / 28.1 mi. | 179 | 431 | 41.5 | $41,667 | 0.8 | 0.2 | 0.1 | 0.2 | 0.2 | |
| 68343 / Pleasanthill / NE / 20 mi. | 178 | 436 | 40.8 | $34,353 | 3.1 | 2.9 | 0.0 | 0.0 | 0.0 | |
| 68847 / Kearney / NE / 113.1 mi. | 174 | 5,930 | 2.9 | $35,084 | 6.8 | 4.7 | 0.4 | 0.3 | 0.6 | |
| 68025 / Fremont / NE / 42 mi. | 168 | 11,765 | 1.4 | $38,312 | 6.2 | 4.2 | 0.5 | 0.2 | 0.6 | |
| 68418 / Palmyra / NE / 20.2 mi. | 167 | 347 | 48.1 | $43,571 | 3.2 | 2.2 | 0.2 | 0.1 | 0.0 | |
| 68351 / Exeter / NE / 34.8 mi. | 159 | 401 | 39.7 | $38,636 | 2.0 | 1.0 | 0.0 | 0.2 | 0.1 | |
| 68331 / Highland / NE / 20.8 mi. | 157 | 322 | 48.8 | $43,056 | 1.5 | 0.2 | 0.0 | 0.0 | 0.1 | |
| 68423 / Pleasant Dale / NE / 7.8 mi. | 157 | 359 | 43.7 | $50,083 | 2.1 | 0.7 | 0.1 | 0.4 | 0.1 | |
| 68341 / De Witt / NE / 28.6 mi. | 155 | 450 | 34.4 | $40,658 | 1.8 | 0.6 | 0.1 | 0.3 | 0.2 | |
| 68366 / Greenwood / NE / 18.5 mi. | 150 | 383 | 39.2 | $46,029 | 2.7 | 0.9 | 0.2 | 0.7 | 0.3 | |
| 68443 / Sterling / NE / 30.4 mi. | 145 | 393 | 36.9 | $36,902 | 2.2 | 0.6 | 0.2 | 0.3 | 0.2 | |
| 68527 / Prairie Home / NE / 11.8 mi. | 142 | 291 | 48.8 | $67,679 | 1.8 | 0.6 | 0.1 | 0.0 | 0.5 | |
| 68349 / Elmwood / NE / 23.5 mi. | 137 | 414 | 33.1 | $47,105 | 1.0 | 0.3 | 0.1 | 0.1 | 0.3 | |
| 68461 / Walton / NE / 13.6 mi. | 135 | 200 | 67.5 | $56,364 | 3.2 | 0.9 | 0.0 | 0.0 | 1.4 | |
| 68313 / Beaver Crossing / NE / 24.3 mi. | 133 | 375 | 35.5 | $34,083 | 2.7 | 0.4 | 0.8 | 0.8 | 0.1 | |
| 68340 / Deshler / NE / 64.1 mi. | 133 | 473 | 28.1 | $30,682 | 3.1 | 1.6 | 0.0 | 0.5 | 0.4 | |
| 68404 / Princeton / NE / 12.7 mi. | 133 | 390 | 34.1 | $53,250 | 3.0 | 1.6 | 0.1 | 0.3 | 0.2 | |
| 68463 / Weeping Water / NE / 31.2 mi. | 133 | 617 | 21.6 | $44,602 | 1.1 | 0.4 | 0.0 | 0.1 | 0.2 | |
| 68466 / Wymore / NE / 45.6 mi. | 130 | 903 | 14.4 | $29,594 | 3.6 | 1.1 | 0.1 | 1.4 | 0.3 | |
| 68420 / Pawnee City / NE / 55.1 mi. | 129 | 677 | 19.1 | $27,069 | 1.3 | 0.8 | 0.0 | 0.2 | 0.0 | |
| 68979 / Sutton / NE / 54.7 mi. | 126 | 749 | 16.8 | $35,152 | 3.7 | 2.9 | 0.1 | 0.2 | 0.3 | |
| 68371 / Lushton / NE / 50.5 mi. | 121 | 634 | 19.1 | $39,038 | 1.6 | 0.8 | 0.1 | 0.2 | 0.4 | |
| 68376 / Humboldt / NE / 58.7 mi. | 119 | 711 | 16.7 | $31,250 | 3.9 | 1.5 | 0.2 | 1.2 | 0.1 | |
| 68978 / Superior / NE / 81.6 mi. | 115 | 1,134 | 10.1 | $26,936 | 1.4 | 0.9 | 0.0 | 0.0 | 0.2 | |
| 68329 / Cook / NE / 36.3 mi. | 114 | 318 | 35.8 | $33,641 | 2.2 | 0.5 | 0.0 | 0.1 | 1.2 | |
| 68354 / Fairmont / NE / 41.4 mi. | 114 | 415 | 27.5 | $36,339 | 3.4 | 2.0 | 0.1 | 0.3 | 0.1 | |
| 68818 / Stockham / NE / 59.9 mi. | 114 | 2,051 | 5.6 | $38,889 | 2.3 | 1.3 | 0.2 | 0.1 | 0.3 | |
| 68454 / Unadilla / NE / 26.1 mi. | 106 | 268 | 39.6 | $42,188 | 2.3 | 2.0 | 0.0 | 0.3 | 0.0 | |
| 68336 / Davey / NE / 10.5 mi. | 105 | 234 | 44.9 | $60,909 | 4.4 | 3.4 | 0.0 | 0.0 | 0.0 | |
| 68406 / Milligan / NE / 36.5 mi. | 102 | 224 | 45.5 | $26,645 | 1.6 | 0.4 | 0.0 | 0.6 | 0.0 | |
| 68368 / Hallam / NE / 17.1 mi. | 101 | 194 | 52.1 | $44,519 | 5.6 | 1.0 | 0.2 | 1.6 | 2.4 | |
| 68436 / Shickley / NE / 53.4 mi. | 100 | 261 | 38.3 | $43,500 | 1.8 | 1.1 | 0.2 | 0.0 | 0.2 | |
| 68460 / Waco / NE / 33.2 mi. | 100 | 350 | 28.6 | $37,708 | 0.8 | 0.3 | 0.0 | 0.1 | 0.0 | |
| 68424 / Plymouth / NE / 35.2 mi. | 97 | 327 | 29.7 | $39,265 | 0.8 | 0.5 | 0.0 | 0.0 | 0.2 | |
| 68801 / Hall County Regi / NE / 76.4 mi. | 94 | 10,336 | 0.9 | $35,494 | 23.3 | 20.5 | 0.4 | 0.4 | 1.3 | |
| 68635 / Dwight / NE / 19.4 mi. | 93 | 237 | 39.2 | $37,440 | 2.1 | 0.9 | 0.0 | 0.5 | 0.0 | |
| 68464 / Western / NE / 35.4 mi. | 92 | 236 | 39.0 | $34,583 | 2.5 | 0.4 | 0.0 | 0.4 | 0.2 | |
| 68626 / Brainard / NE / 24.5 mi. | 92 | 293 | 31.4 | $34,911 | 1.9 | 1.2 | 0.4 | 0.0 | 0.0 | |
| 68378 / Julian / NE / 46.5 mi. | 89 | 305 | 29.2 | $27,969 | 2.8 | 0.6 | 0.0 | 0.3 | 0.3 | |
| 68803 / Grand Island / NE / 78.3 mi. | 87 | 7,972 | 1.1 | $38,555 | 10.2 | 8.1 | 0.3 | 0.2 | 1.1 | |
| 68322 / Bruning / NE / 49.8 mi. | 85 | 232 | 36.6 | $33,571 | 2.9 | 2.4 | 0.0 | 0.0 | 0.4 | |
| 68532 / Lincoln / NE / 4.3 mi. | 85 | 147 | 57.8 | $70,469 | 1.0 | 0.0 | 0.0 | 0.0 | 0.3 | |
| 68845 / Kearney / NE / 118.3 mi. | 80 | 6,093 | 1.3 | $38,712 | 6.8 | 3.4 | 0.9 | 0.4 | 1.1 | |
| 68338 / Daykin / NE / 41.7 mi. | 77 | 149 | 51.7 | $29,000 | 0.6 | 0.6 | 0.0 | 0.0 | 0.0 | |
| 68360 / Garland / NE / 12.7 mi. | 76 | 187 | 40.6 | $52,500 | 3.4 | 1.4 | 0.0 | 0.0 | 0.2 | |
| 68666 / Stromsburg / NE / 44 mi. | 74 | 659 | 11.2 | $37,794 | 1.1 | 0.5 | 0.0 | 0.1 | 0.1 | |
| 68949 / Sheridan / NE / 129.2 mi. | 74 | 2,740 | 2.7 | $37,160 | 4.1 | 2.8 | 0.1 | 0.3 | 0.3 | |
| 68517 / Lincoln / NE / 10.7 mi. | 72 | 185 | 38.9 | $57,813 | 1.7 | 0.8 | 0.6 | 0.2 | 0.0 | |
| 68328 / Clatonia / NE / 23.4 mi. | 70 | 211 | 33.2 | $38,839 | 2.0 | 0.4 | 0.0 | 0.2 | 0.6 | |
| 68335 / Davenport / NE / 61 mi. | 70 | 268 | 26.1 | $30,104 | 1.5 | 0.6 | 0.0 | 0.0 | 0.0 | |
| 68344 / Douglas / NE / 24.2 mi. | 68 | 159 | 42.8 | $34,844 | 3.3 | 1.2 | 1.4 | 0.0 | 0.2 | |
| 68422 / Pickrell / NE / 27.8 mi. | 67 | 203 | 33.0 | $35,139 | 0.8 | 0.6 | 0.0 | 0.0 | 0.0 | |
| 68439 / Staplehurst / NE / 21.6 mi. | 66 | 206 | 32.0 | $38,958 | 2.7 | 0.4 | 0.0 | 0.0 | 0.2 | |
| 68407 / Wabash / NE / 25 mi. | 64 | 284 | 22.5 | $42,500 | 3.2 | 1.3 | 0.0 | 0.1 | 0.1 | |
| 68669 / Ulysses / NE / 26.1 mi. | 64 | 207 | 30.9 | $37,500 | 3.6 | 1.3 | 0.0 | 0.2 | 0.2 | |
| 68415 / Odell / NE / 50.1 mi. | 60 | 273 | 22.0 | $34,583 | 1.3 | 0.7 | 0.0 | 0.6 | 0.0 | |
| 68453 / Tobias / NE / 38 mi. | 60 | 150 | 40.0 | $31,458 | 1.9 | 0.3 | 0.3 | 0.6 | 0.3 | |
| 68070 / Weston / NE / 22.8 mi. | 59 | 311 | 19.0 | $38,000 | 1.5 | 1.0 | 0.0 | 0.1 | 0.0 | |
| 68447 / Table Rock / NE / 53.3 mi. | 58 | 222 | 26.1 | $27,692 | 2.2 | 1.5 | 0.0 | 0.2 | 0.4 | |
| 68050 / Prague / NE / 30.8 mi. | 54 | 281 | 19.2 | $30,795 | 2.1 | 1.2 | 0.0 | 0.0 | 0.1 | |
| 68357 / Filley / NE / 35.7 mi. | 51 | 184 | 27.7 | $40,357 | 0.9 | 0.9 | 0.0 | 0.0 | 0.0 | |
| 68961 / Nora / NE / 75 mi. | 50 | 390 | 12.8 | $32,305 | 1.6 | 1.3 | 0.0 | 0.0 | 0.0 | |
| 68307 / Avoca / NE / 32.1 mi. | 49 | 231 | 21.2 | $37,813 | 1.5 | 1.2 | 0.0 | 0.2 | 0.2 | |
| 68448 / Talmage / NE / 41.3 mi. | 49 | 176 | 27.8 | $40,250 | 2.0 | 0.2 | 1.8 | 0.0 | 0.0 | |
| 68327 / Chester / NE / 66.8 mi. | 48 | 177 | 27.1 | $22,500 | 1.5 | 0.8 | 0.0 | 0.5 | 0.0 | |
| 68367 / Gresham / NE / 33.6 mi. | 48 | 228 | 21.1 | $36,250 | 0.7 | 0.0 | 0.3 | 0.2 | 0.0 | |
| 68326 / Carleton / NE / 55.2 mi. | 46 | 130 | 35.4 | $41,719 | 0.0 | 0.0 | 0.0 | 0.0 | 0.0 | |
| 68314 / Bee / NE / 18 mi. | 45 | 143 | 31.5 | $42,750 | 1.1 | 0.5 | 0.0 | 0.0 | 0.0 | |
| 68419 / Panama / NE / 19.3 mi. | 45 | 135 | 33.3 | $50,000 | 1.7 | 0.6 | 0.6 | 0.3 | 0.3 | |
| 68348 / Elk Creek / NE / 44.8 mi. | 44 | 143 | 30.8 | $37,500 | 1.8 | 0.3 | 0.3 | 0.6 | 0.0 | |
| 68303 / Alexandria / NE / 47.6 mi. | 43 | 144 | 29.9 | $24,286 | 1.5 | 1.2 | 0.0 | 0.0 | 0.0 | |
| 68337 / Dawson / NE / 64.1 mi. | 43 | 180 | 23.9 | $34,000 | 2.4 | 1.1 | 0.9 | 0.0 | 0.0 | |
| 68324 / Sterling / NE / 29.7 mi. | 42 | 88 | 47.7 | $27,778 | 1.1 | 0.0 | 0.0 | 0.0 | 1.1 | |
| 68651 / Osceola / NE / 47.3 mi. | 41 | 612 | 6.7 | $37,773 | 0.7 | 0.3 | 0.0 | 0.2 | 0.0 | |
| 68944 / Harvard / NE / 65.7 mi. | 41 | 505 | 8.1 | $29,630 | 10.8 | 9.8 | 0.0 | 0.5 | 0.1 | |
| 68325 / Byron / NE / 69.5 mi. | 40 | 116 | 34.5 | $37,500 | 2.1 | 0.4 | 0.0 | 0.7 | 0.0 | |
| 68959 / South Minden / NE / 108.3 mi. | 40 | 1,650 | 2.4 | $40,273 | 3.0 | 2.1 | 0.1 | 0.1 | 0.2 | |
| 68319 / Bradshaw / NE / 47.4 mi. | 39 | 255 | 15.3 | $38,309 | 1.7 | 0.5 | 0.2 | 0.6 | 0.0 | |
| 68401 / McCool Junction / NE / 40.3 mi. | 38 | 271 | 14.0 | $36,731 | 1.8 | 1.6 | 0.0 | 0.0 | 0.2 | |
| 68416 / Ohiowa / NE / 42.5 mi. | 38 | 127 | 29.9 | $26,250 | 6.8 | 5.4 | 0.0 | 0.0 | 0.0 | |
| 68421 / Peru / NE / 55.7 mi. | 37 | 327 | 11.3 | $27,298 | 4.7 | 2.2 | 1.3 | 0.3 | 0.4 | |
| 68316 / Benedict / NE / 41.9 mi. | 34 | 204 | 16.7 | $42,159 | 4.3 | 1.0 | 1.9 | 1.0 | 0.0 | |
| 68304 / Alvo / NE / 19.3 mi. | 33 | 141 | 23.4 | $45,972 | 2.7 | 1.9 | 0.0 | 0.0 | 0.0 | |
| 68330 / Cordova / NE / 28.9 mi. | 33 | 58 | 56.9 | $33,750 | 0.0 | 0.0 | 0.0 | 0.0 | 0.0 | |
| 68364 / Goehner / NE / 20.8 mi. | 33 | 75 | 44.0 | $42,143 | 0.5 | 0.0 | 0.0 | 0.0 | 0.5 | |
| 68658 / Rising City / NE / 35 mi. | 33 | 283 | 11.7 | $35,938 | 1.5 | 1.2 | 0.0 | 0.0 | 0.0 | |
| 68014 / Bruno / NE / 29.8 mi. | 32 | 118 | 27.1 | $31,563 | 0.7 | 0.0 | 0.0 | 0.0 | 0.0 | |
| 68138 / Omaha / NE / 38.7 mi. | 32 | 4,135 | 0.8 | $60,219 | 6.0 | 2.8 | 0.7 | 0.3 | 1.0 | |
| 68346 / Dunbar / NE / 39.1 mi. | 32 | 239 | 13.4 | $45,688 | 2.0 | 0.2 | 0.2 | 0.6 | 0.2 | |
| 68377 / Jansen / NE / 40.9 mi. | 32 | 202 | 15.8 | $32,361 | 1.4 | 1.0 | 0.0 | 0.0 | 0.4 | |
| 68624 / Bellwood / NE / 40.9 mi. | 32 | 399 | 8.0 | $35,781 | 1.2 | 0.8 | 0.1 | 0.0 | 0.3 | |
| 68137 / Omaha / NE / 40.3 mi. | 31 | 9,351 | 0.3 | $58,173 | 6.5 | 2.7 | 1.2 | 0.2 | 1.4 | |
| 68318 / Blue Springs / NE / 44.6 mi. | 31 | 248 | 12.5 | $29,479 | 3.6 | 0.2 | 0.0 | 2.2 | 0.3 | |
| 68662 / Shelby / NE / 42.9 mi. | 30 | 467 | 6.4 | $39,342 | 2.1 | 1.1 | 0.1 | 0.0 | 0.3 | |
| 68320 / Brock / NE / 45.8 mi. | 29 | 210 | 13.8 | $30,167 | 2.9 | 1.0 | 0.0 | 0.4 | 0.2 | |
| 68843 / Hampton / NE / 54.2 mi. | 28 | 330 | 8.5 | $45,536 | 1.3 | 0.1 | 0.2 | 0.3 | 0.1 | |
| 68417 / Otoe / NE / 32.6 mi. | 27 | 119 | 22.7 | $35,125 | 1.0 | 0.3 | 0.0 | 0.0 | 0.0 | |
| 68850 / Lexington / NE / 144.8 mi. | 27 | 3,802 | 0.7 | $38,304 | 47.6 | 45.2 | 0.3 | 0.7 | 1.0 | |
| 68323 / Burchard / NE / 51.7 mi. | 26 | 143 | 18.2 | $28,409 | 2.1 | 0.0 | 0.0 | 0.3 | 1.2 | |
| 68342 / Diller / NE / 46.6 mi. | 26 | 252 | 10.3 | $37,167 | 1.7 | 1.4 | 0.0 | 0.0 | 0.0 | |
| 68345 / Dubois / NE / 62.2 mi. | 26 | 103 | 25.2 | $31,250 | 1.3 | 0.0 | 0.0 | 0.0 | 0.0 | |
| 68957 / St Stephens / NE / 79.2 mi. | 25 | 263 | 9.5 | $28,571 | 1.2 | 0.8 | 0.0 | 0.0 | 0.0 | |
| 68365 / Grafton / NE / 47.5 mi. | 24 | 109 | 22.0 | $28,333 | 1.8 | 1.4 | 0.0 | 0.0 | 0.0 | |
| 68127 / Ralston / NE / 42.8 mi. | 23 | 9,982 | 0.2 | $45,141 | 11.8 | 5.1 | 2.3 | 0.3 | 3.0 | |
| 68028 / Gretna / NE / 32.3 mi. | 22 | 1,749 | 1.3 | $57,766 | 2.2 | 0.9 | 0.1 | 0.3 | 0.2 | |
| 68445 / Swanton / NE / 31.6 mi. | 22 | 84 | 26.2 | $24,091 | 0.0 | 0.0 | 0.0 | 0.0 | 0.0 | |
| 68826 / Riverside Park / NE / 62.4 mi. | 20 | 1,550 | 1.3 | $34,831 | 2.1 | 1.0 | 0.3 | 0.1 | 0.3 | |
| 68114 / Omaha / NE / 45.3 mi. | 19 | 8,256 | 0.2 | $41,851 | 9.4 | 2.0 | 3.2 | 0.3 | 2.9 | |
| 68836 / Elm Creek / NE / 127.1 mi. | 19 | 660 | 2.9 | $36,875 | 3.6 | 2.4 | 0.0 | 0.1 | 0.7 | |
| 68933 / Marshall / NE / 65.4 mi. | 18 | 427 | 4.2 | $37,313 | 4.6 | 2.9 | 0.2 | 0.2 | 0.7 | |
| 68970 / Red Cloud / NE / 97 mi. | 18 | 689 | 2.6 | $29,231 | 2.8 | 0.7 | 0.1 | 0.0 | 0.9 | |
| 68661 / Schuyler / NE / 42.6 mi. | 15 | 2,247 | 0.7 | $37,699 | 39.9 | 39.0 | 0.1 | 0.2 | 0.2 | |
| 68058 / South Bend / NE / 28.2 mi. | 14 | 32 | 43.8 | $41,250 | 11.1 | 2.5 | 0.0 | 0.0 | 0.0 | |
| 68935 / Sedan / NE / 65.4 mi. | 11 | 343 | 3.2 | $31,957 | 2.3 | 0.9 | 0.4 | 0.9 | 0.1 | |
| 69101 / North Platte / NE / 195.5 mi. | 11 | 11,658 | 0.1 | $36,346 | 8.1 | 5.9 | 0.6 | 0.4 | 0.4 | |
| 68701 / Norfolk / NE / 83.9 mi. | 9 | 11,698 | 0.1 | $36,179 | 10.3 | 6.9 | 1.1 | 1.2 | 0.4 | |
| 68939 / Macon / NE / 116.6 mi. | 8 | 553 | 1.4 | $28,600 | 1.2 | 0.8 | 0.0 | 0.3 | 0.1 | |
| 69138 / Gothenburg / NE / 165 mi. | 8 | 1,802 | 0.4 | $36,121 | 4.8 | 3.6 | 0.4 | 0.3 | 0.2 | |
| 69001 / McCook / NE / 194.6 mi. | 4 | 3,960 | 0.1 | $32,222 | 3.9 | 2.6 | 0.1 | 0.3 | 0.2 | |
| 69022 / Cambridge / NE / 169.8 mi. | 3 | 698 | 0.4 | $33,333 | 1.6 | 0.9 | 0.1 | 0.2 | 0.1 | |
| 68362 / Gilead / NE / 54.1 mi. | 2 | 25 | 8.0 | $25,833 | 0.0 | 0.0 | 0.0 | 0.0 | 0.0 | |
| File | ne_lincoln_journal_star | |||||||||
| Time | 5/20/05 3:43 PM | |||||||||
| Page | 133 | |||||||||
| Member | 126150 | |||||||||