
|
| Comparing the racial diversity of the journalists | ||||||||||
| at America's daily newspapers | ||||||||||
| with the communities that they serve | ||||||||||
| Newsroom diversity report for | ||||||||||
| Times-News, Burlington | ||||||||||
| Burlington, North Carolina | ||||||||||
| Owner: Freedom Communications (Ca.) | ||||||||||
| From a report for the Knight Foundation | ||||||||||
| by Bill Dedman and Stephen K. Doig, June 2005 | ||||||||||
| Click here to read the national report or to select another newspaper | ||||||||||
| Year | Non-white % of newsroom staff | 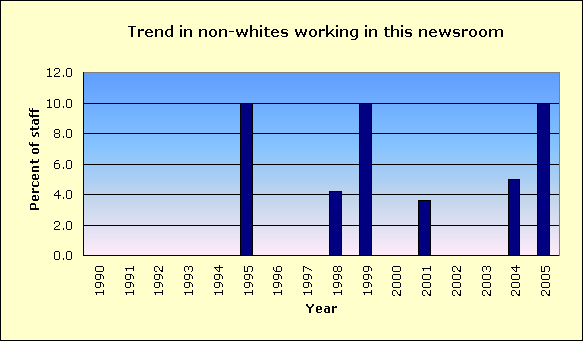
|
||||||||
| 2005 | 10.0 | |||||||||
| 2004 | 5.0 | |||||||||
| 2003 | 0.0 | |||||||||
| 2002 | 0.0 | |||||||||
| 2001 | 3.6 | |||||||||
| 2000 | Did not report | |||||||||
| 1999 | 10.0 | |||||||||
| 1998 | 4.2 | |||||||||
| 1997 | Did not report | |||||||||
| 1996 | Did not report | |||||||||
| 1995 | 10.0 | |||||||||
| 1994 | Did not report | |||||||||
| 1993 | Did not report | |||||||||
| 1992 | Did not report | |||||||||
| 1991 | Did not report | |||||||||
| 1990 | Did not report | |||||||||
| The latest year at peak is | 2005 | |||||||||
| See the notes and definitions section below for the sources of these figures. | ||||||||||
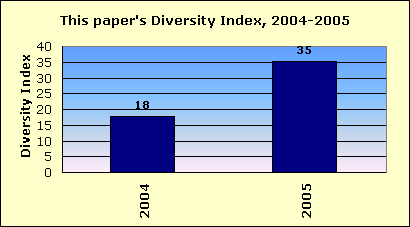
| Newsroom Diversity Index | ||||||||||
| for Times-News, Burlington | ||||||||||
 |
||||||||||
| Year | Non-white % of newsroom staff | Non-white % of circulation area | Newsroom Diversity Index (parity=100) | |||||||
| 2005 | 10.0 | 28.3 | 35 | |||||||
| 2004 | 5.0 | 28.1 | 18 | |||||||
| How the index is calculated | ||||||||||
| The Newsroom Diversity Index is the non-white percentage of the newsroom staff | ||||||||||
| divided by the non-white percentage of residents in the circulation area. | ||||||||||
| (Parity = 100.) | ||||||||||
| Company index | ||||||||||
| This newspaper's owner, Freedom Communications (Ca.), | ||||||||||
| has a companywide, circulation-weighted Diversity Index of 59. | ||||||||||
| See the notes and definitions section below for the sources of these figures. | ||||||||||
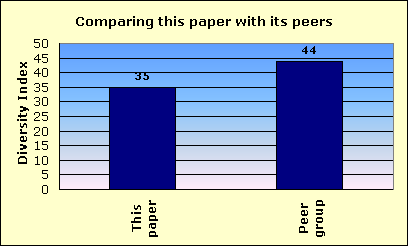
| Peer group comparison | ||||||||||
| for Times-News, Burlington | ||||||||||
 |
||||||||||
| This newspaper's Newsroom Diversity Index is 35. | This paper | |||||||||
| Peer group | ||||||||||
| Compare that with 44, which is the median Diversity Index for all newspapers | ||||||||||
| reporting in this circulation category of 25,001 to 50,000 daily sales. | ||||||||||
| In that group, this newspaper's Diversity Index ranks 89 out of 140 | ||||||||||
| newspapers reporting in the category of 25,001 to 50,000 daily sales. | ||||||||||
| An example of a newspaper of similar circulation, in an area of similar level of non-white residents, but one that has a relatively high Diversity Index, is Longview News-Journal, Texas, with a 23.1 percent non-white staff in a community that is 28.4 percent non-white. Its index is 81. | ||||||||||
| FYI, in circulation, this newspaper's average weekday circulation of | ||||||||||
| approximately 26,412 ranks 387 out of 1,410 daily newspapers in the US. | ||||||||||
| See the notes and definitions section below for the sources of these figures. | ||||||||||
| Details on race/ethnicity | ||||||||||
| in the circulation area | ||||||||||
| and the home county | ||||||||||
| of Times-News, Burlington | ||||||||||
| Circulation area | ||||||||||
| Race/ethnicity | % of population | Number of residents | 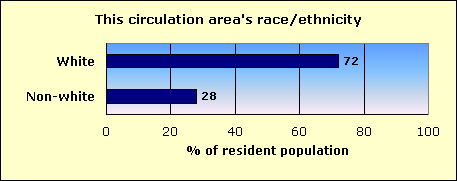
|
|||||||
| Hispanic | 6.1 | 9,675 | ||||||||
| Black | 20.0 | 31,915 | ||||||||
| Asian and Pacific Islander | 0.8 | 1,225 | ||||||||
| Native-American | 0.3 | 478 | ||||||||
| Other non-white | 0.1 | 160 | ||||||||
| Multi-racial | 0.9 | 1,441 | ||||||||
| Non-white | 28.1 | 44,894 | ||||||||
| White | 71.9 | 115,063 | ||||||||
| Total | 159,957 | |||||||||
| Home county: Alamance | ||||||||||
| Race/ethnicity | % of population | Number of residents | 
|
|||||||
| Hispanic | 6.8 | 8,835 | ||||||||
| Black | 18.6 | 24,356 | ||||||||
| Asian and Pacific Islander | 0.9 | 1,167 | ||||||||
| Native-American | 0.3 | 388 | ||||||||
| Other non-white | 0.1 | 131 | ||||||||
| Multi-racial | 0.9 | 1,155 | ||||||||
| Non-white | 27.6 | 36,032 | ||||||||
| White | 72.5 | 94,768 | ||||||||
| Total | 130,800 | |||||||||
| The home county of this newspaper is Alamance. | ||||||||||
| About this report | ||||||||||
| This third annual report for the Knight Foundation adds context to an annual survey by the American Society of Newspaper Editors. ASNE has set a goal that | ||||||||||
| every newspaper, to help it know its community and gather the news, should employ at least one non-white journalist, and that newspapers should strive to | ||||||||||
| employ non-whites in proportion to their share of the community. ASNE's report, at www.asne.org, shows each newspaper's non-white employment, but does | ||||||||||
| not disclose how closely that employment mirrors the newspaper's circulation area. | ||||||||||
| That gap is filled by the report you are reading now. This report was not done by ASNE, but was done for the Knight Foundation by Bill Dedman and | ||||||||||
| Stephen K. Doig. It shows how close each newspaper is to ASNE's goal, by comparing the newsroom staffing with the circulation area population. | ||||||||||
| The full report is at www.powerreporting.com/knight. | ||||||||||
| Notes and definitions | ||||||||||
| 1. The Newsroom Diversity Index is the non-white percentage of the newsroom staff divided by the non-white percentage of the circulation area's residents. Parity = 100. | ||||||||||
| 2. Source for staffing: Survey by American Society of Newspaper Editors, April 2005. Newspapers report non-white staff as of the end of the previous year. | ||||||||||
| 3. Following ASNE's definition, newsroom staff includes only supervisors, reporters, editors, copy/layout editors and photographers. | ||||||||||
| 4. Also following ASNE's definition, "whites," "blacks," etc., exclude Hispanics, who are counted in a separate category. | ||||||||||
| 5. Source for boundaries of this newspaper's circulation area: ZIP Code circulation data, Audit Bureau of Circulations, latest available. | ||||||||||
| 6. A paper may define its circulation area differently for marketing efforts, or news coverage, or to set advertising rates. | ||||||||||
| 7. If ZIP Codes or counties are used, this report applies a threshold: 10 percent household penetration is required to include an area in the circulation area. | ||||||||||
| 8. Source for the demographics of residents of that circulation area: US Census 2000. | ||||||||||
| 9. Source for total circulation: Editor & Publisher magazine, Monday-Friday average at year-end 2004. | ||||||||||
| 10. Staff of non-English publications, such as the Miami Herald's El Nuevo Herald, are excluded from the ASNE staffing survey for the first time this year. | ||||||||||
| Demographics of ZIP Codes | ||||||||||
| where sales were reported by | ||||||||||
| Times-News, Burlington | ||||||||||
| Note that some ZIP Codes listed here may not have been included in determining the newspaper's circulation area. In calculating the Diversity Index, a | ||||||||||
| ZIP Code was included only if the household penetration was at least 10 percent. Any lower-penetration ZIP Codes are also listed here for your information. | ||||||||||
| Also, if the newspaper reported more than 300 ZIP Codes, only the top 300 in weekday sales are listed here. | ||||||||||
| ZIP / City / State / Approx. distance in miles from the newspaper's home office | Weekday sales | Households | Penetration % (daily sales per 100 households) | Median household income | Non-white % of population |
Hispanic % of population |
Black % of population |
Native % of population |
Asian % of population |
|
| 27215 / Glen Raven / NC / 2.2 mi. | 8,775 | 14,367 | 61.1 | $41,858 | 19.4 | 5.5 | 11.1 | 0.2 | 1.6 | |
| 27217 / Green Level / NC / 2.9 mi. | 5,159 | 13,040 | 39.6 | $32,785 | 47.7 | 10.6 | 34.7 | 0.4 | 0.8 | |
| 27253 / Graham / NC / 4.5 mi. | 4,464 | 10,108 | 44.2 | $38,848 | 25.6 | 8.8 | 15.1 | 0.3 | 0.6 | |
| 27302 / Mebane / NC / 6.6 mi. | 2,984 | 8,549 | 34.9 | $41,171 | 26.1 | 3.9 | 20.3 | 0.3 | 0.4 | |
| 27244 / Stonycreek / NC / 5.9 mi. | 1,730 | 3,429 | 50.5 | $41,515 | 14.9 | 1.8 | 11.7 | 0.1 | 0.8 | |
| 27249 / Gibsonville / NC / 9.6 mi. | 1,161 | 4,139 | 28.1 | $45,866 | 20.2 | 2.8 | 15.5 | 0.3 | 0.4 | |
| 27258 / Haw River / NC / 4 mi. | 984 | 2,052 | 48.0 | $39,769 | 23.5 | 4.5 | 17.1 | 0.6 | 0.2 | |
| 27349 / Snow Camp / NC / 10.8 mi. | 627 | 1,848 | 33.9 | $40,902 | 11.7 | 2.4 | 7.9 | 0.2 | 0.2 | |
| 27379 / Yanceyville / NC / 21.1 mi. | 358 | 1,940 | 18.5 | $31,703 | 53.5 | 1.7 | 50.4 | 0.3 | 0.2 | |
| 27298 / Liberty / NC / 12.9 mi. | 248 | 3,724 | 6.7 | $41,006 | 18.0 | 6.4 | 10.1 | 0.4 | 0.2 | |
| 27377 / Whitsett / NC / 10.3 mi. | 234 | 1,587 | 14.7 | $45,556 | 12.0 | 1.3 | 9.3 | 0.4 | 0.2 | |
| 27243 / Efland / NC / 10.9 mi. | 124 | 1,271 | 9.8 | $40,625 | 18.8 | 4.2 | 12.9 | 0.3 | 0.3 | |
| 27314 / Prospect Hill / NC / 17.7 mi. | 82 | 271 | 30.3 | $34,464 | 15.7 | 1.7 | 12.9 | 0.6 | 0.0 | |
| 27320 / Reidsville / NC / 21.9 mi. | 64 | 15,458 | 0.4 | $34,345 | 30.8 | 3.1 | 26.3 | 0.3 | 0.3 | |
| 27231 / Cedar Grove / NC / 14.7 mi. | 62 | 740 | 8.4 | $49,028 | 37.6 | 5.3 | 30.7 | 0.8 | 0.2 | |
| 27291 / Osmond / NC / 24.3 mi. | 43 | 781 | 5.5 | $36,216 | 27.5 | 0.9 | 26.0 | 0.2 | 0.1 | |
| 27312 / Pittsboro / NC / 25 mi. | 28 | 5,149 | 0.5 | $47,611 | 25.1 | 3.3 | 19.9 | 0.3 | 0.5 | |
| File | nc_times-news__burlington | |||||||||
| Time | 5/21/05 8:34 AM | |||||||||
| Page | 387 | |||||||||
| Member | 110500 | |||||||||