
|
| Comparing the racial diversity of the journalists | ||||||||||
| at America's daily newspapers | ||||||||||
| with the communities that they serve | ||||||||||
| Newsroom diversity report for | ||||||||||
| The Daily News, Jacksonville | ||||||||||
| Jacksonville, North Carolina | ||||||||||
| Owner: Freedom Communications (Ca.) | ||||||||||
| From a report for the Knight Foundation | ||||||||||
| by Bill Dedman and Stephen K. Doig, June 2005 | ||||||||||
| Click here to read the national report or to select another newspaper | ||||||||||
| Year | Non-white % of newsroom staff | 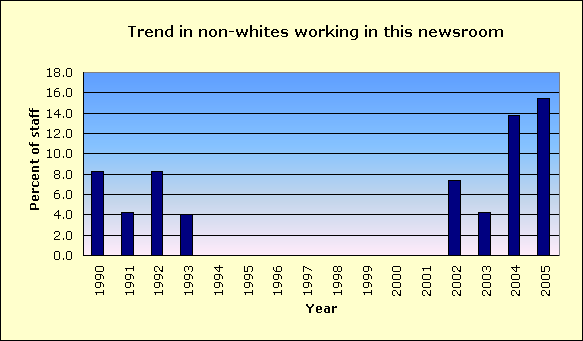
|
||||||||
| 2005 | 15.4 | |||||||||
| 2004 | 13.8 | |||||||||
| 2003 | 4.2 | |||||||||
| 2002 | 7.4 | |||||||||
| 2001 | 0.0 | |||||||||
| 2000 | 0.0 | |||||||||
| 1999 | Did not report | |||||||||
| 1998 | Did not report | |||||||||
| 1997 | Did not report | |||||||||
| 1996 | Did not report | |||||||||
| 1995 | Did not report | |||||||||
| 1994 | Did not report | |||||||||
| 1993 | 4.0 | |||||||||
| 1992 | 8.3 | |||||||||
| 1991 | 4.2 | |||||||||
| 1990 | 8.3 | |||||||||
| The latest year at peak is | 2005 | |||||||||
| See the notes and definitions section below for the sources of these figures. | ||||||||||
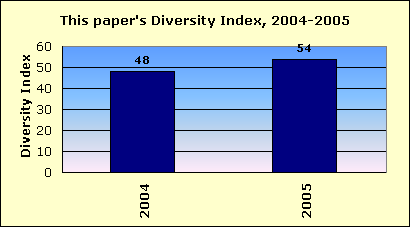
| Newsroom Diversity Index | ||||||||||
| for The Daily News, Jacksonville | ||||||||||
 |
||||||||||
| Year | Non-white % of newsroom staff | Non-white % of circulation area | Newsroom Diversity Index (parity=100) | |||||||
| 2005 | 15.4 | 28.7 | 54 | |||||||
| 2004 | 13.8 | 28.7 | 48 | |||||||
| How the index is calculated | ||||||||||
| The Newsroom Diversity Index is the non-white percentage of the newsroom staff | ||||||||||
| divided by the non-white percentage of residents in the circulation area. | ||||||||||
| (Parity = 100.) | ||||||||||
| Company index | ||||||||||
| This newspaper's owner, Freedom Communications (Ca.), | ||||||||||
| has a companywide, circulation-weighted Diversity Index of 59. | ||||||||||
| See the notes and definitions section below for the sources of these figures. | ||||||||||
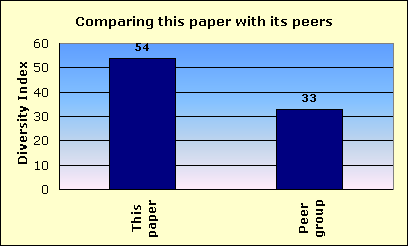
| Peer group comparison | ||||||||||
| for The Daily News, Jacksonville | ||||||||||
 |
||||||||||
| This newspaper's Newsroom Diversity Index is 54. | This paper | |||||||||
| Peer group | ||||||||||
| Compare that with 33, which is the median Diversity Index for all newspapers | ||||||||||
| reporting in this circulation category of 10,001 to 25,000 daily sales. | ||||||||||
| In that group, this newspaper's Diversity Index ranks 78 out of 259 | ||||||||||
| newspapers reporting in the category of 10,001 to 25,000 daily sales. | ||||||||||
| An example of a newspaper of similar circulation, in an area of similar level of non-white residents, but one that has a relatively high Diversity Index, is Greeley Tribune, Colorado, with a 26.3 percent non-white staff in a community that is 30 percent non-white. Its index is 88. | ||||||||||
| FYI, in circulation, this newspaper's average weekday circulation of | ||||||||||
| approximately 21,759 ranks 443 out of 1,410 daily newspapers in the US. | ||||||||||
| See the notes and definitions section below for the sources of these figures. | ||||||||||
| Details on race/ethnicity | ||||||||||
| in the circulation area | ||||||||||
| and the home county | ||||||||||
| of The Daily News, Jacksonville | ||||||||||
| Circulation area | ||||||||||
| Race/ethnicity | % of population | Number of residents | 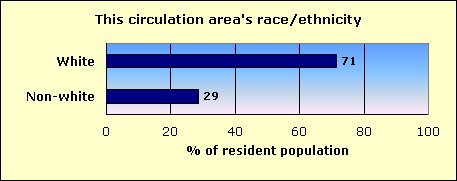
|
|||||||
| Hispanic | 6.4 | 10,594 | ||||||||
| Black | 17.6 | 29,000 | ||||||||
| Asian and Pacific Islander | 1.7 | 2,714 | ||||||||
| Native-American | 0.6 | 986 | ||||||||
| Other non-white | 0.2 | 349 | ||||||||
| Multi-racial | 2.1 | 3,457 | ||||||||
| Non-white | 28.7 | 47,100 | ||||||||
| White | 71.4 | 117,300 | ||||||||
| Total | 164,400 | |||||||||
| Home county: Onslow | ||||||||||
| Race/ethnicity | % of population | Number of residents | 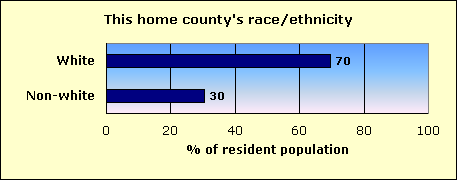
|
|||||||
| Hispanic | 7.3 | 10,896 | ||||||||
| Black | 18.1 | 27,162 | ||||||||
| Asian and Pacific Islander | 1.8 | 2,713 | ||||||||
| Native-American | 0.7 | 971 | ||||||||
| Other non-white | 0.2 | 355 | ||||||||
| Multi-racial | 2.4 | 3,658 | ||||||||
| Non-white | 30.4 | 45,755 | ||||||||
| White | 69.6 | 104,600 | ||||||||
| Total | 150,355 | |||||||||
| The home county of this newspaper is Onslow. | ||||||||||
| About this report | ||||||||||
| This third annual report for the Knight Foundation adds context to an annual survey by the American Society of Newspaper Editors. ASNE has set a goal that | ||||||||||
| every newspaper, to help it know its community and gather the news, should employ at least one non-white journalist, and that newspapers should strive to | ||||||||||
| employ non-whites in proportion to their share of the community. ASNE's report, at www.asne.org, shows each newspaper's non-white employment, but does | ||||||||||
| not disclose how closely that employment mirrors the newspaper's circulation area. | ||||||||||
| That gap is filled by the report you are reading now. This report was not done by ASNE, but was done for the Knight Foundation by Bill Dedman and | ||||||||||
| Stephen K. Doig. It shows how close each newspaper is to ASNE's goal, by comparing the newsroom staffing with the circulation area population. | ||||||||||
| The full report is at www.powerreporting.com/knight. | ||||||||||
| Notes and definitions | ||||||||||
| 1. The Newsroom Diversity Index is the non-white percentage of the newsroom staff divided by the non-white percentage of the circulation area's residents. Parity = 100. | ||||||||||
| 2. Source for staffing: Survey by American Society of Newspaper Editors, April 2005. Newspapers report non-white staff as of the end of the previous year. | ||||||||||
| 3. Following ASNE's definition, newsroom staff includes only supervisors, reporters, editors, copy/layout editors and photographers. | ||||||||||
| 4. Also following ASNE's definition, "whites," "blacks," etc., exclude Hispanics, who are counted in a separate category. | ||||||||||
| 5. Source for boundaries of this newspaper's circulation area: ZIP Code circulation data, Audit Bureau of Circulations, latest available. | ||||||||||
| 6. A paper may define its circulation area differently for marketing efforts, or news coverage, or to set advertising rates. | ||||||||||
| 7. If ZIP Codes or counties are used, this report applies a threshold: 10 percent household penetration is required to include an area in the circulation area. | ||||||||||
| 8. Source for the demographics of residents of that circulation area: US Census 2000. | ||||||||||
| 9. Source for total circulation: Editor & Publisher magazine, Monday-Friday average at year-end 2004. | ||||||||||
| 10. Staff of non-English publications, such as the Miami Herald's El Nuevo Herald, are excluded from the ASNE staffing survey for the first time this year. | ||||||||||
| Demographics of ZIP Codes | ||||||||||
| where sales were reported by | ||||||||||
| The Daily News, Jacksonville | ||||||||||
| Note that some ZIP Codes listed here may not have been included in determining the newspaper's circulation area. In calculating the Diversity Index, a | ||||||||||
| ZIP Code was included only if the household penetration was at least 10 percent. Any lower-penetration ZIP Codes are also listed here for your information. | ||||||||||
| Also, if the newspaper reported more than 300 ZIP Codes, only the top 300 in weekday sales are listed here. | ||||||||||
| ZIP / City / State / Approx. distance in miles from the newspaper's home office | Weekday sales | Households | Penetration % (daily sales per 100 households) | Median household income | Non-white % of population |
Hispanic % of population |
Black % of population |
Native % of population |
Asian % of population |
|
| 28540 / Jacksonville / NC / 0 mi. | 6,563 | 15,860 | 41.4 | $32,602 | 33.2 | 6.3 | 21.8 | 0.6 | 1.9 | |
| 28546 / Jacksonville / NC / 13.1 mi. | 4,725 | 11,349 | 41.6 | $37,546 | 38.1 | 7.6 | 24.0 | 0.5 | 3.0 | |
| 28574 / Richlands / NC / 13.9 mi. | 1,502 | 3,784 | 39.7 | $31,523 | 16.2 | 4.1 | 9.8 | 0.5 | 0.3 | |
| 28539 / Hubert / NC / 14.8 mi. | 1,422 | 4,506 | 31.6 | $35,501 | 17.7 | 4.2 | 8.2 | 0.7 | 1.5 | |
| 28584 / Swansboro / NC / 21.8 mi. | 1,245 | 3,341 | 37.3 | $39,306 | 6.0 | 2.1 | 1.9 | 0.4 | 0.7 | |
| 28460 / Sneads Ferry / NC / 10.7 mi. | 894 | 2,273 | 39.3 | $36,434 | 8.8 | 1.6 | 4.3 | 0.5 | 0.9 | |
| 28547 / Camp Lejeune / NC / 9.1 mi. | 874 | 1,439 | 60.7 | $42,515 | 33.7 | 12.5 | 16.1 | 0.9 | 1.9 | |
| 28594 / Emerald Isle / NC / 28.1 mi. | 514 | 1,651 | 31.1 | $53,125 | 4.4 | 1.6 | 0.8 | 0.4 | 0.7 | |
| 28544 / Midway Park / NC / 12.9 mi. | 485 | 2,355 | 20.6 | $26,792 | 42.6 | 10.3 | 26.0 | 0.9 | 1.9 | |
| 28570 / Newport / NC / 35.5 mi. | 475 | 6,994 | 6.8 | $38,412 | 11.0 | 2.4 | 6.0 | 0.6 | 0.7 | |
| 28555 / Maysville / NC / 21 mi. | 470 | 1,714 | 27.4 | $31,164 | 32.9 | 2.6 | 28.1 | 0.3 | 0.5 | |
| 28557 / Morehead City / NC / 43.6 mi. | 405 | 5,809 | 7.0 | $37,615 | 14.4 | 1.7 | 10.2 | 0.5 | 0.7 | |
| 28445 / Holly Ridge / NC / 13 mi. | 383 | 1,971 | 19.4 | $36,311 | 7.1 | 1.8 | 3.4 | 0.6 | 0.5 | |
| 28518 / Beulaville / NC / 23 mi. | 376 | 2,363 | 15.9 | $31,319 | 26.2 | 7.7 | 17.7 | 0.1 | 0.1 | |
| 28512 / Atlantic Beach / NC / 42.4 mi. | 172 | 1,857 | 9.3 | $43,984 | 2.3 | 0.9 | 0.4 | 0.2 | 0.5 | |
| 28582 / Stella / NC / 23.3 mi. | 170 | 482 | 35.3 | $35,864 | 13.5 | 1.1 | 10.3 | 0.7 | 0.9 | |
| 28521 / Chinquapin / NC / 16.2 mi. | 163 | 800 | 20.4 | $31,987 | 19.6 | 3.3 | 15.7 | 0.3 | 0.0 | |
| 28454 / Maple Hill / NC / 14.8 mi. | 146 | 942 | 15.5 | $30,222 | 48.3 | 1.6 | 45.6 | 0.2 | 0.2 | |
| 28532 / Havelock / NC / 38.1 mi. | 96 | 8,310 | 1.2 | $34,626 | 35.3 | 7.9 | 21.8 | 0.7 | 2.3 | |
| 28585 / Trenton / NC / 27.4 mi. | 94 | 1,658 | 5.7 | $29,655 | 39.2 | 3.1 | 34.8 | 0.2 | 0.1 | |
| 28543 / Tarawa Terrace / NC / 8.2 mi. | 64 | 1,908 | 3.4 | $24,476 | 43.8 | 15.6 | 21.1 | 0.6 | 1.2 | |
| 28572 / Pink Hill / NC / 28.5 mi. | 62 | 2,216 | 2.8 | $32,500 | 18.8 | 8.3 | 9.8 | 0.1 | 0.2 | |
| 28516 / Beaufort / NC / 53.3 mi. | 44 | 4,489 | 1.0 | $34,093 | 18.1 | 2.0 | 14.8 | 0.3 | 0.3 | |
| 28466 / Wallace / NC / 20.8 mi. | 30 | 3,297 | 0.9 | $27,624 | 39.1 | 11.0 | 27.4 | 0.1 | 0.2 | |
| File | nc_the_daily_news__jacksonville | |||||||||
| Time | 5/21/05 10:45 AM | |||||||||
| Page | 443 | |||||||||
| Member | 132850 | |||||||||