
|
| Comparing the racial diversity of the journalists | ||||||||||
| at America's daily newspapers | ||||||||||
| with the communities that they serve | ||||||||||
| Newsroom diversity report for | ||||||||||
| The Clarion-Ledger, Jackson | ||||||||||
| Jackson, Mississippi | ||||||||||
| Owner: Gannett Co. (Va.) | ||||||||||
| From a report for the Knight Foundation | ||||||||||
| by Bill Dedman and Stephen K. Doig, June 2005 | ||||||||||
| Click here to read the national report or to select another newspaper | ||||||||||
| Year | Non-white % of newsroom staff | 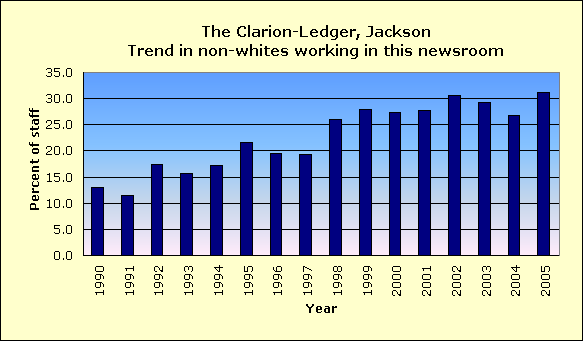
|
||||||||
| 2005 | 31.1 | |||||||||
| 2004 | 26.7 | |||||||||
| 2003 | 29.2 | |||||||||
| 2002 | 30.6 | |||||||||
| 2001 | 27.7 | |||||||||
| 2000 | 27.3 | |||||||||
| 1999 | 28.0 | |||||||||
| 1998 | 26.1 | |||||||||
| 1997 | 19.3 | |||||||||
| 1996 | 19.5 | |||||||||
| 1995 | 21.6 | |||||||||
| 1994 | 17.2 | |||||||||
| 1993 | 15.7 | |||||||||
| 1992 | 17.4 | |||||||||
| 1991 | 11.5 | |||||||||
| 1990 | 13.0 | |||||||||
| The latest year at peak is | 2005 | |||||||||
| See the notes and definitions section below for the sources of these figures. | ||||||||||
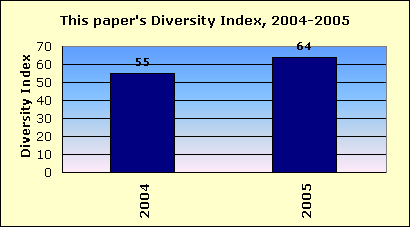
| Newsroom Diversity Index | ||||||||||
| for The Clarion-Ledger, Jackson | ||||||||||
 |
||||||||||
| Year | Non-white % of newsroom staff | Non-white % of circulation area | Newsroom Diversity Index (parity=100) | |||||||
| 2005 | 31.1 | 48.5 | 64 | |||||||
| 2004 | 26.7 | 48.5 | 55 | |||||||
| How the index is calculated | ||||||||||
| The Newsroom Diversity Index is the non-white percentage of the newsroom staff | ||||||||||
| divided by the non-white percentage of residents in the circulation area. | ||||||||||
| (Parity = 100.) | ||||||||||
| Company index | ||||||||||
| This newspaper's owner, Gannett Co. (Va.), | ||||||||||
| has a companywide, circulation-weighted Diversity Index of 89. | ||||||||||
| See the notes and definitions section below for the sources of these figures. | ||||||||||
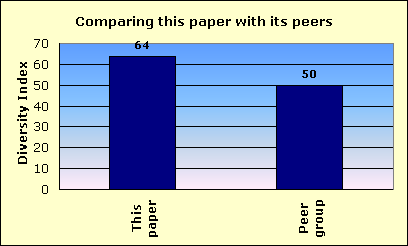
| Peer group comparison | ||||||||||
| for The Clarion-Ledger, Jackson | ||||||||||
 |
||||||||||
| This newspaper's Newsroom Diversity Index is 64. | This paper | |||||||||
| Peer group | ||||||||||
| Compare that with 50, which is the median Diversity Index for all newspapers | ||||||||||
| reporting in this circulation category of 50,001 to 100,000 daily sales. | ||||||||||
| In that group, this newspaper's Diversity Index ranks 32 out of 90 | ||||||||||
| newspapers reporting in the category of 50,001 to 100,000 daily sales. | ||||||||||
| An example of a newspaper of similar circulation, in an area of similar level of non-white residents, but one that has a relatively high Diversity Index, is The Times, Shreveport, Louisiana, with a 31.1 percent non-white staff in a community that is 41.3 percent non-white. Its index is 75. | ||||||||||
| FYI, in circulation, this newspaper's average weekday circulation of | ||||||||||
| approximately 94,938 ranks 110 out of 1,410 daily newspapers in the US. | ||||||||||
| See the notes and definitions section below for the sources of these figures. | ||||||||||
| Details on race/ethnicity | ||||||||||
| in the circulation area | ||||||||||
| and the home county | ||||||||||
| of The Clarion-Ledger, Jackson | ||||||||||
| Circulation area | ||||||||||
| Race/ethnicity | % of population | Number of residents | 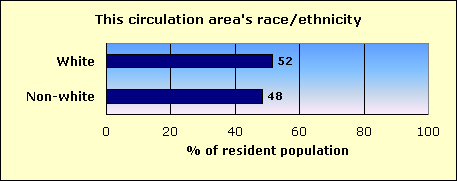
|
|||||||
| Hispanic | 1.3 | 10,726 | ||||||||
| Black | 45.7 | 375,787 | ||||||||
| Asian and Pacific Islander | 0.7 | 5,460 | ||||||||
| Native-American | 0.2 | 1,930 | ||||||||
| Other non-white | 0.0 | 339 | ||||||||
| Multi-racial | 0.5 | 4,187 | ||||||||
| Non-white | 48.5 | 398,429 | ||||||||
| White | 51.5 | 423,627 | ||||||||
| Total | 822,056 | |||||||||
| Home county: Hinds | ||||||||||
| Race/ethnicity | % of population | Number of residents | 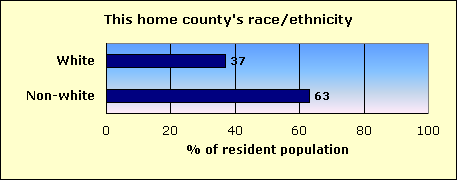
|
|||||||
| Hispanic | 0.8 | 1,978 | ||||||||
| Black | 60.9 | 152,652 | ||||||||
| Asian and Pacific Islander | 0.6 | 1,516 | ||||||||
| Native-American | 0.1 | 280 | ||||||||
| Other non-white | 0.1 | 153 | ||||||||
| Multi-racial | 0.6 | 1,417 | ||||||||
| Non-white | 63.0 | 157,996 | ||||||||
| White | 37.0 | 92,804 | ||||||||
| Total | 250,800 | |||||||||
| The home county of this newspaper is Hinds. | ||||||||||
| About this report | ||||||||||
| This third annual report for the Knight Foundation adds context to an annual survey by the American Society of Newspaper Editors. ASNE has set a goal that | ||||||||||
| every newspaper, to help it know its community and gather the news, should employ at least one non-white journalist, and that newspapers should strive to | ||||||||||
| employ non-whites in proportion to their share of the community. ASNE's report, at www.asne.org, shows each newspaper's non-white employment, but does | ||||||||||
| not disclose how closely that employment mirrors the newspaper's circulation area. | ||||||||||
| That gap is filled by the report you are reading now. This report was not done by ASNE, but was done for the Knight Foundation by Bill Dedman and | ||||||||||
| Stephen K. Doig. It shows how close each newspaper is to ASNE's goal, by comparing the newsroom staffing with the circulation area population. | ||||||||||
| The full report is at www.powerreporting.com/knight. | ||||||||||
| Notes and definitions | ||||||||||
| 1. The Newsroom Diversity Index is the non-white percentage of the newsroom staff divided by the non-white percentage of the circulation area's residents. Parity = 100. | ||||||||||
| 2. Source for staffing: Survey by American Society of Newspaper Editors, April 2005. Newspapers report non-white staff as of the end of the previous year. | ||||||||||
| 3. Following ASNE's definition, newsroom staff includes only supervisors, reporters, editors, copy/layout editors and photographers. | ||||||||||
| 4. Also following ASNE's definition, "whites," "blacks," etc., exclude Hispanics, who are counted in a separate category. | ||||||||||
| 5. Source for boundaries of this newspaper's circulation area: ZIP Code circulation data, Audit Bureau of Circulations, latest available. | ||||||||||
| 6. A paper may define its circulation area differently for marketing efforts, or news coverage, or to set advertising rates. | ||||||||||
| 7. If ZIP Codes or counties are used, this report applies a threshold: 10 percent household penetration is required to include an area in the circulation area. | ||||||||||
| 8. Source for the demographics of residents of that circulation area: US Census 2000. | ||||||||||
| 9. Source for total circulation: Editor & Publisher magazine, Monday-Friday average at year-end 2004. | ||||||||||
| 10. Staff of non-English publications, such as the Miami Herald's El Nuevo Herald, are excluded from the ASNE staffing survey for the first time this year. | ||||||||||
| Demographics of ZIP Codes | ||||||||||
| where sales were reported by | ||||||||||
| The Clarion-Ledger, Jackson | ||||||||||
| Note that some ZIP Codes listed here may not have been included in determining the newspaper's circulation area. In calculating the Diversity Index, a | ||||||||||
| ZIP Code was included only if the household penetration was at least 10 percent. Any lower-penetration ZIP Codes are also listed here for your information. | ||||||||||
| Also, if the newspaper reported more than 300 ZIP Codes, only the top 300 in weekday sales are listed here. | ||||||||||
| ZIP / City / State / Approx. distance in miles from the newspaper's home office | Weekday sales | Households | Penetration % (daily sales per 100 households) | Median household income | Non-white % of population |
Hispanic % of population |
Black % of population |
Native % of population |
Asian % of population |
|
| 39211 / Jackson / MS / 6.6 mi. | 5,908 | 10,592 | 55.8 | $56,621 | 19.9 | 1.0 | 16.7 | 0.1 | 1.5 | |
| 39110 / Madison / MS / 15 mi. | 5,561 | 8,170 | 68.1 | $73,938 | 11.5 | 0.7 | 9.0 | 0.1 | 1.4 | |
| 39056 / Clinton / MS / 11.5 mi. | 4,264 | 8,980 | 47.5 | $47,874 | 26.4 | 0.9 | 23.4 | 0.1 | 1.4 | |
| 39042 / Brandon / MS / 12.6 mi. | 4,234 | 9,995 | 42.4 | $47,853 | 23.5 | 1.2 | 21.3 | 0.2 | 0.4 | |
| 39047 / Brandon / MS / 11.6 mi. | 4,158 | 9,370 | 44.4 | $61,140 | 12.5 | 1.0 | 9.8 | 0.2 | 1.0 | |
| 39157 / Ridgeland / MS / 9.6 mi. | 3,725 | 9,347 | 39.9 | $42,886 | 25.7 | 1.5 | 20.4 | 0.2 | 2.9 | |
| 39212 / Jackson / MS / 7 mi. | 3,366 | 14,050 | 24.0 | $40,705 | 49.6 | 0.8 | 47.5 | 0.1 | 0.5 | |
| 39206 / Jackson / MS / 5.7 mi. | 3,297 | 10,566 | 31.2 | $33,335 | 85.2 | 0.7 | 83.0 | 0.1 | 0.7 | |
| 39208 / Pearl / MS / 5.2 mi. | 3,230 | 11,659 | 27.7 | $37,751 | 22.4 | 1.9 | 18.8 | 0.2 | 0.9 | |
| 39213 / Jackson / MS / 8.9 mi. | 2,609 | 9,558 | 27.3 | $22,470 | 97.4 | 0.5 | 96.3 | 0.1 | 0.2 | |
| 39209 / Jackson / MS / 13.2 mi. | 2,573 | 11,539 | 22.3 | $25,362 | 90.1 | 0.9 | 88.4 | 0.1 | 0.1 | |
| 39204 / Jackson / MS / 3.1 mi. | 1,975 | 7,420 | 26.6 | $23,339 | 75.4 | 0.7 | 73.1 | 0.2 | 0.6 | |
| 39073 / Florence / MS / 11.5 mi. | 1,787 | 6,349 | 28.1 | $40,821 | 17.5 | 0.9 | 15.7 | 0.1 | 0.1 | |
| 39046 / Canton / MS / 26.6 mi. | 1,691 | 7,320 | 23.1 | $29,599 | 76.1 | 1.0 | 74.4 | 0.1 | 0.2 | |
| 39202 / Jackson / MS / 1.8 mi. | 1,666 | 3,981 | 41.8 | $24,935 | 54.1 | 0.9 | 51.4 | 0.2 | 0.7 | |
| 39759 / Starkville / MS / 110.5 mi. | 1,585 | 14,630 | 10.8 | $25,183 | 42.0 | 1.1 | 37.1 | 0.2 | 2.8 | |
| 39216 / Jackson / MS / 3.3 mi. | 1,478 | 1,603 | 92.2 | $28,608 | 39.2 | 0.5 | 35.2 | 0.1 | 2.7 | |
| 39180 / Vicksburg / MS / 39.6 mi. | 1,290 | 12,679 | 10.2 | $36,801 | 43.7 | 1.2 | 41.0 | 0.2 | 0.7 | |
| 39401 / Hattiesburg / MS / 92.5 mi. | 1,290 | 15,432 | 8.4 | $22,831 | 52.4 | 1.3 | 49.3 | 0.2 | 0.7 | |
| 39154 / Raymond / MS / 16 mi. | 1,116 | 3,044 | 36.7 | $45,203 | 31.1 | 0.6 | 29.7 | 0.1 | 0.3 | |
| 39051 / Carthage / MS / 52.1 mi. | 1,083 | 5,586 | 19.4 | $27,689 | 42.6 | 2.6 | 34.4 | 4.9 | 0.2 | |
| 39194 / Yazoo City / MS / 43.8 mi. | 1,081 | 6,666 | 16.2 | $22,647 | 62.7 | 5.6 | 55.9 | 0.2 | 0.5 | |
| 39170 / Terry / MS / 15.1 mi. | 1,060 | 2,637 | 40.2 | $46,367 | 33.5 | 0.4 | 32.4 | 0.2 | 0.1 | |
| 39601 / Brookhaven / MS / 51.2 mi. | 1,042 | 8,665 | 12.0 | $26,794 | 35.4 | 0.7 | 33.8 | 0.1 | 0.3 | |
| 39218 / Richland / MS / 4.1 mi. | 1,020 | 2,367 | 43.1 | $37,477 | 11.4 | 0.8 | 8.2 | 0.1 | 1.5 | |
| 39090 / Kosciusko / MS / 63.5 mi. | 1,002 | 5,233 | 19.1 | $23,858 | 42.4 | 1.4 | 39.9 | 0.2 | 0.3 | |
| 39201 / Jackson / MS / 0 mi. | 975 | 197 | 494.9 | $12,750 | 80.9 | 1.3 | 77.9 | 0.6 | 0.2 | |
| 39339 / Louisville / MS / 89.9 mi. | 918 | 6,168 | 14.9 | $28,658 | 48.4 | 1.3 | 45.9 | 0.8 | 0.1 | |
| 39701 / Columbus / MS / 124.3 mi. | 911 | 6,872 | 13.3 | $23,978 | 66.1 | 1.0 | 64.0 | 0.1 | 0.3 | |
| 39083 / Hazlehurst / MS / 36.8 mi. | 843 | 3,670 | 23.0 | $25,744 | 65.1 | 1.5 | 62.5 | 0.0 | 0.3 | |
| 39648 / McComb / MS / 78.2 mi. | 843 | 8,317 | 10.1 | $23,766 | 53.4 | 0.8 | 51.6 | 0.1 | 0.4 | |
| 38930 / Greenwood / MS / 88.6 mi. | 836 | 10,322 | 8.1 | $21,879 | 64.7 | 0.9 | 62.4 | 0.1 | 0.9 | |
| 38732 / Cleveland / MS / 107.6 mi. | 771 | 6,700 | 11.5 | $27,856 | 53.9 | 1.2 | 51.5 | 0.1 | 0.8 | |
| 38655 / Oxford / MS / 149.1 mi. | 769 | 12,091 | 6.4 | $27,826 | 28.8 | 1.2 | 25.0 | 0.1 | 1.6 | |
| 39440 / Laurel / MS / 75.4 mi. | 757 | 8,193 | 9.2 | $25,827 | 54.0 | 3.9 | 49.0 | 0.1 | 0.6 | |
| 39350 / Philadelphia / MS / 69.7 mi. | 714 | 8,339 | 8.6 | $28,411 | 41.0 | 1.1 | 21.8 | 17.0 | 0.3 | |
| 39203 / Jackson / MS / 1.7 mi. | 699 | 2,773 | 25.2 | $15,630 | 97.7 | 1.4 | 95.5 | 0.2 | 0.1 | |
| 39074 / Forest / MS / 43.2 mi. | 681 | 5,748 | 11.8 | $25,754 | 52.8 | 5.6 | 46.0 | 0.4 | 0.3 | |
| 39111 / Magee / MS / 39.7 mi. | 661 | 3,868 | 17.1 | $26,968 | 29.8 | 1.9 | 27.6 | 0.1 | 0.1 | |
| 38901 / Grenada / MS / 107.3 mi. | 637 | 7,592 | 8.4 | $27,469 | 43.7 | 0.7 | 41.9 | 0.1 | 0.4 | |
| 39120 / Natchez / MS / 84.8 mi. | 617 | 13,798 | 4.5 | $25,176 | 55.1 | 0.8 | 53.3 | 0.1 | 0.3 | |
| 39059 / Crystal Springs / MS / 26.1 mi. | 595 | 4,450 | 13.4 | $26,651 | 51.3 | 0.9 | 49.9 | 0.1 | 0.1 | |
| 38701 / Greenville / MS / 83.1 mi. | 512 | 10,800 | 4.7 | $26,546 | 63.6 | 0.8 | 61.5 | 0.1 | 0.8 | |
| 39145 / Pelahatchie / MS / 23.4 mi. | 488 | 1,948 | 25.1 | $34,915 | 21.1 | 1.9 | 18.3 | 0.2 | 0.2 | |
| 39305 / Meridian / MS / 92.5 mi. | 483 | 7,644 | 6.3 | $43,563 | 20.0 | 1.3 | 17.4 | 0.1 | 0.7 | |
| 39117 / Morton / MS / 38.6 mi. | 460 | 3,658 | 12.6 | $30,594 | 29.3 | 6.9 | 21.6 | 0.1 | 0.1 | |
| 39114 / Mendenhall / MS / 32.2 mi. | 437 | 3,565 | 12.3 | $29,176 | 40.9 | 0.7 | 39.4 | 0.1 | 0.1 | |
| 39429 / Columbia / MS / 76.1 mi. | 425 | 6,316 | 6.7 | $24,779 | 37.2 | 0.6 | 35.4 | 0.3 | 0.3 | |
| 38801 / Tupelo / MS / 157.5 mi. | 392 | 10,799 | 3.6 | $38,274 | 34.3 | 1.2 | 31.3 | 0.2 | 0.8 | |
| 38614 / Clarksdale / MS / 133 mi. | 388 | 8,065 | 4.8 | $23,050 | 69.0 | 0.8 | 66.9 | 0.1 | 0.6 | |
| 39071 / Flora / MS / 20.1 mi. | 385 | 1,553 | 24.8 | $41,010 | 48.9 | 0.4 | 47.7 | 0.2 | 0.2 | |
| 38967 / Winona / MS / 87.3 mi. | 365 | 3,046 | 12.0 | $25,724 | 47.2 | 0.8 | 45.6 | 0.1 | 0.4 | |
| 39301 / Meridian / MS / 93.9 mi. | 359 | 11,294 | 3.2 | $24,390 | 49.6 | 0.9 | 47.5 | 0.2 | 0.4 | |
| 39041 / Bolton / MS / 19.1 mi. | 351 | 1,146 | 30.6 | $30,000 | 75.9 | 0.5 | 74.8 | 0.2 | 0.0 | |
| 39038 / Belzoni / MS / 65.9 mi. | 345 | 1,964 | 17.6 | $20,319 | 71.8 | 1.4 | 69.6 | 0.0 | 0.3 | |
| 39095 / Lexington / MS / 58.7 mi. | 345 | 2,811 | 12.3 | $16,250 | 79.2 | 1.2 | 77.2 | 0.1 | 0.3 | |
| 39345 / Newton / MS / 57.4 mi. | 340 | 2,534 | 13.4 | $26,778 | 54.3 | 0.7 | 52.8 | 0.1 | 0.4 | |
| 38751 / Indianola / MS / 87.4 mi. | 336 | 4,416 | 7.6 | $26,970 | 72.1 | 1.0 | 70.3 | 0.0 | 0.4 | |
| 38703 / Greenville / MS / 90.4 mi. | 333 | 6,197 | 5.4 | $26,277 | 71.7 | 0.7 | 69.9 | 0.0 | 0.5 | |
| 39474 / Prentiss / MS / 51.2 mi. | 327 | 2,545 | 12.8 | $21,126 | 63.4 | 0.8 | 61.9 | 0.0 | 0.1 | |
| 39773 / West Point / MS / 126 mi. | 325 | 6,543 | 5.0 | $27,983 | 56.7 | 0.8 | 55.3 | 0.0 | 0.2 | |
| 38606 / Batesville / MS / 143.1 mi. | 309 | 5,545 | 5.6 | $29,424 | 40.9 | 1.2 | 39.0 | 0.2 | 0.2 | |
| 39645 / Liberty / MS / 86.9 mi. | 307 | 2,065 | 14.9 | $23,808 | 42.7 | 0.8 | 41.1 | 0.2 | 0.1 | |
| 39422 / Bay Springs / MS / 62.4 mi. | 291 | 2,184 | 13.3 | $24,944 | 47.5 | 0.7 | 46.1 | 0.1 | 0.0 | |
| 39428 / Collins / MS / 57 mi. | 270 | 3,487 | 7.7 | $26,169 | 44.4 | 1.1 | 42.6 | 0.1 | 0.2 | |
| 39140 / Newhebron / MS / 40 mi. | 264 | 901 | 29.3 | $25,771 | 43.8 | 0.5 | 42.8 | 0.1 | 0.0 | |
| 39150 / Port Gibson / MS / 56.3 mi. | 261 | 2,316 | 11.3 | $23,576 | 80.7 | 0.9 | 79.2 | 0.1 | 0.2 | |
| 39175 / Utica / MS / 27.4 mi. | 260 | 1,601 | 16.2 | $32,278 | 64.3 | 1.4 | 62.2 | 0.0 | 0.1 | |
| 39119 / Mount Olive / MS / 49.3 mi. | 257 | 2,071 | 12.4 | $26,515 | 46.6 | 0.5 | 45.2 | 0.0 | 0.2 | |
| 39367 / Waynesboro / MS / 96.3 mi. | 257 | 5,981 | 4.3 | $26,192 | 40.2 | 0.7 | 39.1 | 0.1 | 0.2 | |
| 38753 / Inverness / MS / 76.9 mi. | 251 | 631 | 39.8 | $32,218 | 59.5 | 1.5 | 57.3 | 0.0 | 0.6 | |
| 39654 / Monticello / MS / 56.5 mi. | 251 | 2,167 | 11.6 | $31,456 | 36.0 | 0.9 | 34.2 | 0.1 | 0.4 | |
| 39744 / Eupora / MS / 102.8 mi. | 251 | 2,596 | 9.7 | $26,949 | 25.9 | 2.1 | 23.2 | 0.1 | 0.1 | |
| 39307 / Meridian / MS / 79.4 mi. | 246 | 6,736 | 3.7 | $24,556 | 52.6 | 1.1 | 50.3 | 0.2 | 0.5 | |
| 39437 / Ellisville / MS / 75.5 mi. | 243 | 4,223 | 5.8 | $31,113 | 18.2 | 1.0 | 16.4 | 0.2 | 0.2 | |
| 39044 / Braxton / MS / 23.6 mi. | 236 | 1,331 | 17.7 | $34,286 | 31.5 | 1.3 | 29.0 | 0.3 | 0.2 | |
| 39653 / Meadville / MS / 72.2 mi. | 236 | 1,212 | 19.5 | $26,521 | 26.5 | 0.5 | 25.1 | 0.2 | 0.1 | |
| 39465 / Petal / MS / 88.1 mi. | 234 | 6,274 | 3.7 | $35,770 | 10.3 | 1.2 | 8.3 | 0.2 | 0.2 | |
| 39159 / Rolling Fork / MS / 52.2 mi. | 230 | 1,201 | 19.2 | $23,066 | 64.8 | 1.0 | 63.0 | 0.0 | 0.2 | |
| 38618 / Coldwater / MS / 166.6 mi. | 224 | 3,922 | 5.7 | $34,150 | 36.7 | 1.0 | 34.9 | 0.2 | 0.0 | |
| 39365 / Union / MS / 70.6 mi. | 222 | 3,074 | 7.2 | $27,727 | 18.0 | 0.9 | 15.9 | 0.6 | 0.1 | |
| 39667 / Tylertown / MS / 79 mi. | 210 | 4,466 | 4.7 | $22,730 | 47.5 | 1.3 | 45.0 | 0.2 | 0.3 | |
| 39116 / Mize / MS / 47.2 mi. | 209 | 924 | 22.6 | $29,242 | 10.3 | 0.8 | 9.0 | 0.1 | 0.2 | |
| 39735 / Ackerman / MS / 93.5 mi. | 200 | 2,122 | 9.4 | $26,948 | 29.4 | 0.9 | 27.7 | 0.2 | 0.2 | |
| 38737 / Drew / MS / 111.5 mi. | 197 | 1,209 | 16.3 | $20,729 | 66.9 | 1.3 | 65.0 | 0.0 | 0.2 | |
| 39191 / Wesson / MS / 43.6 mi. | 194 | 2,534 | 7.7 | $29,389 | 26.6 | 0.9 | 25.0 | 0.2 | 0.1 | |
| 38921 / Charleston / MS / 114.6 mi. | 186 | 1,917 | 9.7 | $22,308 | 62.9 | 1.1 | 61.2 | 0.0 | 0.3 | |
| 39355 / Quitman / MS / 92.9 mi. | 179 | 2,915 | 6.1 | $31,415 | 29.9 | 0.9 | 28.5 | 0.1 | 0.1 | |
| 39455 / Lumberton / MS / 94.5 mi. | 177 | 2,705 | 6.5 | $24,974 | 21.6 | 1.1 | 19.6 | 0.3 | 0.2 | |
| 39063 / Durant / MS / 60 mi. | 170 | 1,454 | 11.7 | $21,418 | 70.0 | 0.7 | 68.2 | 0.1 | 0.2 | |
| 39079 / Goodman / MS / 48.4 mi. | 163 | 536 | 30.4 | $19,728 | 69.2 | 0.6 | 67.9 | 0.1 | 0.0 | |
| 38756 / Leland / MS / 89.2 mi. | 161 | 2,629 | 6.1 | $26,574 | 59.8 | 1.1 | 57.8 | 0.1 | 0.1 | |
| 39341 / Macon / MS / 106.4 mi. | 161 | 2,880 | 5.6 | $22,912 | 70.3 | 1.1 | 68.4 | 0.2 | 0.1 | |
| 39563 / Moss Point / MS / 162 mi. | 161 | 5,734 | 2.8 | $32,072 | 72.1 | 1.0 | 70.1 | 0.1 | 0.3 | |
| 39039 / Benton / MS / 36.6 mi. | 157 | 765 | 20.5 | $27,266 | 43.3 | 1.1 | 41.7 | 0.1 | 0.1 | |
| 39168 / Taylorsville / MS / 55.7 mi. | 156 | 2,284 | 6.8 | $28,458 | 47.8 | 0.6 | 46.7 | 0.1 | 0.0 | |
| 38821 / Amory / MS / 154 mi. | 142 | 5,070 | 2.8 | $31,653 | 19.2 | 0.6 | 17.9 | 0.1 | 0.2 | |
| 38916 / Calhoun City / MS / 115.7 mi. | 131 | 2,114 | 6.2 | $24,817 | 34.7 | 0.7 | 33.3 | 0.1 | 0.1 | |
| 39571 / Pass Christian / MS / 136 mi. | 127 | 6,419 | 2.0 | $38,645 | 20.6 | 1.5 | 15.6 | 0.5 | 2.0 | |
| 39327 / Decatur / MS / 63 mi. | 119 | 1,426 | 8.3 | $29,784 | 27.1 | 0.8 | 25.4 | 0.3 | 0.1 | |
| 39466 / Picayune / MS / 121.3 mi. | 117 | 9,245 | 1.3 | $28,186 | 19.9 | 1.4 | 16.6 | 0.4 | 0.4 | |
| 39066 / Edwards / MS / 24.5 mi. | 110 | 1,596 | 6.9 | $30,406 | 75.4 | 1.1 | 74.0 | 0.0 | 0.1 | |
| 39747 / Kilmichael / MS / 83.8 mi. | 109 | 935 | 11.7 | $21,763 | 47.1 | 1.1 | 45.4 | 0.1 | 0.1 | |
| 39501 / Gulfport / MS / 146.1 mi. | 103 | 9,549 | 1.1 | $25,305 | 59.2 | 2.3 | 54.2 | 0.4 | 1.0 | |
| 38965 / Water Valley / MS / 131.9 mi. | 97 | 3,467 | 2.8 | $29,494 | 31.8 | 0.9 | 30.0 | 0.2 | 0.2 | |
| 39443 / Laurel / MS / 73.3 mi. | 93 | 7,837 | 1.2 | $30,716 | 15.5 | 1.0 | 13.8 | 0.1 | 0.1 | |
| 39730 / Aberdeen / MS / 139.5 mi. | 92 | 4,810 | 1.9 | $28,263 | 49.3 | 0.6 | 48.1 | 0.1 | 0.3 | |
| 39532 / Biloxi / MS / 144.1 mi. | 91 | 12,254 | 0.7 | $41,411 | 15.6 | 2.2 | 7.2 | 0.4 | 4.3 | |
| 38646 / Marks / MS / 138.1 mi. | 90 | 1,352 | 6.7 | $22,298 | 66.6 | 0.4 | 65.3 | 0.1 | 0.3 | |
| 38834 / Corinth / MS / 202.9 mi. | 90 | 11,186 | 0.8 | $28,491 | 15.0 | 1.3 | 12.7 | 0.1 | 0.3 | |
| 38917 / Carrollton / MS / 86.6 mi. | 84 | 1,296 | 6.5 | $31,148 | 27.2 | 0.5 | 26.2 | 0.1 | 0.2 | |
| 39470 / Poplarville / MS / 103.7 mi. | 82 | 4,076 | 2.0 | $31,331 | 14.5 | 1.1 | 11.7 | 0.5 | 0.4 | |
| 38652 / New Albany / MS / 167.3 mi. | 81 | 6,060 | 1.3 | $32,361 | 23.8 | 2.2 | 20.8 | 0.1 | 0.2 | |
| 38754 / Isola / MS / 69.9 mi. | 80 | 908 | 8.8 | $18,696 | 76.1 | 1.9 | 73.6 | 0.2 | 0.2 | |
| 38941 / Itta Bena / MS / 78 mi. | 80 | 1,564 | 5.1 | $19,450 | 88.4 | 3.9 | 84.0 | 0.0 | 0.3 | |
| 39439 / Heidelberg / MS / 74.2 mi. | 79 | 1,703 | 4.6 | $24,578 | 64.4 | 0.6 | 60.6 | 2.8 | 0.0 | |
| 38851 / Houston / MS / 133.5 mi. | 72 | 3,466 | 2.1 | $25,376 | 36.9 | 3.6 | 32.4 | 0.3 | 0.3 | |
| 38863 / Pontotoc / MS / 148.3 mi. | 71 | 6,810 | 1.0 | $30,941 | 15.6 | 1.9 | 12.8 | 0.3 | 0.1 | |
| 38748 / Hollandale / MS / 71.3 mi. | 70 | 1,752 | 4.0 | $21,842 | 66.2 | 1.0 | 64.5 | 0.0 | 0.1 | |
| 39531 / Biloxi / MS / 148.8 mi. | 68 | 8,275 | 0.8 | $34,863 | 29.9 | 4.3 | 19.2 | 0.5 | 3.2 | |
| 39577 / Wiggins / MS / 116.6 mi. | 64 | 3,812 | 1.7 | $28,145 | 23.9 | 1.1 | 22.1 | 0.1 | 0.1 | |
| 38922 / Coffeeville / MS / 118.7 mi. | 58 | 1,433 | 4.0 | $24,828 | 43.3 | 0.8 | 42.1 | 0.1 | 0.0 | |
| 39635 / Fernwood / MS / 78.2 mi. | 57 | 65 | 87.7 | $20,000 | 11.3 | 0.0 | 6.0 | 4.0 | 0.0 | |
| 39772 / Weir / MS / 85 mi. | 53 | 923 | 5.7 | $27,083 | 49.2 | 0.7 | 47.6 | 0.6 | 0.0 | |
| 39094 / Lena / MS / 43.4 mi. | 52 | 1,295 | 4.0 | $25,320 | 46.5 | 0.9 | 45.1 | 0.1 | 0.0 | |
| 39750 / Maben / MS / 106.5 mi. | 52 | 957 | 5.4 | $28,964 | 27.8 | 0.4 | 26.6 | 0.2 | 0.1 | |
| 39328 / De Kalb / MS / 87.6 mi. | 37 | 1,778 | 2.1 | $22,899 | 62.1 | 0.5 | 60.6 | 0.1 | 0.1 | |
| 38730 / Boyle / MS / 100.2 mi. | 36 | 532 | 6.8 | $37,353 | 27.3 | 0.8 | 25.4 | 0.0 | 0.8 | |
| 39069 / Fayette / MS / 63.5 mi. | 36 | 2,132 | 1.7 | $17,856 | 92.0 | 0.5 | 90.9 | 0.1 | 0.2 | |
| 39108 / Mc Cool / MS / 78.3 mi. | 32 | 827 | 3.9 | $25,900 | 37.5 | 1.0 | 35.2 | 0.2 | 0.7 | |
| 38738 / Parchman / MS / 113.8 mi. | 30 | 124 | 24.2 | $30,521 | 75.7 | 0.5 | 74.3 | 0.2 | 0.5 | |
| 39153 / Raleigh / MS / 42.2 mi. | 29 | 1,331 | 2.2 | $28,068 | 23.9 | 0.6 | 23.1 | 0.1 | 0.0 | |
| 38961 / Tillatoba / MS / 118.7 mi. | 26 | 508 | 5.1 | $23,787 | 29.9 | 0.9 | 28.7 | 0.2 | 0.0 | |
| 39115 / Midnight / MS / 57.2 mi. | 26 | 53 | 49.1 | $39,286 | 64.4 | 0.0 | 64.4 | 0.0 | 0.0 | |
| 39192 / West / MS / 67.3 mi. | 25 | 804 | 3.1 | $26,295 | 51.7 | 1.4 | 49.3 | 0.3 | 0.1 | |
| 39641 / Jayess / MS / 60.8 mi. | 25 | 1,557 | 1.6 | $22,444 | 23.0 | 0.8 | 21.5 | 0.1 | 0.2 | |
| 39752 / Mathiston / MS / 105.8 mi. | 23 | 682 | 3.4 | $27,833 | 9.2 | 0.9 | 7.5 | 0.0 | 0.7 | |
| 39166 / Silver City / MS / 51.7 mi. | 21 | 289 | 7.3 | $25,000 | 81.2 | 1.0 | 80.0 | 0.0 | 0.0 | |
| 39661 / Roxie / MS / 76.2 mi. | 13 | 1,116 | 1.2 | $22,368 | 56.1 | 0.5 | 54.9 | 0.2 | 0.1 | |
| 39668 / Union Church / MS / 55.1 mi. | 3 | 282 | 1.1 | $28,681 | 58.9 | 0.1 | 57.9 | 0.1 | 0.1 | |
| File | ms_the_clarion-ledger__jackson | |||||||||
| Time | 5/17/05 5:18 PM | |||||||||
| Page | 110 | |||||||||
| Member | 124000 | |||||||||