
|
| Comparing the racial diversity of the journalists | ||||||||||
| at America's daily newspapers | ||||||||||
| with the communities that they serve | ||||||||||
| Newsroom diversity report for | ||||||||||
| St. Louis Post-Dispatch | ||||||||||
| St. Louis, Missouri | ||||||||||
| Owner: Pulitzer (Mo.) | ||||||||||
| From a report for the Knight Foundation | ||||||||||
| by Bill Dedman and Stephen K. Doig, June 2005 | ||||||||||
| Click here to read the national report or to select another newspaper | ||||||||||
| Year | Non-white % of newsroom staff | 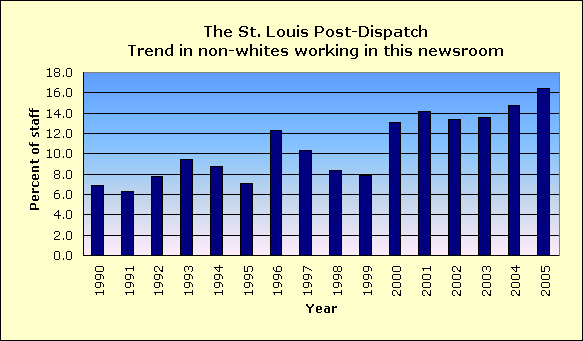
|
||||||||
| 2005 | 16.4 | |||||||||
| 2004 | 14.8 | |||||||||
| 2003 | 13.6 | |||||||||
| 2002 | 13.4 | |||||||||
| 2001 | 14.2 | |||||||||
| 2000 | 13.1 | |||||||||
| 1999 | 7.9 | |||||||||
| 1998 | 8.4 | |||||||||
| 1997 | 10.3 | |||||||||
| 1996 | 12.3 | |||||||||
| 1995 | 7.1 | |||||||||
| 1994 | 8.8 | |||||||||
| 1993 | 9.4 | |||||||||
| 1992 | 7.8 | |||||||||
| 1991 | 6.3 | |||||||||
| 1990 | 6.9 | |||||||||
| The latest year at peak is | 2005 | |||||||||
| See the notes and definitions section below for the sources of these figures. | ||||||||||
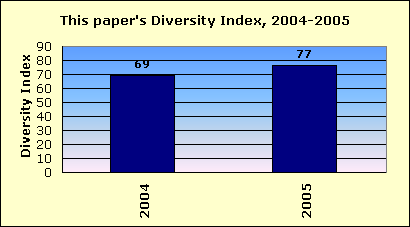
| Newsroom Diversity Index | ||||||||||
| for St. Louis Post-Dispatch | ||||||||||
 |
||||||||||
| Year | Non-white % of newsroom staff | Non-white % of circulation area | Newsroom Diversity Index (parity=100) | |||||||
| 2005 | 16.4 | 21.4 | 77 | |||||||
| 2004 | 14.8 | 21.4 | 69 | |||||||
| How the index is calculated | ||||||||||
| The Newsroom Diversity Index is the non-white percentage of the newsroom staff | ||||||||||
| divided by the non-white percentage of residents in the circulation area. | ||||||||||
| (Parity = 100.) | ||||||||||
| Company index | ||||||||||
| This newspaper's owner, Pulitzer (Mo.), | ||||||||||
| has a companywide, circulation-weighted Diversity Index of 59. | ||||||||||
| See the notes and definitions section below for the sources of these figures. | ||||||||||
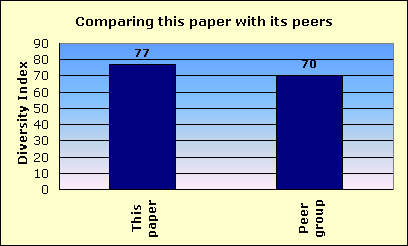
| Peer group comparison | ||||||||||
| for St. Louis Post-Dispatch | ||||||||||
 |
||||||||||
| This newspaper's Newsroom Diversity Index is 77. | This paper | |||||||||
| Peer group | ||||||||||
| Compare that with 70, which is the median Diversity Index for all newspapers | ||||||||||
| reporting in this circulation category of 250,001 to 500,000 daily sales. | ||||||||||
| In that group, this newspaper's Diversity Index ranks 9 out of 24 | ||||||||||
| newspapers reporting in the category of 250,001 to 500,000 daily sales. | ||||||||||
| An example of a newspaper of similar circulation, in an area of similar level of non-white residents, but one that has a relatively high Diversity Index, is The Oregonian, Portland, Oregon, with a 18.8 percent non-white staff in a community that is 18.2 percent non-white. Its index is 103. | ||||||||||
| FYI, in circulation, this newspaper's average weekday circulation of | ||||||||||
| approximately 286,310 ranks 28 out of 1,410 daily newspapers in the US. | ||||||||||
| See the notes and definitions section below for the sources of these figures. | ||||||||||
| Details on race/ethnicity | ||||||||||
| in the circulation area | ||||||||||
| and the home county | ||||||||||
| of St. Louis Post-Dispatch | ||||||||||
| Circulation area | ||||||||||
| Race/ethnicity | % of population | Number of residents | 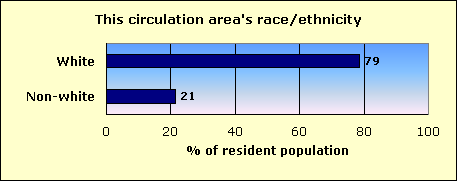
|
|||||||
| Hispanic | 1.5 | 37,413 | ||||||||
| Black | 16.9 | 410,704 | ||||||||
| Asian and Pacific Islander | 1.5 | 36,349 | ||||||||
| Native-American | 0.2 | 5,033 | ||||||||
| Other non-white | 0.1 | 2,728 | ||||||||
| Multi-racial | 1.1 | 27,426 | ||||||||
| Non-white | 21.4 | 519,653 | ||||||||
| White | 78.6 | 1,909,881 | ||||||||
| Total | 2,429,534 | |||||||||
| Home county: St. Louis city | ||||||||||
| Race/ethnicity | % of population | Number of residents | 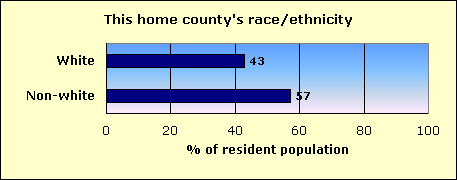
|
|||||||
| Hispanic | 2.0 | 7,022 | ||||||||
| Black | 51.0 | 177,446 | ||||||||
| Asian and Pacific Islander | 2.0 | 6,903 | ||||||||
| Native-American | 0.3 | 862 | ||||||||
| Other non-white | 0.2 | 647 | ||||||||
| Multi-racial | 1.7 | 5,980 | ||||||||
| Non-white | 57.1 | 198,860 | ||||||||
| White | 42.9 | 149,329 | ||||||||
| Total | 348,189 | |||||||||
| The home county of this newspaper is St. Louis city. | ||||||||||
| About this report | ||||||||||
| This third annual report for the Knight Foundation adds context to an annual survey by the American Society of Newspaper Editors. ASNE has set a goal that | ||||||||||
| every newspaper, to help it know its community and gather the news, should employ at least one non-white journalist, and that newspapers should strive to | ||||||||||
| employ non-whites in proportion to their share of the community. ASNE's report, at www.asne.org, shows each newspaper's non-white employment, but does | ||||||||||
| not disclose how closely that employment mirrors the newspaper's circulation area. | ||||||||||
| That gap is filled by the report you are reading now. This report was not done by ASNE, but was done for the Knight Foundation by Bill Dedman and | ||||||||||
| Stephen K. Doig. It shows how close each newspaper is to ASNE's goal, by comparing the newsroom staffing with the circulation area population. | ||||||||||
| The full report is at www.powerreporting.com/knight. | ||||||||||
| Notes and definitions | ||||||||||
| 1. The Newsroom Diversity Index is the non-white percentage of the newsroom staff divided by the non-white percentage of the circulation area's residents. Parity = 100. | ||||||||||
| 2. Source for staffing: Survey by American Society of Newspaper Editors, April 2005. Newspapers report non-white staff as of the end of the previous year. | ||||||||||
| 3. Following ASNE's definition, newsroom staff includes only supervisors, reporters, editors, copy/layout editors and photographers. | ||||||||||
| 4. Also following ASNE's definition, "whites," "blacks," etc., exclude Hispanics, who are counted in a separate category. | ||||||||||
| 5. Source for boundaries of this newspaper's circulation area: ZIP Code circulation data, Audit Bureau of Circulations, latest available. | ||||||||||
| 6. A paper may define its circulation area differently for marketing efforts, or news coverage, or to set advertising rates. | ||||||||||
| 7. If ZIP Codes or counties are used, this report applies a threshold: 10 percent household penetration is required to include an area in the circulation area. | ||||||||||
| 8. Source for the demographics of residents of that circulation area: US Census 2000. | ||||||||||
| 9. Source for total circulation: Editor & Publisher magazine, Monday-Friday average at year-end 2004. | ||||||||||
| 10. Staff of non-English publications, such as the Miami Herald's El Nuevo Herald, are excluded from the ASNE staffing survey for the first time this year. | ||||||||||
| Demographics of ZIP Codes | ||||||||||
| where sales were reported by | ||||||||||
| St. Louis Post-Dispatch | ||||||||||
| Note that some ZIP Codes listed here may not have been included in determining the newspaper's circulation area. In calculating the Diversity Index, a | ||||||||||
| ZIP Code was included only if the household penetration was at least 10 percent. Any lower-penetration ZIP Codes are also listed here for your information. | ||||||||||
| Also, if the newspaper reported more than 300 ZIP Codes, only the top 300 in weekday sales are listed here. | ||||||||||
| ZIP / City / State / Approx. distance in miles from the newspaper's home office | Weekday sales | Households | Penetration % (daily sales per 100 households) | Median household income | Non-white % of population |
Hispanic % of population |
Black % of population |
Native % of population |
Asian % of population |
|
| 63017 / Chesterfield / MO / 18.6 mi. | 8,013 | 16,377 | 48.9 | $83,132 | 10.2 | 1.5 | 1.9 | 0.1 | 5.7 | |
| 63123 / Saint Louis / MO / 9.2 mi. | 7,354 | 22,080 | 33.3 | $42,254 | 5.0 | 1.2 | 0.8 | 0.1 | 1.7 | |
| 63122 / Saint Louis / MO / 12.8 mi. | 7,180 | 16,004 | 44.9 | $60,672 | 8.2 | 1.1 | 5.3 | 0.1 | 0.9 | |
| 63021 / Ballwin / MO / 19.6 mi. | 6,866 | 19,977 | 34.4 | $66,638 | 8.6 | 1.5 | 2.0 | 0.1 | 4.0 | |
| 63031 / Florissant / MO / 15 mi. | 6,756 | 19,000 | 35.6 | $49,467 | 15.0 | 1.4 | 11.3 | 0.1 | 0.7 | |
| 63011 / Ballwin / MO / 19.7 mi. | 6,410 | 13,943 | 46.0 | $72,721 | 7.7 | 1.7 | 1.7 | 0.2 | 3.3 | |
| 63129 / Saint Louis / MO / 13.9 mi. | 6,042 | 19,197 | 31.5 | $60,626 | 3.7 | 1.1 | 0.6 | 0.1 | 1.2 | |
| 63119 / Saint Louis / MO / 9 mi. | 6,033 | 14,778 | 40.8 | $52,703 | 12.7 | 1.3 | 8.4 | 0.1 | 1.7 | |
| 63101 / Saint Louis / MO / 0 mi. | 5,585 | 889 | 628.2 | $17,783 | 72.1 | 0.7 | 69.6 | 0.0 | 0.5 | |
| 63366 / O Fallon / MO / 31.8 mi. | 5,551 | 19,761 | 28.1 | $57,342 | 5.6 | 1.5 | 2.1 | 0.2 | 0.8 | |
| 63376 / Saint Peters / MO / 25.7 mi. | 5,409 | 23,591 | 22.9 | $60,732 | 6.1 | 1.5 | 2.4 | 0.2 | 1.0 | |
| 63141 / Saint Louis / MO / 14.4 mi. | 5,056 | 7,969 | 63.4 | $81,180 | 11.9 | 1.8 | 3.1 | 0.2 | 5.9 | |
| 63026 / Fenton / MO / 17 mi. | 5,053 | 14,969 | 33.8 | $55,378 | 3.7 | 1.2 | 0.7 | 0.2 | 0.8 | |
| 63301 / Saint Charles / MO / 21.3 mi. | 5,051 | 18,333 | 27.6 | $45,128 | 7.2 | 2.1 | 2.9 | 0.3 | 0.7 | |
| 63128 / Saint Louis / MO / 14 mi. | 5,042 | 11,868 | 42.5 | $59,347 | 2.9 | 0.9 | 0.4 | 0.1 | 1.1 | |
| 63304 / Saint Charles / MO / 24.9 mi. | 4,464 | 12,710 | 35.1 | $67,402 | 5.6 | 1.2 | 2.3 | 0.2 | 0.9 | |
| 63125 / Saint Louis / MO / 9.5 mi. | 4,454 | 14,194 | 31.4 | $37,988 | 5.6 | 1.8 | 1.6 | 0.2 | 1.0 | |
| 63303 / Saint Charles / MO / 20.5 mi. | 4,338 | 16,208 | 26.8 | $56,006 | 7.0 | 1.4 | 3.1 | 0.2 | 1.3 | |
| 63109 / Saint Louis / MO / 6.4 mi. | 4,322 | 14,194 | 30.4 | $40,412 | 7.8 | 2.0 | 2.7 | 0.2 | 1.1 | |
| 63033 / Florissant / MO / 12.2 mi. | 4,197 | 17,888 | 23.5 | $47,852 | 46.9 | 1.2 | 43.3 | 0.2 | 0.8 | |
| 63116 / Saint Louis / MO / 5.2 mi. | 4,138 | 20,209 | 20.5 | $30,775 | 29.0 | 3.5 | 17.5 | 0.3 | 4.6 | |
| 63146 / Saint Louis / MO / 16 mi. | 4,121 | 13,901 | 29.6 | $53,377 | 16.5 | 2.1 | 6.1 | 0.1 | 6.7 | |
| 63131 / Saint Louis / MO / 13.6 mi. | 3,961 | 5,974 | 66.3 | $112,017 | 6.1 | 0.9 | 0.9 | 0.1 | 3.5 | |
| 63114 / Saint Louis / MO / 10.4 mi. | 3,863 | 15,841 | 24.4 | $35,946 | 26.5 | 2.3 | 20.3 | 0.3 | 1.6 | |
| 63042 / Hazelwood / MO / 14.9 mi. | 3,688 | 8,412 | 43.8 | $42,004 | 23.2 | 1.8 | 18.0 | 0.2 | 1.3 | |
| 62040 / Granite City / IL / 8.3 mi. | 3,574 | 18,435 | 19.4 | $37,096 | 7.1 | 2.4 | 2.6 | 0.4 | 0.5 | |
| 63105 / Saint Louis / MO / 7.4 mi. | 3,558 | 6,312 | 56.4 | $62,252 | 15.6 | 1.5 | 7.2 | 0.1 | 5.6 | |
| 63136 / Saint Louis / MO / 8.5 mi. | 3,534 | 20,001 | 17.7 | $31,032 | 83.4 | 0.6 | 81.1 | 0.1 | 0.4 | |
| 63043 / Maryland Heights / MO / 15.5 mi. | 3,315 | 9,484 | 35.0 | $52,024 | 14.5 | 1.7 | 5.2 | 0.2 | 6.4 | |
| 63010 / Arnold / MO / 17.8 mi. | 3,298 | 13,503 | 24.4 | $50,610 | 2.8 | 1.1 | 0.2 | 0.2 | 0.4 | |
| 63130 / Saint Louis / MO / 7.5 mi. | 3,221 | 13,168 | 24.5 | $41,580 | 50.3 | 1.8 | 42.3 | 0.1 | 2.6 | |
| 63139 / Saint Louis / MO / 5.5 mi. | 3,220 | 11,744 | 27.4 | $35,139 | 12.5 | 2.0 | 6.2 | 0.2 | 2.2 | |
| 63005 / Chesterfield / MO / 24.5 mi. | 2,983 | 5,493 | 54.3 | $126,471 | 7.7 | 1.4 | 2.0 | 0.1 | 3.4 | |
| 63126 / Saint Louis / MO / 11.5 mi. | 2,727 | 6,550 | 41.6 | $53,728 | 4.3 | 1.1 | 0.6 | 0.1 | 1.7 | |
| 63110 / Saint Louis / MO / 4 mi. | 2,712 | 8,036 | 33.7 | $28,604 | 59.2 | 1.7 | 53.8 | 0.3 | 1.1 | |
| 63124 / Saint Louis / MO / 10.2 mi. | 2,612 | 4,250 | 61.5 | $95,719 | 6.3 | 0.9 | 2.7 | 0.1 | 2.1 | |
| 62025 / Edwardsville / IL / 16.7 mi. | 2,566 | 10,629 | 24.1 | $51,657 | 11.2 | 0.9 | 7.5 | 0.2 | 1.3 | |
| 63044 / Bridgeton / MO / 15.6 mi. | 2,565 | 5,818 | 44.1 | $49,012 | 13.7 | 2.2 | 7.8 | 0.2 | 2.2 | |
| 63108 / Saint Louis / MO / 3.4 mi. | 2,376 | 10,795 | 22.0 | $25,953 | 52.7 | 1.9 | 44.6 | 0.2 | 4.4 | |
| 63118 / Saint Louis / MO / 3.2 mi. | 2,258 | 11,255 | 20.1 | $23,553 | 63.4 | 3.7 | 52.4 | 0.4 | 4.0 | |
| 62234 / Collinsville / IL / 12.1 mi. | 2,185 | 13,165 | 16.6 | $43,865 | 8.9 | 2.5 | 4.8 | 0.3 | 0.5 | |
| 63132 / Saint Louis / MO / 10.5 mi. | 2,177 | 6,021 | 36.2 | $43,885 | 47.0 | 2.3 | 38.1 | 0.1 | 4.6 | |
| 63111 / Saint Louis / MO / 5.9 mi. | 2,112 | 8,986 | 23.5 | $23,543 | 33.3 | 4.3 | 23.6 | 0.4 | 2.0 | |
| 63137 / Saint Louis / MO / 8.4 mi. | 1,986 | 8,296 | 23.9 | $36,319 | 47.9 | 0.9 | 45.3 | 0.2 | 0.3 | |
| 63135 / Saint Louis / MO / 10 mi. | 1,832 | 8,139 | 22.5 | $38,338 | 44.8 | 1.1 | 41.1 | 0.2 | 0.7 | |
| 63117 / Saint Louis / MO / 7.5 mi. | 1,810 | 4,672 | 38.7 | $51,087 | 18.6 | 1.8 | 12.9 | 0.2 | 2.4 | |
| 63074 / Saint Ann / MO / 12.4 mi. | 1,784 | 7,097 | 25.1 | $32,258 | 20.5 | 4.1 | 12.3 | 0.3 | 2.0 | |
| 63121 / Saint Louis / MO / 7.8 mi. | 1,782 | 11,688 | 15.2 | $32,422 | 83.3 | 1.2 | 79.8 | 0.2 | 0.6 | |
| 63034 / Florissant / MO / 15.3 mi. | 1,770 | 5,800 | 30.5 | $71,234 | 32.7 | 1.0 | 28.8 | 0.1 | 1.4 | |
| 63144 / Saint Louis / MO / 8.4 mi. | 1,710 | 4,649 | 36.8 | $49,054 | 9.9 | 1.9 | 2.4 | 0.2 | 3.9 | |
| 63385 / Wentzville / MO / 37.1 mi. | 1,703 | 4,862 | 35.0 | $51,834 | 10.2 | 1.0 | 7.2 | 0.2 | 0.4 | |
| 62002 / Alton / IL / 21.6 mi. | 1,603 | 14,093 | 11.4 | $34,253 | 25.5 | 1.4 | 22.0 | 0.2 | 0.4 | |
| 65101 / Jefferson City / MO / 106.2 mi. | 1,559 | 10,119 | 15.4 | $40,663 | 20.2 | 1.2 | 16.4 | 0.4 | 0.8 | |
| 63028 / Festus / MO / 36.1 mi. | 1,544 | 8,454 | 18.3 | $42,088 | 4.3 | 0.8 | 1.9 | 0.3 | 0.6 | |
| 63138 / Saint Louis / MO / 11.6 mi. | 1,485 | 8,561 | 17.3 | $37,367 | 57.2 | 1.0 | 53.6 | 0.2 | 0.7 | |
| 63025 / Eureka / MO / 26.2 mi. | 1,476 | 3,637 | 40.6 | $73,158 | 3.1 | 1.3 | 0.4 | 0.2 | 0.6 | |
| 62223 / Belleville / IL / 9.5 mi. | 1,476 | 7,162 | 20.6 | $47,606 | 15.6 | 1.1 | 12.8 | 0.3 | 0.5 | |
| 63115 / Saint Louis / MO / 4.1 mi. | 1,462 | 9,996 | 14.6 | $24,587 | 99.3 | 0.5 | 97.8 | 0.2 | 0.1 | |
| 63143 / Saint Louis / MO / 7 mi. | 1,422 | 5,591 | 25.4 | $30,484 | 23.9 | 2.3 | 15.3 | 0.3 | 3.8 | |
| 63090 / Washington / MO / 46.2 mi. | 1,349 | 7,881 | 17.1 | $48,394 | 2.2 | 0.6 | 0.6 | 0.1 | 0.4 | |
| 63104 / Saint Louis / MO / 1.8 mi. | 1,336 | 8,400 | 15.9 | $29,566 | 60.5 | 2.1 | 55.1 | 0.3 | 1.0 | |
| 63367 / Lake Saint Louis / MO / 33.8 mi. | 1,333 | 2,963 | 45.0 | $76,910 | 4.6 | 1.3 | 1.6 | 0.2 | 0.8 | |
| 63052 / Imperial / MO / 21.2 mi. | 1,294 | 6,661 | 19.4 | $52,410 | 2.9 | 1.2 | 0.2 | 0.2 | 0.3 | |
| 63134 / Saint Louis / MO / 11.3 mi. | 1,269 | 5,528 | 23.0 | $34,134 | 61.8 | 1.7 | 57.7 | 0.2 | 0.6 | |
| 63701 / Cape Girardeau / MO / 97.4 mi. | 1,257 | 13,273 | 9.5 | $37,890 | 9.0 | 1.0 | 5.4 | 0.4 | 1.2 | |
| 62269 / O Fallon / IL / 16.3 mi. | 1,170 | 9,924 | 11.8 | $55,339 | 17.5 | 2.3 | 10.9 | 0.2 | 2.4 | |
| 63112 / Saint Louis / MO / 5.3 mi. | 1,097 | 9,643 | 11.4 | $20,686 | 84.5 | 0.9 | 79.9 | 0.2 | 1.8 | |
| 65201 / Columbia / MO / 111.8 mi. | 1,078 | 12,610 | 8.5 | $26,955 | 15.8 | 1.9 | 7.5 | 0.4 | 4.2 | |
| 63049 / High Ridge / MO / 21.2 mi. | 1,074 | 5,064 | 21.2 | $51,449 | 2.6 | 1.0 | 0.2 | 0.2 | 0.3 | |
| 63127 / Saint Louis / MO / 13.6 mi. | 1,049 | 1,996 | 52.6 | $57,275 | 5.2 | 1.2 | 1.8 | 0.1 | 1.2 | |
| 63040 / Grover / MO / 23.8 mi. | 1,006 | 2,926 | 34.4 | $78,767 | 6.5 | 1.4 | 1.2 | 0.1 | 3.0 | |
| 62035 / Godfrey / IL / 22.9 mi. | 986 | 6,076 | 16.2 | $50,069 | 6.5 | 0.9 | 3.8 | 0.3 | 0.6 | |
| 63088 / Valley Park / MO / 20.6 mi. | 975 | 3,558 | 27.4 | $47,083 | 10.9 | 2.3 | 3.4 | 0.1 | 3.8 | |
| 63069 / Pacific / MO / 31.4 mi. | 963 | 5,243 | 18.4 | $48,330 | 7.6 | 0.7 | 5.1 | 0.3 | 0.3 | |
| 62249 / Highland / IL / 30 mi. | 961 | 5,130 | 18.7 | $49,624 | 2.0 | 1.0 | 0.1 | 0.1 | 0.4 | |
| 62236 / Columbia / IL / 14.7 mi. | 903 | 4,013 | 22.5 | $62,056 | 1.9 | 0.9 | 0.1 | 0.1 | 0.3 | |
| 62206 / East Saint Louis / IL / 4.6 mi. | 900 | 6,299 | 14.3 | $29,899 | 45.1 | 2.1 | 40.9 | 0.3 | 0.4 | |
| 63379 / Troy / MO / 49.3 mi. | 882 | 5,482 | 16.1 | $44,164 | 5.3 | 1.2 | 2.4 | 0.4 | 0.2 | |
| 63038 / Glencoe / MO / 26.1 mi. | 870 | 1,627 | 53.5 | $97,670 | 4.7 | 1.4 | 1.3 | 0.0 | 1.5 | |
| 62034 / Glen Carbon / IL / 14.7 mi. | 858 | 4,595 | 18.7 | $57,053 | 10.9 | 1.5 | 6.2 | 0.2 | 2.0 | |
| 65203 / Columbia / MO / 120.1 mi. | 839 | 18,673 | 4.5 | $42,685 | 18.5 | 2.0 | 10.3 | 0.3 | 3.9 | |
| 63383 / Warrenton / MO / 57.7 mi. | 837 | 4,605 | 18.2 | $37,056 | 4.2 | 1.1 | 1.3 | 0.4 | 0.3 | |
| 63050 / Hillsboro / MO / 35.6 mi. | 801 | 4,647 | 17.2 | $46,778 | 2.7 | 0.9 | 0.4 | 0.3 | 0.2 | |
| 62201 / East Saint Louis / IL / 3.3 mi. | 786 | 3,122 | 25.2 | $12,822 | 85.6 | 16.7 | 68.0 | 0.2 | 0.1 | |
| 62095 / Wood River / IL / 16.8 mi. | 779 | 4,422 | 17.6 | $33,286 | 3.3 | 1.3 | 0.7 | 0.2 | 0.4 | |
| 63020 / De Soto / MO / 42.4 mi. | 772 | 7,389 | 10.4 | $38,919 | 3.0 | 0.9 | 0.9 | 0.2 | 0.2 | |
| 63640 / Farmington / MO / 61.2 mi. | 770 | 7,813 | 9.9 | $32,371 | 7.5 | 1.0 | 4.5 | 0.4 | 0.5 | |
| 62208 / Fairview Heights / IL / 10.5 mi. | 756 | 5,939 | 12.7 | $47,222 | 22.4 | 2.0 | 17.0 | 0.2 | 1.8 | |
| 63084 / Union / MO / 48.3 mi. | 747 | 5,126 | 14.6 | $41,134 | 3.3 | 0.9 | 1.1 | 0.2 | 0.2 | |
| 63051 / House Springs / MO / 25.5 mi. | 742 | 4,659 | 15.9 | $46,961 | 3.0 | 1.1 | 0.2 | 0.5 | 0.2 | |
| 63103 / Saint Louis / MO / 1.3 mi. | 721 | 2,670 | 27.0 | $17,852 | 60.0 | 3.4 | 50.8 | 0.5 | 3.5 | |
| 63147 / Saint Louis / MO / 4.7 mi. | 703 | 4,496 | 15.6 | $27,486 | 90.1 | 0.5 | 88.2 | 0.2 | 0.2 | |
| 63012 / Barnhart / MO / 24.7 mi. | 696 | 3,064 | 22.7 | $56,420 | 2.9 | 1.2 | 0.4 | 0.3 | 0.3 | |
| 62864 / Mount Vernon / IL / 72.9 mi. | 678 | 10,349 | 6.6 | $31,534 | 11.6 | 1.2 | 8.2 | 0.1 | 0.7 | |
| 62298 / Waterloo / IL / 22.9 mi. | 657 | 5,149 | 12.8 | $51,431 | 1.6 | 0.7 | 0.0 | 0.2 | 0.3 | |
| 62301 / Quincy / IL / 107.5 mi. | 649 | 21,041 | 3.1 | $33,373 | 6.3 | 0.9 | 3.7 | 0.2 | 0.5 | |
| 63107 / Saint Louis / MO / 2.6 mi. | 649 | 5,627 | 11.5 | $19,353 | 92.3 | 0.7 | 90.1 | 0.2 | 0.4 | |
| 63670 / Sainte Genevieve / MO / 45.9 mi. | 647 | 4,319 | 15.0 | $39,889 | 2.8 | 0.9 | 0.9 | 0.3 | 0.2 | |
| 63120 / Saint Louis / MO / 5.5 mi. | 644 | 4,427 | 14.5 | $20,025 | 96.5 | 0.5 | 94.8 | 0.2 | 0.1 | |
| 63113 / Saint Louis / MO / 3.5 mi. | 639 | 6,002 | 10.6 | $20,724 | 99.1 | 0.7 | 97.3 | 0.2 | 0.1 | |
| 62294 / Troy / IL / 20.1 mi. | 637 | 4,438 | 14.4 | $58,876 | 4.8 | 1.4 | 1.2 | 0.2 | 0.7 | |
| 65401 / Rolla / MO / 97.7 mi. | 637 | 10,844 | 5.9 | $30,449 | 8.6 | 1.4 | 1.9 | 0.5 | 3.3 | |
| 62221 / Belleville / IL / 18.1 mi. | 617 | 8,925 | 6.9 | $45,230 | 23.7 | 2.4 | 17.6 | 0.2 | 1.8 | |
| 62220 / Belleville / IL / 14.7 mi. | 613 | 7,834 | 7.8 | $37,395 | 15.2 | 1.7 | 11.0 | 0.2 | 0.8 | |
| 63080 / Sullivan / MO / 56.9 mi. | 593 | 4,910 | 12.1 | $35,958 | 2.3 | 1.0 | 0.1 | 0.2 | 0.5 | |
| 62226 / Belleville / IL / 11.9 mi. | 589 | 11,360 | 5.2 | $39,493 | 18.5 | 1.6 | 14.4 | 0.2 | 1.2 | |
| 63775 / Perryville / MO / 65.6 mi. | 569 | 6,075 | 9.4 | $36,656 | 2.2 | 0.6 | 0.1 | 0.3 | 0.7 | |
| 63601 / Park Hills / MO / 58.4 mi. | 549 | 6,201 | 8.9 | $28,737 | 2.4 | 0.7 | 0.4 | 0.3 | 0.3 | |
| 62024 / East Alton / IL / 18.4 mi. | 513 | 5,206 | 9.9 | $38,292 | 2.9 | 0.9 | 0.6 | 0.2 | 0.3 | |
| 63801 / Sikeston / MO / 121.3 mi. | 503 | 9,272 | 5.4 | $29,909 | 19.1 | 1.2 | 16.4 | 0.2 | 0.4 | |
| 63089 / Villa Ridge / MO / 39.3 mi. | 487 | 2,024 | 24.1 | $44,707 | 5.4 | 0.8 | 2.4 | 0.5 | 0.3 | |
| 62801 / Centralia / IL / 56 mi. | 473 | 9,118 | 5.2 | $33,967 | 14.5 | 1.6 | 10.8 | 0.2 | 0.6 | |
| 62246 / Greenville / IL / 46.6 mi. | 470 | 3,158 | 14.9 | $40,346 | 14.4 | 2.0 | 11.1 | 0.5 | 0.4 | |
| 63401 / Hannibal / MO / 99.7 mi. | 464 | 8,645 | 5.4 | $31,184 | 8.5 | 1.0 | 5.5 | 0.3 | 0.4 | |
| 63048 / Herculaneum / MO / 27.7 mi. | 459 | 877 | 52.3 | $38,419 | 4.0 | 0.4 | 3.0 | 0.0 | 0.1 | |
| 63102 / Saint Louis / MO / 0.4 mi. | 454 | 654 | 69.4 | $37,991 | 43.0 | 1.1 | 37.5 | 0.8 | 2.3 | |
| 62010 / Bethalto / IL / 21.3 mi. | 440 | 4,165 | 10.6 | $45,173 | 2.8 | 1.0 | 0.7 | 0.2 | 0.4 | |
| 63628 / Bonne Terre / MO / 50.4 mi. | 435 | 4,536 | 9.6 | $35,960 | 1.7 | 0.4 | 0.2 | 0.2 | 0.2 | |
| 62401 / Effingham / IL / 91.7 mi. | 427 | 7,650 | 5.6 | $39,180 | 2.4 | 1.0 | 0.3 | 0.2 | 0.5 | |
| 65251 / Fulton / MO / 96.3 mi. | 424 | 6,984 | 6.1 | $36,883 | 12.7 | 0.9 | 9.4 | 0.4 | 0.8 | |
| 62881 / Salem / IL / 67.8 mi. | 388 | 4,672 | 8.3 | $36,613 | 2.9 | 0.6 | 0.5 | 0.2 | 0.8 | |
| 65265 / Mexico / MO / 99.2 mi. | 386 | 6,419 | 6.0 | $32,971 | 9.1 | 0.8 | 6.8 | 0.2 | 0.5 | |
| 65041 / Hermann / MO / 70.3 mi. | 382 | 2,422 | 15.8 | $37,877 | 1.6 | 0.4 | 0.4 | 0.2 | 0.1 | |
| 63348 / Foristell / MO / 41.2 mi. | 381 | 1,542 | 24.7 | $61,771 | 2.1 | 0.6 | 0.9 | 0.1 | 0.1 | |
| 65020 / Camdenton / MO / 145.7 mi. | 370 | 4,897 | 7.6 | $31,992 | 3.6 | 1.2 | 0.2 | 0.5 | 0.5 | |
| 62088 / Staunton / IL / 35.6 mi. | 368 | 2,728 | 13.5 | $36,241 | 1.6 | 0.6 | 0.1 | 0.2 | 0.3 | |
| 63390 / Wright City / MO / 46.7 mi. | 365 | 2,598 | 14.0 | $41,688 | 8.4 | 2.1 | 4.5 | 0.4 | 0.1 | |
| 63019 / Crystal City / MO / 29.4 mi. | 364 | 1,639 | 22.2 | $36,049 | 8.2 | 0.5 | 5.3 | 0.2 | 0.5 | |
| 63501 / Kirksville / MO / 168.7 mi. | 360 | 8,142 | 4.4 | $25,755 | 5.5 | 1.3 | 1.4 | 0.2 | 1.6 | |
| 62062 / Maryville / IL / 14.9 mi. | 360 | 1,657 | 21.7 | $55,440 | 7.0 | 1.9 | 3.4 | 0.1 | 0.5 | |
| 62060 / Madison / IL / 4.1 mi. | 351 | 2,403 | 14.6 | $23,900 | 57.0 | 1.8 | 53.7 | 0.3 | 0.2 | |
| 63901 / Poplar Bluff / MO / 128.6 mi. | 348 | 13,303 | 2.6 | $27,359 | 9.0 | 1.1 | 5.6 | 0.5 | 0.5 | |
| 62901 / Carbondale / IL / 82.7 mi. | 339 | 14,034 | 2.4 | $19,873 | 28.4 | 3.1 | 17.6 | 0.2 | 5.3 | |
| 62233 / Chester / IL / 52.3 mi. | 339 | 2,564 | 13.2 | $40,703 | 4.7 | 0.6 | 2.9 | 0.1 | 0.3 | |
| 63068 / New Haven / MO / 57.8 mi. | 332 | 1,641 | 20.2 | $42,823 | 1.6 | 0.5 | 0.4 | 0.2 | 0.0 | |
| 63077 / Saint Clair / MO / 47.6 mi. | 316 | 4,192 | 7.5 | $39,792 | 2.8 | 0.6 | 0.8 | 0.3 | 0.2 | |
| 65270 / Moberly / MO / 130.8 mi. | 315 | 6,374 | 4.9 | $30,349 | 12.5 | 1.3 | 9.2 | 0.4 | 0.5 | |
| 61920 / Charleston / IL / 125.7 mi. | 312 | 9,035 | 3.5 | $28,034 | 7.7 | 1.7 | 3.7 | 0.2 | 1.3 | |
| 62052 / Jerseyville / IL / 35.2 mi. | 312 | 4,757 | 6.6 | $41,149 | 1.4 | 0.5 | 0.1 | 0.1 | 0.2 | |
| 62056 / Litchfield / IL / 47.3 mi. | 286 | 3,544 | 8.1 | $31,478 | 2.2 | 0.8 | 0.3 | 0.2 | 0.3 | |
| 63016 / Cedar Hill / MO / 31.4 mi. | 286 | 2,685 | 10.7 | $46,897 | 2.1 | 0.7 | 0.0 | 0.3 | 0.3 | |
| 63106 / Saint Louis / MO / 1.2 mi. | 285 | 4,214 | 6.8 | $10,491 | 96.6 | 0.7 | 94.5 | 0.3 | 0.1 | |
| 63353 / Louisiana / MO / 72.2 mi. | 279 | 2,117 | 13.2 | $31,936 | 10.0 | 4.0 | 4.4 | 0.3 | 0.3 | |
| 62049 / Hillsboro / IL / 51.2 mi. | 273 | 2,759 | 9.9 | $35,491 | 2.5 | 0.9 | 0.8 | 0.2 | 0.3 | |
| 63664 / Potosi / MO / 61.2 mi. | 271 | 3,292 | 8.2 | $25,993 | 3.4 | 0.9 | 0.8 | 0.5 | 0.2 | |
| 65559 / Saint James / MO / 87.9 mi. | 271 | 3,299 | 8.2 | $27,903 | 5.0 | 0.8 | 0.8 | 0.5 | 0.3 | |
| 62959 / Marion / IL / 94.1 mi. | 269 | 10,087 | 2.7 | $33,100 | 7.3 | 1.6 | 4.0 | 0.2 | 0.6 | |
| 65233 / Boonville / MO / 139.4 mi. | 267 | 3,761 | 7.1 | $37,127 | 15.9 | 1.0 | 12.8 | 0.4 | 0.3 | |
| 65453 / Cuba / MO / 75.2 mi. | 263 | 3,156 | 8.3 | $30,062 | 2.8 | 1.2 | 0.2 | 0.4 | 0.2 | |
| 65560 / Salem / MO / 103.9 mi. | 263 | 5,402 | 4.9 | $27,011 | 3.1 | 0.7 | 0.4 | 0.6 | 0.2 | |
| 62230 / Breese / IL / 36.2 mi. | 260 | 2,082 | 12.5 | $48,279 | 2.0 | 1.2 | 0.1 | 0.0 | 0.3 | |
| 62231 / Carlyle / IL / 44.5 mi. | 260 | 2,683 | 9.7 | $42,273 | 4.4 | 0.8 | 2.6 | 0.1 | 0.3 | |
| 62471 / Vandalia / IL / 60.8 mi. | 259 | 3,574 | 7.2 | $32,489 | 12.4 | 1.3 | 10.3 | 0.1 | 0.2 | |
| 63334 / Bowling Green / MO / 71.8 mi. | 259 | 2,320 | 11.2 | $33,224 | 17.9 | 0.7 | 15.7 | 0.2 | 0.2 | |
| 63023 / Dittmer / MO / 34.9 mi. | 255 | 1,896 | 13.4 | $42,833 | 2.1 | 0.5 | 0.2 | 0.4 | 0.2 | |
| 62263 / Nashville / IL / 48.6 mi. | 253 | 2,128 | 11.9 | $43,000 | 1.9 | 0.9 | 0.2 | 0.1 | 0.3 | |
| 63070 / Pevely / MO / 27.2 mi. | 251 | 2,164 | 11.6 | $38,556 | 3.9 | 0.9 | 1.2 | 0.4 | 0.4 | |
| 63645 / Fredericktown / MO / 78.9 mi. | 241 | 4,285 | 5.6 | $26,014 | 1.9 | 0.5 | 0.1 | 0.2 | 0.3 | |
| 63341 / Defiance / MO / 33.9 mi. | 239 | 1,097 | 21.8 | $69,602 | 2.3 | 0.6 | 0.6 | 0.3 | 0.4 | |
| 65806 / Springfield / MO / 195.8 mi. | 238 | 5,314 | 4.5 | $15,484 | 15.4 | 3.4 | 5.3 | 1.3 | 2.3 | |
| 63755 / Jackson / MO / 90.7 mi. | 227 | 7,887 | 2.9 | $42,070 | 3.4 | 0.8 | 1.0 | 0.3 | 0.4 | |
| 62260 / Millstadt / IL / 15.6 mi. | 225 | 2,287 | 9.8 | $54,273 | 2.3 | 0.6 | 0.5 | 0.3 | 0.2 | |
| 62626 / Carlinville / IL / 46.2 mi. | 218 | 3,234 | 6.7 | $36,890 | 3.4 | 0.7 | 1.5 | 0.2 | 0.3 | |
| 62837 / Fairfield / IL / 101.2 mi. | 213 | 3,905 | 5.5 | $30,630 | 1.6 | 0.5 | 0.1 | 0.1 | 0.5 | |
| 62204 / East Saint Louis / IL / 5.5 mi. | 211 | 3,432 | 6.1 | $18,000 | 96.7 | 1.6 | 94.3 | 0.2 | 0.1 | |
| 62707 / Springfield / IL / 83 mi. | 209 | 10,233 | 2.0 | $66,056 | 5.9 | 0.9 | 2.6 | 0.1 | 1.5 | |
| 65049 / Lake Ozark / MO / 136.6 mi. | 208 | 2,215 | 9.4 | $44,293 | 2.7 | 1.2 | 0.1 | 0.3 | 0.3 | |
| 62286 / Sparta / IL / 44.1 mi. | 207 | 2,538 | 8.2 | $34,279 | 15.3 | 1.2 | 12.0 | 0.3 | 0.4 | |
| 63133 / Saint Louis / MO / 7 mi. | 205 | 3,061 | 6.7 | $23,733 | 89.5 | 0.9 | 86.3 | 0.3 | 0.6 | |
| 63841 / Dexter / MO / 130.9 mi. | 200 | 5,369 | 3.7 | $27,712 | 2.7 | 0.9 | 0.2 | 0.4 | 0.2 | |
| 65583 / Waynesville / MO / 127.3 mi. | 198 | 5,450 | 3.6 | $37,684 | 25.5 | 4.2 | 12.3 | 0.9 | 3.9 | |
| 62450 / Olney / IL / 113.7 mi. | 197 | 5,033 | 3.9 | $31,015 | 2.5 | 0.8 | 0.3 | 0.1 | 0.6 | |
| 63343 / Elsberry / MO / 50.8 mi. | 196 | 1,672 | 11.7 | $33,297 | 6.1 | 2.4 | 1.9 | 0.5 | 0.2 | |
| 62254 / Lebanon / IL / 23.2 mi. | 194 | 1,892 | 10.3 | $42,257 | 17.3 | 1.4 | 13.4 | 0.3 | 0.6 | |
| 62948 / Herrin / IL / 85.8 mi. | 194 | 5,082 | 3.8 | $28,899 | 4.0 | 1.0 | 0.9 | 0.3 | 0.7 | |
| 63389 / Winfield / MO / 41.7 mi. | 190 | 1,624 | 11.7 | $47,612 | 2.7 | 0.6 | 0.4 | 0.2 | 0.4 | |
| 62278 / Red Bud / IL / 34.7 mi. | 189 | 2,567 | 7.4 | $45,955 | 1.5 | 0.5 | 0.0 | 0.1 | 0.3 | |
| 62703 / Springfield / IL / 83.5 mi. | 189 | 12,887 | 1.5 | $31,844 | 37.0 | 1.2 | 32.6 | 0.3 | 0.9 | |
| 65066 / Owensville / MO / 71.5 mi. | 189 | 2,538 | 7.4 | $34,375 | 1.4 | 0.4 | 0.1 | 0.2 | 0.2 | |
| 62239 / Dupo / IL / 9.4 mi. | 188 | 1,887 | 10.0 | $41,853 | 3.1 | 0.7 | 1.0 | 0.3 | 0.3 | |
| 63072 / Robertsville / MO / 38.6 mi. | 186 | 1,003 | 18.5 | $52,263 | 7.7 | 1.3 | 4.2 | 0.4 | 0.1 | |
| 63957 / Piedmont / MO / 105.4 mi. | 186 | 2,328 | 8.0 | $22,209 | 2.6 | 0.5 | 0.2 | 0.5 | 0.2 | |
| 62232 / Caseyville / IL / 10.2 mi. | 185 | 2,758 | 6.7 | $36,406 | 11.1 | 3.3 | 5.8 | 0.3 | 0.7 | |
| 63361 / Montgomery City / MO / 75.2 mi. | 179 | 1,750 | 10.2 | $33,258 | 4.7 | 0.5 | 2.6 | 0.3 | 0.1 | |
| 63627 / Bloomsdale / MO / 41.5 mi. | 179 | 1,009 | 17.7 | $41,250 | 1.7 | 0.7 | 0.0 | 0.2 | 0.0 | |
| 62258 / Mascoutah / IL / 26.1 mi. | 176 | 2,756 | 6.4 | $46,765 | 7.5 | 1.7 | 3.2 | 0.3 | 0.8 | |
| 63357 / Marthasville / MO / 47.8 mi. | 172 | 1,744 | 9.9 | $50,731 | 2.4 | 0.6 | 0.6 | 0.3 | 0.2 | |
| 62225 / Scott Air Force Base / IL / 19.3 mi. | 167 | 1,442 | 11.6 | $43,538 | 26.8 | 5.7 | 15.3 | 0.4 | 2.5 | |
| 65026 / Eldon / MO / 129.3 mi. | 165 | 4,967 | 3.3 | $30,559 | 2.6 | 1.0 | 0.3 | 0.5 | 0.2 | |
| 62265 / New Baden / IL / 29.6 mi. | 163 | 1,519 | 10.7 | $49,643 | 4.6 | 1.4 | 1.5 | 0.1 | 0.7 | |
| 62966 / Murphysboro / IL / 75.6 mi. | 162 | 6,545 | 2.5 | $32,585 | 16.1 | 2.2 | 11.2 | 0.4 | 0.9 | |
| 65441 / Bourbon / MO / 64.3 mi. | 159 | 1,670 | 9.5 | $36,151 | 1.8 | 0.8 | 0.0 | 0.2 | 0.1 | |
| 63650 / Ironton / MO / 75.5 mi. | 157 | 1,778 | 8.8 | $26,723 | 3.8 | 0.5 | 1.9 | 0.3 | 0.1 | |
| 62243 / Freeburg / IL / 22.6 mi. | 154 | 1,952 | 7.9 | $53,173 | 2.6 | 1.5 | 0.2 | 0.2 | 0.3 | |
| 62069 / Mount Olive / IL / 38.3 mi. | 153 | 1,418 | 10.8 | $35,896 | 1.6 | 0.7 | 0.0 | 0.3 | 0.1 | |
| 62914 / Cairo / IL / 122 mi. | 153 | 1,751 | 8.7 | $21,049 | 62.2 | 0.7 | 59.7 | 0.1 | 0.7 | |
| 65775 / West Plains / MO / 161.8 mi. | 152 | 9,047 | 1.7 | $27,321 | 4.2 | 1.3 | 0.4 | 0.8 | 0.5 | |
| 63834 / Charleston / MO / 128.5 mi. | 151 | 2,345 | 6.4 | $24,375 | 39.4 | 1.2 | 37.2 | 0.1 | 0.2 | |
| 63362 / Moscow Mills / MO / 46 mi. | 150 | 1,477 | 10.2 | $45,582 | 4.3 | 0.9 | 1.5 | 0.4 | 0.2 | |
| 63382 / Vandalia / MO / 81 mi. | 149 | 1,540 | 9.7 | $27,824 | 18.8 | 1.0 | 15.6 | 0.3 | 0.3 | |
| 62033 / Gillespie / IL / 39.3 mi. | 149 | 2,124 | 7.0 | $33,508 | 2.2 | 0.8 | 0.3 | 0.2 | 0.2 | |
| 65301 / Sedalia / MO / 165.6 mi. | 148 | 12,782 | 1.2 | $31,524 | 10.1 | 4.1 | 3.6 | 0.3 | 0.5 | |
| 62946 / Harrisburg / IL / 113.4 mi. | 147 | 5,770 | 2.5 | $29,615 | 8.0 | 1.1 | 5.3 | 0.3 | 0.3 | |
| 62205 / East Saint Louis / IL / 4.4 mi. | 145 | 3,807 | 3.8 | $26,092 | 98.9 | 0.7 | 97.6 | 0.1 | 0.0 | |
| 63830 / Caruthersville / MO / 173.2 mi. | 143 | 2,995 | 4.8 | $20,969 | 31.2 | 1.6 | 28.0 | 0.1 | 0.5 | |
| 65565 / Steelville / MO / 75.7 mi. | 143 | 2,080 | 6.9 | $26,917 | 2.4 | 0.5 | 0.1 | 0.7 | 0.3 | |
| 65536 / Lebanon / MO / 147 mi. | 140 | 10,421 | 1.3 | $30,074 | 3.9 | 1.3 | 0.5 | 0.4 | 0.4 | |
| 62960 / Metropolis / IL / 126.4 mi. | 137 | 4,774 | 2.9 | $31,727 | 7.6 | 0.6 | 5.3 | 0.2 | 0.3 | |
| 62245 / Germantown / IL / 35.7 mi. | 132 | 867 | 15.2 | $51,833 | 1.6 | 1.1 | 0.1 | 0.0 | 0.1 | |
| 63369 / Old Monroe / MO / 37.7 mi. | 131 | 708 | 18.5 | $47,500 | 2.0 | 1.1 | 0.5 | 0.2 | 0.1 | |
| 63384 / Wellsville / MO / 80.1 mi. | 131 | 793 | 16.5 | $29,079 | 6.1 | 0.8 | 3.6 | 0.1 | 0.1 | |
| 63857 / Kennett / MO / 166.3 mi. | 131 | 5,279 | 2.5 | $26,868 | 15.1 | 2.0 | 11.4 | 0.2 | 0.5 | |
| 62704 / Springfield / IL / 83.4 mi. | 130 | 19,444 | 0.7 | $42,963 | 12.3 | 1.3 | 7.3 | 0.2 | 2.1 | |
| 62012 / Brighton / IL / 28.9 mi. | 130 | 2,360 | 5.5 | $43,893 | 2.4 | 0.9 | 0.3 | 0.2 | 0.3 | |
| 62018 / Cottage Hills / IL / 20.3 mi. | 129 | 1,641 | 7.9 | $29,898 | 5.9 | 1.0 | 3.3 | 0.2 | 0.1 | |
| 62812 / Benton / IL / 80.3 mi. | 127 | 4,722 | 2.7 | $29,313 | 1.7 | 0.5 | 0.2 | 0.1 | 0.2 | |
| 62839 / Flora / IL / 91.2 mi. | 126 | 2,828 | 4.5 | $29,777 | 2.4 | 0.7 | 0.2 | 0.3 | 1.0 | |
| 65202 / Columbia / MO / 116.1 mi. | 125 | 14,271 | 0.9 | $38,916 | 18.6 | 2.0 | 11.5 | 0.5 | 2.2 | |
| 62009 / Benld / IL / 38.3 mi. | 125 | 873 | 14.3 | $31,308 | 3.0 | 0.9 | 0.7 | 0.2 | 0.0 | |
| 62650 / Jacksonville / IL / 76.7 mi. | 123 | 10,492 | 1.2 | $35,547 | 10.6 | 1.7 | 7.0 | 0.2 | 0.6 | |
| 62014 / Bunker Hill / IL / 30.7 mi. | 122 | 1,528 | 8.0 | $44,798 | 2.3 | 0.4 | 1.0 | 0.1 | 0.1 | |
| 65065 / Osage Beach / MO / 139.7 mi. | 121 | 2,199 | 5.5 | $42,369 | 3.4 | 0.8 | 0.8 | 0.5 | 0.6 | |
| 62832 / Du Quoin / IL / 66.9 mi. | 117 | 3,979 | 2.9 | $31,616 | 8.0 | 1.1 | 5.2 | 0.2 | 0.3 | |
| 63862 / Lilbourn / MO / 144.1 mi. | 116 | 705 | 16.5 | $24,479 | 32.1 | 1.0 | 30.2 | 0.1 | 0.0 | |
| 65459 / Dixon / MO / 110.2 mi. | 116 | 2,977 | 3.9 | $31,293 | 7.5 | 2.1 | 2.4 | 0.7 | 1.0 | |
| 63456 / Monroe City / MO / 107.4 mi. | 115 | 1,657 | 6.9 | $33,212 | 7.4 | 0.5 | 5.5 | 0.1 | 0.2 | |
| 62274 / Pinckneyville / IL / 57 mi. | 114 | 2,651 | 4.3 | $35,671 | 19.6 | 3.2 | 15.7 | 0.1 | 0.3 | |
| 63461 / Palmyra / MO / 108.3 mi. | 114 | 2,131 | 5.3 | $36,558 | 3.4 | 0.6 | 1.9 | 0.2 | 0.2 | |
| 62293 / Trenton / IL / 31.2 mi. | 113 | 1,727 | 6.5 | $52,052 | 2.3 | 1.1 | 0.2 | 0.1 | 0.6 | |
| 62288 / Steeleville / IL / 52.5 mi. | 110 | 1,236 | 8.9 | $35,504 | 1.4 | 0.6 | 0.0 | 0.1 | 0.4 | |
| 63771 / Oran / MO / 109.9 mi. | 108 | 1,094 | 9.9 | $29,899 | 13.0 | 1.3 | 10.8 | 0.2 | 0.0 | |
| 65473 / Fort Leonard Wood / MO / 119.3 mi. | 107 | 2,639 | 4.1 | $33,891 | 40.0 | 11.4 | 21.3 | 1.0 | 2.8 | |
| 62074 / New Douglas / IL / 33.8 mi. | 105 | 453 | 23.2 | $41,683 | 3.2 | 2.2 | 0.0 | 0.3 | 0.1 | |
| 63468 / Shelbina / MO / 123.4 mi. | 102 | 1,222 | 8.3 | $27,727 | 2.0 | 0.3 | 0.8 | 0.5 | 0.0 | |
| 63780 / Scott City / MO / 108.5 mi. | 100 | 2,485 | 4.0 | $35,667 | 2.1 | 0.7 | 0.3 | 0.3 | 0.0 | |
| 62001 / Alhambra / IL / 29.5 mi. | 98 | 573 | 17.1 | $46,833 | 1.6 | 0.8 | 0.0 | 0.1 | 0.0 | |
| 62363 / Pittsfield / IL / 72.8 mi. | 95 | 2,481 | 3.8 | $31,310 | 5.8 | 0.6 | 4.0 | 0.3 | 0.4 | |
| 63624 / Bismarck / MO / 64.5 mi. | 95 | 1,410 | 6.7 | $26,576 | 2.5 | 1.0 | 0.1 | 0.3 | 0.1 | |
| 63863 / Malden / MO / 143.4 mi. | 95 | 2,783 | 3.4 | $24,480 | 20.2 | 1.1 | 17.1 | 0.3 | 0.3 | |
| 65566 / Viburnum / MO / 80.6 mi. | 95 | 343 | 27.7 | $33,088 | 1.9 | 0.3 | 0.1 | 0.7 | 0.0 | |
| 63055 / Labadie / MO / 37.6 mi. | 94 | 634 | 14.8 | $62,083 | 1.1 | 0.3 | 0.0 | 0.2 | 0.2 | |
| 62047 / Hardin / IL / 41.3 mi. | 94 | 610 | 15.4 | $31,681 | 1.5 | 0.8 | 0.0 | 0.5 | 0.1 | |
| 62896 / West Frankfort / IL / 83.9 mi. | 93 | 5,486 | 1.7 | $28,912 | 2.0 | 0.7 | 0.2 | 0.2 | 0.3 | |
| 62906 / Anna / IL / 96.6 mi. | 93 | 3,119 | 3.0 | $28,815 | 4.4 | 1.4 | 1.5 | 0.3 | 0.4 | |
| 62271 / Okawville / IL / 40.9 mi. | 90 | 822 | 10.9 | $36,906 | 1.4 | 0.3 | 0.3 | 0.4 | 0.1 | |
| 62526 / Decatur / IL / 109.9 mi. | 83 | 15,676 | 0.5 | $32,178 | 19.1 | 1.3 | 15.3 | 0.2 | 0.7 | |
| 65240 / Centralia / MO / 112.8 mi. | 83 | 2,711 | 3.1 | $38,956 | 3.0 | 0.7 | 0.8 | 0.5 | 0.1 | |
| 62242 / Evansville / IL / 40.8 mi. | 83 | 561 | 14.8 | $33,950 | 1.8 | 0.6 | 0.8 | 0.0 | 0.2 | |
| 62044 / Greenfield / IL / 50.7 mi. | 73 | 826 | 8.8 | $33,250 | 1.4 | 0.4 | 0.1 | 0.5 | 0.1 | |
| 63373 / Portage des Sioux / MO / 23 mi. | 73 | 257 | 28.4 | $43,750 | 2.2 | 1.2 | 0.2 | 0.4 | 0.0 | |
| 63336 / Clarksville / MO / 62.9 mi. | 69 | 460 | 15.0 | $30,588 | 9.4 | 1.5 | 6.4 | 0.0 | 0.2 | |
| 65582 / Vienna / MO / 99.3 mi. | 69 | 860 | 8.0 | $33,542 | 1.9 | 0.1 | 0.0 | 0.7 | 0.2 | |
| 63764 / Marble Hill / MO / 93.1 mi. | 68 | 2,221 | 3.1 | $29,816 | 3.2 | 0.7 | 0.1 | 0.9 | 0.3 | |
| 62048 / Hartford / IL / 14.5 mi. | 68 | 638 | 10.7 | $33,203 | 1.7 | 0.7 | 0.1 | 0.1 | 0.4 | |
| 62016 / Carrollton / IL / 48.8 mi. | 67 | 1,573 | 4.3 | $33,371 | 1.2 | 0.3 | 0.1 | 0.2 | 0.2 | |
| 63873 / Portageville / MO / 155.5 mi. | 67 | 2,043 | 3.3 | $29,009 | 15.2 | 0.7 | 13.5 | 0.1 | 0.2 | |
| 65275 / Paris / MO / 115.5 mi. | 65 | 1,088 | 6.0 | $31,520 | 5.7 | 0.5 | 4.1 | 0.5 | 0.1 | |
| 62203 / East Saint Louis / IL / 6.7 mi. | 64 | 3,269 | 2.0 | $29,872 | 94.9 | 1.1 | 92.9 | 0.2 | 0.1 | |
| 62257 / Marissa / IL / 36.1 mi. | 63 | 1,512 | 4.2 | $36,838 | 1.7 | 0.6 | 0.2 | 0.1 | 0.2 | |
| 62822 / Christopher / IL / 74.4 mi. | 63 | 1,353 | 4.7 | $25,057 | 1.8 | 0.6 | 0.1 | 0.0 | 0.2 | |
| 62411 / Altamont / IL / 83.8 mi. | 62 | 1,576 | 3.9 | $36,292 | 0.8 | 0.3 | 0.1 | 0.1 | 0.0 | |
| 62895 / Wayne City / IL / 91.6 mi. | 62 | 874 | 7.1 | $33,311 | 1.5 | 0.4 | 0.1 | 0.2 | 0.1 | |
| 62237 / Coulterville / IL / 46.9 mi. | 62 | 1,263 | 4.9 | $32,932 | 2.8 | 0.4 | 1.0 | 0.0 | 0.3 | |
| 63377 / Silex / MO / 58.6 mi. | 60 | 783 | 7.7 | $37,865 | 2.8 | 0.8 | 0.8 | 0.4 | 0.1 | |
| 63435 / Canton / MO / 132.2 mi. | 60 | 1,465 | 4.1 | $32,910 | 4.4 | 1.3 | 1.6 | 0.2 | 0.5 | |
| 63638 / Ellington / MO / 104.5 mi. | 60 | 1,201 | 5.0 | $26,888 | 5.3 | 1.0 | 0.1 | 1.4 | 0.3 | |
| 62262 / Mulberry Grove / IL / 56.6 mi. | 59 | 759 | 7.8 | $34,519 | 10.6 | 1.0 | 8.5 | 0.1 | 0.2 | |
| 63039 / Gray Summit / MO / 35.7 mi. | 59 | 308 | 19.2 | $45,515 | 2.6 | 0.5 | 0.2 | 0.0 | 0.4 | |
| 65483 / Houston / MO / 132.4 mi. | 54 | 1,987 | 2.7 | $24,651 | 4.5 | 1.3 | 0.1 | 0.6 | 0.2 | |
| 62075 / Nokomis / IL / 67.7 mi. | 54 | 1,520 | 3.6 | $32,453 | 1.1 | 0.2 | 0.1 | 0.2 | 0.1 | |
| 63349 / Hawk Point / MO / 55.6 mi. | 53 | 492 | 10.8 | $32,500 | 2.9 | 0.4 | 1.2 | 0.1 | 0.2 | |
| 63363 / New Florence / MO / 74.3 mi. | 53 | 604 | 8.8 | $32,500 | 3.2 | 0.9 | 1.3 | 0.5 | 0.1 | |
| 63825 / Bloomfield / MO / 119.3 mi. | 53 | 1,737 | 3.1 | $27,307 | 2.6 | 0.7 | 0.5 | 0.5 | 0.1 | |
| 63332 / Augusta / MO / 37.3 mi. | 52 | 448 | 11.6 | $56,563 | 1.9 | 0.6 | 0.3 | 0.1 | 0.3 | |
| 65542 / Licking / MO / 118.9 mi. | 52 | 1,929 | 2.7 | $23,730 | 3.6 | 1.2 | 0.0 | 1.1 | 0.2 | |
| 62090 / Venice / IL / 2.9 mi. | 52 | 574 | 9.1 | $17,368 | 91.9 | 0.7 | 90.6 | 0.1 | 0.0 | |
| 65051 / Linn / MO / 86.4 mi. | 51 | 1,797 | 2.8 | $39,964 | 1.9 | 0.3 | 0.1 | 0.4 | 0.2 | |
| 62264 / New Athens / IL / 29.3 mi. | 50 | 1,226 | 4.1 | $41,974 | 2.3 | 0.7 | 0.5 | 0.2 | 0.4 | |
| 62275 / Pocahontas / IL / 38.4 mi. | 50 | 1,386 | 3.6 | $38,819 | 2.7 | 0.6 | 0.4 | 0.4 | 0.3 | |
| 62032 / Fillmore / IL / 57.7 mi. | 49 | 292 | 16.8 | $33,929 | 1.8 | 0.8 | 0.0 | 0.1 | 0.1 | |
| 62218 / Bartelso / IL / 40.8 mi. | 48 | 480 | 10.0 | $55,185 | 1.6 | 0.1 | 0.1 | 0.0 | 0.2 | |
| 62061 / Marine / IL / 22.4 mi. | 47 | 559 | 8.4 | $40,647 | 1.9 | 0.6 | 0.1 | 0.2 | 0.1 | |
| 62285 / Smithton / IL / 16.9 mi. | 46 | 1,088 | 4.2 | $54,688 | 2.4 | 0.4 | 0.5 | 0.3 | 0.5 | |
| 62281 / Saint Jacob / IL / 28.6 mi. | 44 | 632 | 7.0 | $52,262 | 2.8 | 1.5 | 0.3 | 0.3 | 0.1 | |
| 63459 / New London / MO / 89.9 mi. | 43 | 1,455 | 3.0 | $37,500 | 3.3 | 0.4 | 2.0 | 0.1 | 0.1 | |
| 63091 / Rosebud / MO / 66.9 mi. | 41 | 483 | 8.5 | $36,250 | 2.4 | 0.2 | 0.1 | 0.2 | 0.5 | |
| 62084 / Roxana / IL / 16.3 mi. | 41 | 613 | 6.7 | $39,050 | 1.8 | 0.7 | 0.1 | 0.3 | 0.2 | |
| 62859 / Mc Leansboro / IL / 99 mi. | 39 | 2,302 | 1.7 | $28,622 | 2.4 | 0.6 | 1.0 | 0.1 | 0.2 | |
| 63347 / Foley / MO / 43.2 mi. | 37 | 913 | 4.1 | $40,543 | 5.3 | 1.5 | 1.5 | 0.5 | 0.1 | |
| 63388 / Williamsburg / MO / 81.7 mi. | 35 | 247 | 14.2 | $38,289 | 7.1 | 1.3 | 2.7 | 0.9 | 0.0 | |
| 63462 / Perry / MO / 94.9 mi. | 35 | 606 | 5.8 | $34,273 | 2.2 | 0.4 | 0.6 | 0.6 | 0.2 | |
| 65013 / Belle / MO / 88.2 mi. | 34 | 1,327 | 2.6 | $31,075 | 3.1 | 0.8 | 0.2 | 0.5 | 0.1 | |
| 62568 / Taylorville / IL / 78.9 mi. | 33 | 6,242 | 0.5 | $37,775 | 7.2 | 1.5 | 4.4 | 0.2 | 0.6 | |
| 62215 / Albers / IL / 31.8 mi. | 32 | 404 | 7.9 | $48,500 | 10.0 | 8.1 | 0.3 | 0.5 | 0.4 | |
| 62087 / South Roxana / IL / 15.2 mi. | 31 | 707 | 4.4 | $33,295 | 2.9 | 0.9 | 0.3 | 0.4 | 0.3 | |
| 62694 / Winchester / IL / 69.5 mi. | 31 | 1,346 | 2.3 | $36,111 | 0.6 | 0.1 | 0.1 | 0.2 | 0.2 | |
| 63351 / Jonesburg / MO / 62.5 mi. | 31 | 626 | 5.0 | $27,857 | 4.6 | 1.1 | 1.6 | 0.4 | 0.3 | |
| 62207 / East Saint Louis / IL / 4.8 mi. | 30 | 3,534 | 0.8 | $19,776 | 98.2 | 0.5 | 96.7 | 0.1 | 0.1 | |
| 20024 / Washington / DC / 709.4 mi. | 29 | 6,875 | 0.4 | $37,035 | 75.2 | 4.4 | 64.3 | 0.4 | 2.6 | |
| 62884 / Sesser / IL / 71.1 mi. | 29 | 1,292 | 2.2 | $27,713 | 1.8 | 0.9 | 0.1 | 0.4 | 0.0 | |
| File | mo_st_louis_post-dispatch | |||||||||
| Time | 5/17/05 6:10 PM | |||||||||
| Page | 28 | |||||||||
| Member | 125150 | |||||||||