
|
| Comparing the racial diversity of the journalists | ||||||||||
| at America's daily newspapers | ||||||||||
| with the communities that they serve | ||||||||||
| Newsroom diversity report for | ||||||||||
| Columbia Daily Tribune | ||||||||||
| Columbia, Missouri | ||||||||||
| From a report for the Knight Foundation | ||||||||||
| by Bill Dedman and Stephen K. Doig, June 2005 | ||||||||||
| Click here to read the national report or to select another newspaper | ||||||||||
| Year | Non-white % of newsroom staff | 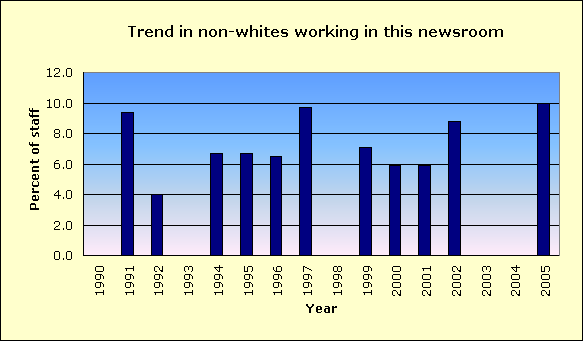
|
||||||||
| 2005 | 10.0 | |||||||||
| 2004 | Did not report | |||||||||
| 2003 | Did not report | |||||||||
| 2002 | 8.8 | |||||||||
| 2001 | 5.9 | |||||||||
| 2000 | 5.9 | |||||||||
| 1999 | 7.1 | |||||||||
| 1998 | 0.0 | |||||||||
| 1997 | 9.7 | |||||||||
| 1996 | 6.5 | |||||||||
| 1995 | 6.7 | |||||||||
| 1994 | 6.7 | |||||||||
| 1993 | Did not report | |||||||||
| 1992 | 4.0 | |||||||||
| 1991 | 9.4 | |||||||||
| 1990 | Did not report | |||||||||
| The latest year at peak is | 2005 | |||||||||
| See the notes and definitions section below for the sources of these figures. | ||||||||||
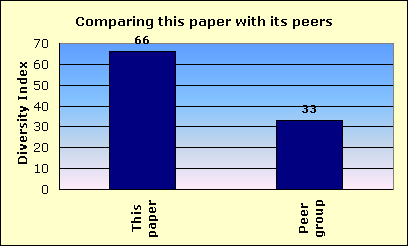
| Newsroom Diversity Index | ||||||||||
| for Columbia Daily Tribune | ||||||||||
| Year | Non-white % of newsroom staff | Non-white % of circulation area | Newsroom Diversity Index (parity=100) | |||||||
| 2005 | 10.0 | 15.1 | 66 | |||||||
| 2004 | N/A | 15.1 | N/A | |||||||
| How the index is calculated | ||||||||||
| The Newsroom Diversity Index is the non-white percentage of the newsroom staff | ||||||||||
| divided by the non-white percentage of residents in the circulation area. | ||||||||||
| (Parity = 100.) | ||||||||||
| See the notes and definitions section below for the sources of these figures. | ||||||||||
| Peer group comparison | ||||||||||
| for Columbia Daily Tribune | ||||||||||
 |
||||||||||
| This newspaper's Newsroom Diversity Index is 66. | This paper | |||||||||
| Peer group | ||||||||||
| Compare that with 33, which is the median Diversity Index for all newspapers | ||||||||||
| reporting in this circulation category of 10,001 to 25,000 daily sales. | ||||||||||
| In that group, this newspaper's Diversity Index ranks 61 out of 259 | ||||||||||
| newspapers reporting in the category of 10,001 to 25,000 daily sales. | ||||||||||
| An example of a newspaper of similar circulation, in an area of similar level of non-white residents, but one that has a relatively high Diversity Index, is Enterprise Ledger, Alabama, with a 16.7 percent non-white staff in a community that is 24.4 percent non-white. Its index is 68. | ||||||||||
| FYI, in circulation, this newspaper's average weekday circulation of | ||||||||||
| approximately 18,447 ranks 516 out of 1,410 daily newspapers in the US. | ||||||||||
| See the notes and definitions section below for the sources of these figures. | ||||||||||
| Details on race/ethnicity | ||||||||||
| in the circulation area | ||||||||||
| and the home county | ||||||||||
| of Columbia Daily Tribune | ||||||||||
| Circulation area | ||||||||||
| Race/ethnicity | % of population | Number of residents | 
|
|||||||
| Hispanic | 1.7 | 2,499 | ||||||||
| Black | 8.4 | 12,203 | ||||||||
| Asian and Pacific Islander | 2.8 | 4,055 | ||||||||
| Native-American | 0.4 | 560 | ||||||||
| Other non-white | 0.2 | 258 | ||||||||
| Multi-racial | 1.7 | 2,489 | ||||||||
| Non-white | 15.1 | 22,064 | ||||||||
| White | 84.9 | 124,054 | ||||||||
| Total | 146,118 | |||||||||
| Home county: Boone | ||||||||||
| Race/ethnicity | % of population | Number of residents | 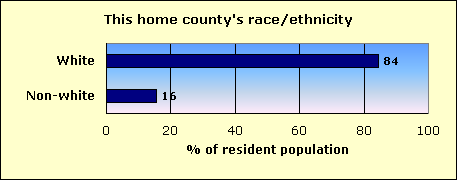
|
|||||||
| Hispanic | 1.8 | 2,413 | ||||||||
| Black | 8.5 | 11,479 | ||||||||
| Asian and Pacific Islander | 3.0 | 4,040 | ||||||||
| Native-American | 0.4 | 524 | ||||||||
| Other non-white | 0.2 | 255 | ||||||||
| Multi-racial | 1.8 | 2,376 | ||||||||
| Non-white | 15.6 | 21,087 | ||||||||
| White | 84.4 | 114,367 | ||||||||
| Total | 135,454 | |||||||||
| The home county of this newspaper is Boone. | ||||||||||
| About this report | ||||||||||
| This third annual report for the Knight Foundation adds context to an annual survey by the American Society of Newspaper Editors. ASNE has set a goal that | ||||||||||
| every newspaper, to help it know its community and gather the news, should employ at least one non-white journalist, and that newspapers should strive to | ||||||||||
| employ non-whites in proportion to their share of the community. ASNE's report, at www.asne.org, shows each newspaper's non-white employment, but does | ||||||||||
| not disclose how closely that employment mirrors the newspaper's circulation area. | ||||||||||
| That gap is filled by the report you are reading now. This report was not done by ASNE, but was done for the Knight Foundation by Bill Dedman and | ||||||||||
| Stephen K. Doig. It shows how close each newspaper is to ASNE's goal, by comparing the newsroom staffing with the circulation area population. | ||||||||||
| The full report is at www.powerreporting.com/knight. | ||||||||||
| Notes and definitions | ||||||||||
| 1. The Newsroom Diversity Index is the non-white percentage of the newsroom staff divided by the non-white percentage of the circulation area's residents. Parity = 100. | ||||||||||
| 2. Source for staffing: Survey by American Society of Newspaper Editors, April 2005. Newspapers report non-white staff as of the end of the previous year. | ||||||||||
| 3. Following ASNE's definition, newsroom staff includes only supervisors, reporters, editors, copy/layout editors and photographers. | ||||||||||
| 4. Also following ASNE's definition, "whites," "blacks," etc., exclude Hispanics, who are counted in a separate category. | ||||||||||
| 5. Source for boundaries of this newspaper's circulation area: ZIP Code circulation data, Audit Bureau of Circulations, latest available. | ||||||||||
| 6. A paper may define its circulation area differently for marketing efforts, or news coverage, or to set advertising rates. | ||||||||||
| 7. If ZIP Codes or counties are used, this report applies a threshold: 10 percent household penetration is required to include an area in the circulation area. | ||||||||||
| 8. Source for the demographics of residents of that circulation area: US Census 2000. | ||||||||||
| 9. Source for total circulation: Editor & Publisher magazine, Monday-Friday average at year-end 2004. | ||||||||||
| 10. Staff of non-English publications, such as the Miami Herald's El Nuevo Herald, are excluded from the ASNE staffing survey for the first time this year. | ||||||||||
| Demographics of ZIP Codes | ||||||||||
| where sales were reported by | ||||||||||
| Columbia Daily Tribune | ||||||||||
| Note that some ZIP Codes listed here may not have been included in determining the newspaper's circulation area. In calculating the Diversity Index, a | ||||||||||
| ZIP Code was included only if the household penetration was at least 10 percent. Any lower-penetration ZIP Codes are also listed here for your information. | ||||||||||
| Also, if the newspaper reported more than 300 ZIP Codes, only the top 300 in weekday sales are listed here. | ||||||||||
| ZIP / City / State / Approx. distance in miles from the newspaper's home office | Weekday sales | Households | Penetration % (daily sales per 100 households) | Median household income | Non-white % of population |
Hispanic % of population |
Black % of population |
Native % of population |
Asian % of population |
|
| 65203 / Columbia / MO / 8.4 mi. | 7,342 | 18,673 | 39.3 | $42,685 | 18.5 | 2.0 | 10.3 | 0.3 | 3.9 | |
| 65202 / Columbia / MO / 9 mi. | 3,791 | 14,271 | 26.6 | $38,916 | 18.6 | 2.0 | 11.5 | 0.5 | 2.2 | |
| 65201 / Columbia / MO / 0 mi. | 3,491 | 12,610 | 27.7 | $26,955 | 15.8 | 1.9 | 7.5 | 0.4 | 4.2 | |
| 65010 / Ashland / MO / 8 mi. | 462 | 1,539 | 30.0 | $45,739 | 2.9 | 1.2 | 0.4 | 0.3 | 0.3 | |
| 65240 / Centralia / MO / 21.5 mi. | 459 | 2,711 | 16.9 | $38,956 | 3.0 | 0.7 | 0.8 | 0.5 | 0.1 | |
| 65233 / Boonville / MO / 28.1 mi. | 375 | 3,761 | 10.0 | $37,127 | 15.9 | 1.0 | 12.8 | 0.4 | 0.3 | |
| 65248 / Fayette / MO / 26.1 mi. | 335 | 1,648 | 20.3 | $32,138 | 14.6 | 0.8 | 11.8 | 0.4 | 0.2 | |
| 65255 / Hallsville / MO / 14.1 mi. | 335 | 1,140 | 29.4 | $39,022 | 3.1 | 0.7 | 0.9 | 0.6 | 0.2 | |
| 65279 / Rocheport / MO / 15.8 mi. | 299 | 573 | 52.2 | $43,646 | 3.9 | 0.6 | 0.8 | 0.7 | 0.8 | |
| 65251 / Fulton / MO / 15.5 mi. | 285 | 6,984 | 4.1 | $36,883 | 12.7 | 0.9 | 9.4 | 0.4 | 0.8 | |
| 65284 / Sturgeon / MO / 20.6 mi. | 190 | 857 | 22.2 | $36,399 | 3.3 | 1.0 | 0.6 | 0.5 | 0.3 | |
| 65256 / Harrisburg / MO / 19.7 mi. | 156 | 571 | 27.3 | $50,430 | 1.7 | 0.2 | 0.3 | 0.3 | 0.0 | |
| 65039 / Hartsburg / MO / 13.4 mi. | 138 | 832 | 16.6 | $55,000 | 3.1 | 0.9 | 0.3 | 0.7 | 0.1 | |
| 65270 / Moberly / MO / 38.1 mi. | 136 | 6,374 | 2.1 | $30,349 | 12.5 | 1.3 | 9.2 | 0.4 | 0.5 | |
| 65265 / Mexico / MO / 27.3 mi. | 116 | 6,419 | 1.8 | $32,971 | 9.1 | 0.8 | 6.8 | 0.2 | 0.5 | |
| 65254 / Glasgow / MO / 37.6 mi. | 97 | 794 | 12.2 | $31,506 | 7.3 | 0.6 | 5.8 | 0.2 | 0.1 | |
| 65274 / New Franklin / MO / 27.4 mi. | 93 | 704 | 13.2 | $33,073 | 3.6 | 1.4 | 0.7 | 0.1 | 0.4 | |
| 65243 / Clark / MO / 27.9 mi. | 63 | 782 | 8.1 | $32,500 | 3.8 | 1.2 | 0.3 | 0.7 | 0.2 | |
| 65101 / Jefferson City / MO / 28 mi. | 49 | 10,119 | 0.5 | $40,663 | 20.2 | 1.2 | 16.4 | 0.4 | 0.8 | |
| 65231 / Auxvasse / MO / 22 mi. | 33 | 1,172 | 2.8 | $37,154 | 3.5 | 0.4 | 1.6 | 0.5 | 0.2 | |
| 65262 / Kingdom City / MO / 15.6 mi. | 25 | 198 | 12.6 | $36,389 | 5.2 | 1.4 | 2.4 | 0.4 | 0.0 | |
| File | mo_columbia_daily_tribune | |||||||||
| Time | 5/21/05 11:48 AM | |||||||||
| Page | 515 | |||||||||
| Member | 124500 | |||||||||