
|
| Comparing the racial diversity of the journalists | ||||||||||
| at America's daily newspapers | ||||||||||
| with the communities that they serve | ||||||||||
| Newsroom diversity report for | ||||||||||
| The Detroit News | ||||||||||
| Detroit, Michigan | ||||||||||
| Owner: Gannett Co. (Va.) | ||||||||||
| From a report for the Knight Foundation | ||||||||||
| by Bill Dedman and Stephen K. Doig, June 2005 | ||||||||||
| Click here to read the national report or to select another newspaper | ||||||||||
| Year | Non-white % of newsroom staff | 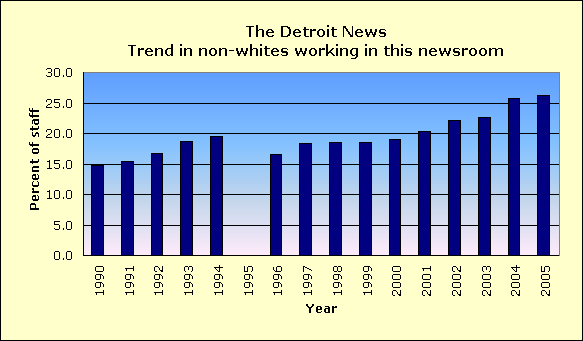
|
||||||||
| 2005 | 26.2 | |||||||||
| 2004 | 25.7 | |||||||||
| 2003 | 22.7 | |||||||||
| 2002 | 22.1 | |||||||||
| 2001 | 20.4 | |||||||||
| 2000 | 19.0 | |||||||||
| 1999 | 18.5 | |||||||||
| 1998 | 18.6 | |||||||||
| 1997 | 18.3 | |||||||||
| 1996 | 16.5 | |||||||||
| 1995 | Did not report | |||||||||
| 1994 | 19.5 | |||||||||
| 1993 | 18.7 | |||||||||
| 1992 | 16.8 | |||||||||
| 1991 | 15.4 | |||||||||
| 1990 | 14.7 | |||||||||
| The latest year at peak is | 2005 | |||||||||
| See the notes and definitions section below for the sources of these figures. | ||||||||||
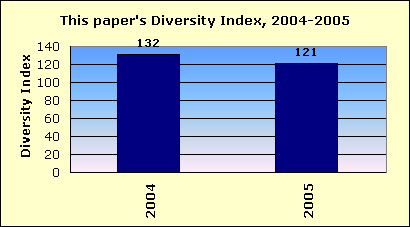
| Newsroom Diversity Index | ||||||||||
| for The Detroit News | ||||||||||
 |
||||||||||
| Year | Non-white % of newsroom staff | Non-white % of circulation area | Newsroom Diversity Index (parity=100) | |||||||
| 2005 | 26.2 | 21.6 | 121 | |||||||
| 2004 | 25.7 | 19.5 | 132 | |||||||
| How the index is calculated | ||||||||||
| The Newsroom Diversity Index is the non-white percentage of the newsroom staff | ||||||||||
| divided by the non-white percentage of residents in the circulation area. | ||||||||||
| (Parity = 100.) | ||||||||||
| Company index | ||||||||||
| This newspaper's owner, Gannett Co. (Va.), | ||||||||||
| has a companywide, circulation-weighted Diversity Index of 89. | ||||||||||
| See the notes and definitions section below for the sources of these figures. | ||||||||||
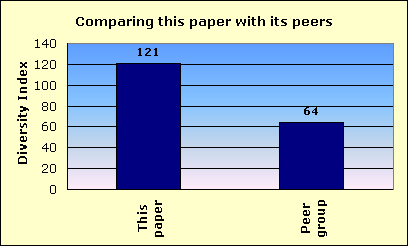
| Peer group comparison | ||||||||||
| for The Detroit News | ||||||||||
 |
||||||||||
| This newspaper's Newsroom Diversity Index is 121. | This paper | |||||||||
| Peer group | ||||||||||
| Compare that with 64, which is the median Diversity Index for all newspapers | ||||||||||
| reporting in this circulation category of 100,001 to 250,000 daily sales. | ||||||||||
| In that group, this newspaper's Diversity Index ranks 6 out of 58 | ||||||||||
| newspapers reporting in the category of 100,001 to 250,000 daily sales. | ||||||||||
| FYI, in circulation, this newspaper's average weekday circulation of | ||||||||||
| approximately 224,215 ranks 46 out of 1,410 daily newspapers in the US. | ||||||||||
| See the notes and definitions section below for the sources of these figures. | ||||||||||
| Details on race/ethnicity | ||||||||||
| in the circulation area | ||||||||||
| and the home county | ||||||||||
| of The Detroit News | ||||||||||
| Circulation area | ||||||||||
| Race/ethnicity | % of population | Number of residents | 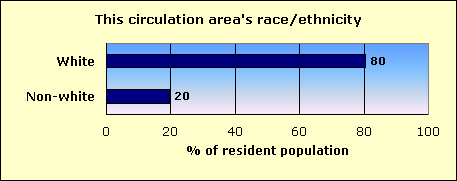
|
|||||||
| Hispanic | 2.0 | 54,424 | ||||||||
| Black | 12.1 | 322,664 | ||||||||
| Asian and Pacific Islander | 3.0 | 81,096 | ||||||||
| Native-American | 0.3 | 7,556 | ||||||||
| Other non-white | 0.1 | 3,435 | ||||||||
| Multi-racial | 1.9 | 51,911 | ||||||||
| Non-white | 19.5 | 521,086 | ||||||||
| White | 80.5 | 2,147,912 | ||||||||
| Total | 2,668,998 | |||||||||
| Home county: Wayne | ||||||||||
| Race/ethnicity | % of population | Number of residents | 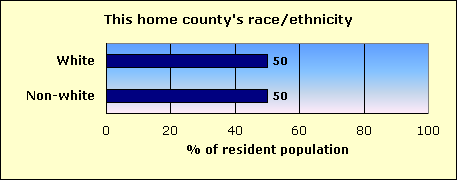
|
|||||||
| Hispanic | 3.8 | 77,207 | ||||||||
| Black | 42.0 | 864,627 | ||||||||
| Asian and Pacific Islander | 1.7 | 35,235 | ||||||||
| Native-American | 0.3 | 6,582 | ||||||||
| Other non-white | 0.2 | 3,191 | ||||||||
| Multi-racial | 2.2 | 45,336 | ||||||||
| Non-white | 50.1 | 1,032,178 | ||||||||
| White | 49.9 | 1,028,984 | ||||||||
| Total | 2,061,162 | |||||||||
| The home county of this newspaper is Wayne. | ||||||||||
| About this report | ||||||||||
| This third annual report for the Knight Foundation adds context to an annual survey by the American Society of Newspaper Editors. ASNE has set a goal that | ||||||||||
| every newspaper, to help it know its community and gather the news, should employ at least one non-white journalist, and that newspapers should strive to | ||||||||||
| employ non-whites in proportion to their share of the community. ASNE's report, at www.asne.org, shows each newspaper's non-white employment, but does | ||||||||||
| not disclose how closely that employment mirrors the newspaper's circulation area. | ||||||||||
| That gap is filled by the report you are reading now. This report was not done by ASNE, but was done for the Knight Foundation by Bill Dedman and | ||||||||||
| Stephen K. Doig. It shows how close each newspaper is to ASNE's goal, by comparing the newsroom staffing with the circulation area population. | ||||||||||
| The full report is at www.powerreporting.com/knight. | ||||||||||
| Notes and definitions | ||||||||||
| 1. The Newsroom Diversity Index is the non-white percentage of the newsroom staff divided by the non-white percentage of the circulation area's residents. Parity = 100. | ||||||||||
| 2. Source for staffing: Survey by American Society of Newspaper Editors, April 2005. Newspapers report non-white staff as of the end of the previous year. | ||||||||||
| 3. Following ASNE's definition, newsroom staff includes only supervisors, reporters, editors, copy/layout editors and photographers. | ||||||||||
| 4. Also following ASNE's definition, "whites," "blacks," etc., exclude Hispanics, who are counted in a separate category. | ||||||||||
| 5. Source for boundaries of this newspaper's circulation area: ZIP Code circulation data, Audit Bureau of Circulations, latest available. | ||||||||||
| 6. A paper may define its circulation area differently for marketing efforts, or news coverage, or to set advertising rates. | ||||||||||
| 7. If ZIP Codes or counties are used, this report applies a threshold: 10 percent household penetration is required to include an area in the circulation area. | ||||||||||
| 8. Source for the demographics of residents of that circulation area: US Census 2000. | ||||||||||
| 9. Source for total circulation: Editor & Publisher magazine, Monday-Friday average at year-end 2004. | ||||||||||
| 10. Staff of non-English publications, such as the Miami Herald's El Nuevo Herald, are excluded from the ASNE staffing survey for the first time this year. | ||||||||||
| Demographics of ZIP Codes | ||||||||||
| where sales were reported by | ||||||||||
| The Detroit News | ||||||||||
| Note that some ZIP Codes listed here may not have been included in determining the newspaper's circulation area. In calculating the Diversity Index, a | ||||||||||
| ZIP Code was included only if the household penetration was at least 10 percent. Any lower-penetration ZIP Codes are also listed here for your information. | ||||||||||
| Also, if the newspaper reported more than 300 ZIP Codes, only the top 300 in weekday sales are listed here. | ||||||||||
| ZIP / City / State / Approx. distance in miles from the newspaper's home office | Weekday sales | Households | Penetration % (daily sales per 100 households) | Median household income | Non-white % of population |
Hispanic % of population |
Black % of population |
Native % of population |
Asian % of population |
|
| 48375 / Novi Township / MI / 21.3 mi. | 4,879 | 8,127 | 60.0 | $75,545 | 16.1 | 1.9 | 2.1 | 0.1 | 10.6 | |
| 48312 / Sterling Heights / MI / 14.6 mi. | 3,653 | 12,913 | 28.3 | $54,097 | 8.5 | 1.2 | 1.7 | 0.2 | 4.1 | |
| 48154 / Livonia / MI / 16.1 mi. | 2,639 | 14,717 | 17.9 | $69,071 | 4.9 | 1.6 | 0.7 | 0.2 | 1.5 | |
| 48180 / Taylor / MI / 12.3 mi. | 2,615 | 24,776 | 10.6 | $42,944 | 16.0 | 3.2 | 8.7 | 0.6 | 1.6 | |
| 48218 / River Rouge / MI / 5.8 mi. | 2,577 | 3,701 | 69.6 | $29,057 | 49.6 | 4.8 | 41.5 | 0.6 | 0.2 | |
| 48170 / Plymouth / MI / 22.5 mi. | 2,461 | 16,152 | 15.2 | $67,360 | 7.4 | 1.5 | 2.2 | 0.3 | 2.2 | |
| 48236 / Grosse Pointe Woods / MI / 9.3 mi. | 2,423 | 12,149 | 19.9 | $82,567 | 6.3 | 1.1 | 2.3 | 0.1 | 2.0 | |
| 48124 / Dearborn / MI / 9.9 mi. | 2,406 | 14,201 | 16.9 | $55,632 | 6.7 | 2.9 | 1.0 | 0.3 | 1.3 | |
| 48152 / Livonia / MI / 16.4 mi. | 2,330 | 12,454 | 18.7 | $62,103 | 7.6 | 1.8 | 1.4 | 0.2 | 3.0 | |
| 48226 / Detroit / MI / 0 mi. | 2,279 | 2,630 | 86.7 | $29,770 | 79.3 | 2.5 | 73.5 | 0.2 | 1.4 | |
| 48185 / Westland / MI / 16.5 mi. | 2,272 | 22,520 | 10.1 | $43,925 | 15.1 | 2.5 | 6.2 | 0.4 | 3.9 | |
| 48167 / Northville Township / MI / 20.8 mi. | 2,220 | 14,349 | 15.5 | $79,579 | 9.6 | 1.7 | 3.0 | 0.2 | 3.5 | |
| 48150 / Livonia / MI / 15.3 mi. | 2,218 | 11,003 | 20.2 | $59,015 | 5.3 | 1.9 | 0.7 | 0.3 | 1.3 | |
| 48227 / Detroit / MI / 7.7 mi. | 2,218 | 20,751 | 10.7 | $31,760 | 98.0 | 0.6 | 95.7 | 0.2 | 0.1 | |
| 48228 / Detroit / MI / 7.9 mi. | 2,215 | 23,227 | 9.5 | $31,787 | 77.8 | 3.4 | 69.4 | 0.3 | 0.6 | |
| 48235 / Detroit / MI / 9.1 mi. | 2,158 | 19,754 | 10.9 | $40,041 | 98.4 | 0.6 | 96.0 | 0.2 | 0.2 | |
| 48066 / Roseville / MI / 12.3 mi. | 2,142 | 20,428 | 10.5 | $41,171 | 7.5 | 1.5 | 2.6 | 0.4 | 1.6 | |
| 48038 / Clinton Township / MI / 17.9 mi. | 2,122 | 17,209 | 12.3 | $53,352 | 6.4 | 2.0 | 1.4 | 0.2 | 1.6 | |
| 48239 / Redford Township / MI / 11.5 mi. | 2,098 | 14,878 | 14.1 | $49,556 | 20.1 | 2.4 | 14.5 | 0.3 | 1.2 | |
| 48187 / Canton Township / MI / 20.3 mi. | 2,083 | 16,337 | 12.8 | $71,694 | 16.7 | 2.2 | 3.9 | 0.2 | 8.5 | |
| 48127 / Dearborn Heights / MI / 11 mi. | 2,079 | 14,400 | 14.4 | $49,689 | 12.1 | 3.0 | 2.7 | 0.2 | 2.9 | |
| 48183 / Woodhaven / MI / 14.9 mi. | 2,062 | 16,028 | 12.9 | $55,045 | 7.5 | 2.8 | 1.5 | 0.4 | 1.5 | |
| 48126 / Dearborn / MI / 6.8 mi. | 2,033 | 15,587 | 13.0 | $31,159 | 21.7 | 3.2 | 1.4 | 0.2 | 1.4 | |
| 48034 / Southfield / MI / 14.6 mi. | 1,928 | 15,478 | 12.5 | $47,914 | 61.7 | 1.4 | 52.3 | 0.2 | 4.2 | |
| 48310 / Sterling Heights / MI / 15.2 mi. | 1,842 | 14,653 | 12.6 | $61,047 | 14.4 | 1.2 | 1.2 | 0.2 | 7.6 | |
| 48073 / Royal Oak / MI / 13.2 mi. | 1,831 | 16,625 | 11.0 | $52,384 | 6.6 | 1.2 | 1.8 | 0.2 | 2.0 | |
| 48093 / Warren / MI / 11.9 mi. | 1,820 | 19,747 | 9.2 | $49,925 | 6.2 | 1.1 | 1.5 | 0.2 | 2.2 | |
| 48192 / Wyandotte / MI / 11.3 mi. | 1,799 | 18,410 | 9.8 | $45,525 | 7.8 | 2.8 | 1.8 | 0.4 | 1.5 | |
| 48092 / Warren / MI / 11.6 mi. | 1,760 | 10,081 | 17.5 | $51,435 | 11.1 | 1.2 | 2.6 | 0.2 | 4.6 | |
| 48219 / Detroit / MI / 11.3 mi. | 1,733 | 21,616 | 8.0 | $39,300 | 88.5 | 1.0 | 84.7 | 0.3 | 0.6 | |
| 48101 / Allen Park / MI / 9.2 mi. | 1,724 | 12,064 | 14.3 | $51,805 | 7.5 | 4.7 | 0.7 | 0.3 | 0.8 | |
| 48044 / Macomb Township / MI / 21.4 mi. | 1,721 | 11,546 | 14.9 | $70,903 | 5.3 | 1.5 | 0.9 | 0.2 | 1.6 | |
| 48207 / Detroit / MI / 1.8 mi. | 1,717 | 11,815 | 14.5 | $24,496 | 92.8 | 0.9 | 89.7 | 0.2 | 0.5 | |
| 48091 / Warren / MI / 8.8 mi. | 1,712 | 12,846 | 13.3 | $38,890 | 12.8 | 1.6 | 4.4 | 0.5 | 3.4 | |
| 48336 / Farmington Hills / MI / 16.3 mi. | 1,695 | 11,169 | 15.2 | $55,837 | 14.4 | 1.4 | 7.1 | 0.3 | 3.7 | |
| 48021 / Eastpointe / MI / 9.9 mi. | 1,694 | 13,221 | 12.8 | $46,839 | 8.8 | 1.3 | 4.7 | 0.4 | 0.9 | |
| 48146 / Lincoln Park / MI / 8.4 mi. | 1,670 | 16,106 | 10.4 | $42,647 | 10.8 | 6.4 | 2.0 | 0.4 | 0.5 | |
| 48174 / Romulus / MI / 17 mi. | 1,636 | 11,029 | 14.8 | $46,072 | 29.7 | 2.4 | 23.5 | 0.5 | 0.9 | |
| 48135 / Garden City / MI / 13.8 mi. | 1,614 | 11,148 | 14.5 | $52,264 | 5.2 | 2.1 | 1.0 | 0.4 | 0.7 | |
| 48224 / Grosse Pointe Park / MI / 7.2 mi. | 1,589 | 18,658 | 8.5 | $40,960 | 82.7 | 1.1 | 78.9 | 0.2 | 0.6 | |
| 48212 / Hamtramck / MI / 5 mi. | 1,563 | 15,244 | 10.3 | $25,777 | 62.2 | 1.3 | 43.1 | 0.4 | 8.8 | |
| 48221 / Detroit / MI / 7.8 mi. | 1,561 | 16,594 | 9.4 | $42,263 | 96.2 | 0.8 | 93.3 | 0.2 | 0.4 | |
| 48238 / Detroit / MI / 5.9 mi. | 1,518 | 16,356 | 9.3 | $25,619 | 99.4 | 0.7 | 97.2 | 0.2 | 0.1 | |
| 48234 / Detroit / MI / 6.3 mi. | 1,515 | 15,514 | 9.8 | $33,352 | 94.0 | 0.6 | 91.1 | 0.2 | 0.6 | |
| 48313 / Sterling Heights / MI / 17.4 mi. | 1,512 | 12,363 | 12.2 | $63,197 | 6.2 | 1.6 | 1.0 | 0.2 | 2.1 | |
| 48080 / Saint Clair Shores / MI / 11 mi. | 1,510 | 10,861 | 13.9 | $44,538 | 4.7 | 1.3 | 0.8 | 0.3 | 1.4 | |
| 48214 / Detroit / MI / 3.6 mi. | 1,490 | 13,077 | 11.4 | $21,600 | 92.7 | 0.7 | 90.3 | 0.3 | 0.3 | |
| 48195 / Southgate / MI / 11 mi. | 1,479 | 12,836 | 11.5 | $46,927 | 9.1 | 4.0 | 2.1 | 0.4 | 1.7 | |
| 48047 / New Baltimore / MI / 25.5 mi. | 1,469 | 11,624 | 12.6 | $62,348 | 7.0 | 2.3 | 2.4 | 0.4 | 0.7 | |
| 48322 / West Bloomfield / MI / 20.9 mi. | 1,443 | 11,217 | 12.9 | $87,740 | 21.0 | 1.4 | 6.5 | 0.1 | 9.9 | |
| 48316 / Utica / MI / 23 mi. | 1,437 | 7,776 | 18.5 | $76,718 | 4.3 | 1.2 | 0.5 | 0.3 | 1.3 | |
| 48071 / Madison Heights / MI / 11.3 mi. | 1,436 | 13,299 | 10.8 | $42,326 | 11.5 | 1.6 | 1.8 | 0.4 | 5.0 | |
| 48204 / Detroit / MI / 4.8 mi. | 1,424 | 15,419 | 9.2 | $25,449 | 98.8 | 0.7 | 96.7 | 0.2 | 0.1 | |
| 48089 / Warren / MI / 9 mi. | 1,421 | 12,811 | 11.1 | $39,283 | 10.3 | 1.7 | 2.7 | 0.5 | 2.9 | |
| 48205 / Detroit / MI / 7.3 mi. | 1,416 | 19,923 | 7.1 | $31,367 | 90.4 | 0.8 | 84.0 | 0.2 | 3.5 | |
| 48315 / Utica / MI / 21.7 mi. | 1,413 | 8,091 | 17.5 | $72,847 | 5.0 | 1.4 | 0.7 | 0.1 | 1.8 | |
| 48116 / Green Oak Township / MI / 36.8 mi. | 1,404 | 9,382 | 15.0 | $69,968 | 3.8 | 1.4 | 0.3 | 0.4 | 0.9 | |
| 48186 / Westland / MI / 15.8 mi. | 1,401 | 14,266 | 9.8 | $49,809 | 13.6 | 2.4 | 7.5 | 0.4 | 1.4 | |
| 48035 / Clinton Township / MI / 15.8 mi. | 1,362 | 13,847 | 9.8 | $48,973 | 13.2 | 1.5 | 6.9 | 0.3 | 2.3 | |
| 48188 / Canton Township / MI / 20.6 mi. | 1,319 | 11,248 | 11.7 | $73,963 | 19.1 | 2.5 | 5.3 | 0.3 | 9.0 | |
| 48076 / Southfield / MI / 13.7 mi. | 1,294 | 10,741 | 12.0 | $62,404 | 49.0 | 1.1 | 42.0 | 0.1 | 2.7 | |
| 48307 / Rochester Hills / MI / 21.3 mi. | 1,247 | 15,767 | 7.9 | $62,484 | 13.6 | 2.4 | 2.5 | 0.2 | 6.9 | |
| 48075 / Southfield / MI / 11.8 mi. | 1,239 | 9,391 | 13.2 | $52,557 | 75.6 | 1.0 | 70.4 | 0.2 | 1.6 | |
| 48203 / Highland Park / MI / 6.4 mi. | 1,230 | 16,372 | 7.5 | $21,659 | 90.9 | 0.8 | 86.3 | 0.3 | 0.3 | |
| 48334 / Farmington Hills / MI / 18.2 mi. | 1,198 | 7,589 | 15.8 | $63,927 | 17.5 | 1.5 | 7.2 | 0.1 | 6.3 | |
| 48309 / Rochester Hills / MI / 22.4 mi. | 1,191 | 10,288 | 11.6 | $81,444 | 13.3 | 2.4 | 3.8 | 0.2 | 5.9 | |
| 48843 / Howell / MI / 45.3 mi. | 1,190 | 15,605 | 7.6 | $64,265 | 3.7 | 1.4 | 0.2 | 0.4 | 0.6 | |
| 48111 / Van Buren Township / MI / 23.3 mi. | 1,182 | 15,712 | 7.5 | $50,135 | 17.4 | 2.2 | 11.4 | 0.5 | 1.3 | |
| 48081 / Saint Clair Shores / MI / 12.8 mi. | 1,170 | 9,308 | 12.6 | $53,347 | 3.0 | 1.0 | 0.3 | 0.2 | 0.6 | |
| 48237 / Oak Park / MI / 10.6 mi. | 1,134 | 12,598 | 9.0 | $45,018 | 53.6 | 1.3 | 45.6 | 0.2 | 2.2 | |
| 48213 / Detroit / MI / 4.8 mi. | 1,123 | 13,818 | 8.1 | $24,633 | 97.9 | 0.6 | 95.7 | 0.2 | 0.1 | |
| 48083 / Troy / MI / 15.1 mi. | 1,120 | 8,969 | 12.5 | $60,943 | 19.8 | 1.8 | 2.1 | 0.2 | 13.4 | |
| 48220 / Royal Oak Township / MI / 9.2 mi. | 1,086 | 11,010 | 9.9 | $43,698 | 19.7 | 1.7 | 13.7 | 0.5 | 1.2 | |
| 48098 / Troy / MI / 18.3 mi. | 1,076 | 14,884 | 7.2 | $98,134 | 17.6 | 1.2 | 1.9 | 0.1 | 12.8 | |
| 48306 / Rochester Hills / MI / 25.6 mi. | 1,076 | 7,825 | 13.8 | $106,828 | 8.9 | 1.3 | 1.9 | 0.1 | 4.7 | |
| 48331 / Farmington Hills / MI / 20.5 mi. | 1,067 | 8,428 | 12.7 | $97,089 | 16.9 | 1.3 | 5.3 | 0.1 | 8.3 | |
| 48314 / Sterling Heights / MI / 17.3 mi. | 1,031 | 6,242 | 16.5 | $62,530 | 11.2 | 1.4 | 1.3 | 0.3 | 5.5 | |
| 48009 / Birmingham / MI / 15.7 mi. | 1,021 | 9,113 | 11.2 | $80,555 | 4.7 | 1.2 | 0.9 | 0.1 | 1.5 | |
| 48036 / Clinton Township / MI / 18 mi. | 1,021 | 9,526 | 10.7 | $44,886 | 11.2 | 1.5 | 6.4 | 0.3 | 0.9 | |
| 48301 / Bloomfield Village / MI / 17.5 mi. | 1,014 | 5,644 | 18.0 | $110,431 | 8.4 | 1.3 | 2.1 | 0.1 | 4.0 | |
| 48335 / Farmington Hills / MI / 18.8 mi. | 1,006 | 10,489 | 9.6 | $57,009 | 23.8 | 1.7 | 6.6 | 0.2 | 13.8 | |
| 48304 / Bloomfield Township / MI / 18.7 mi. | 997 | 6,662 | 15.0 | $102,767 | 14.0 | 1.5 | 3.7 | 0.1 | 7.5 | |
| 48125 / Dearborn Heights / MI / 10.7 mi. | 995 | 8,874 | 11.2 | $46,170 | 8.4 | 4.0 | 1.2 | 0.5 | 1.1 | |
| 48067 / Royal Oak / MI / 11.1 mi. | 977 | 12,185 | 8.0 | $52,122 | 5.4 | 1.5 | 1.1 | 0.3 | 1.1 | |
| 48230 / Grosse Pointe Woods / MI / 6.8 mi. | 955 | 7,215 | 13.2 | $81,161 | 7.6 | 1.7 | 2.6 | 0.2 | 1.6 | |
| 48225 / Harper Woods / MI / 8.9 mi. | 952 | 6,387 | 14.9 | $46,758 | 15.5 | 1.6 | 10.6 | 0.3 | 1.7 | |
| 48206 / Detroit / MI / 3.5 mi. | 942 | 11,840 | 8.0 | $24,438 | 98.7 | 0.5 | 96.6 | 0.2 | 0.2 | |
| 48042 / Macomb Township / MI / 23.4 mi. | 941 | 5,379 | 17.5 | $77,658 | 4.3 | 1.4 | 0.6 | 0.1 | 1.1 | |
| 48210 / Detroit / MI / 3.6 mi. | 933 | 12,728 | 7.3 | $24,256 | 73.5 | 30.3 | 37.0 | 0.5 | 1.0 | |
| 48178 / South Lyon / MI / 30 mi. | 930 | 8,857 | 10.5 | $67,463 | 3.6 | 1.3 | 0.3 | 0.3 | 0.8 | |
| 48201 / Detroit / MI / 1 mi. | 919 | 7,519 | 12.2 | $12,262 | 84.4 | 1.9 | 74.6 | 0.5 | 5.4 | |
| 48209 / Detroit / MI / 3.3 mi. | 914 | 11,834 | 7.7 | $25,546 | 70.3 | 58.4 | 8.4 | 0.8 | 0.4 | |
| 48026 / Fraser / MI / 13.9 mi. | 912 | 6,062 | 15.0 | $50,339 | 4.4 | 1.3 | 0.9 | 0.2 | 0.9 | |
| 48202 / Detroit / MI / 2.9 mi. | 904 | 9,011 | 10.0 | $20,708 | 90.5 | 1.2 | 83.6 | 0.2 | 3.3 | |
| 48084 / Troy / MI / 15.7 mi. | 903 | 6,165 | 14.6 | $67,964 | 20.6 | 1.8 | 2.5 | 0.1 | 14.4 | |
| 48317 / Utica / MI / 20.3 mi. | 891 | 10,608 | 8.4 | $51,373 | 9.0 | 2.5 | 1.3 | 0.3 | 3.1 | |
| 48390 / Wolverine Lake / MI / 24.7 mi. | 869 | 7,929 | 11.0 | $60,500 | 5.3 | 1.4 | 0.7 | 0.2 | 2.0 | |
| 48223 / Detroit / MI / 10.1 mi. | 867 | 12,394 | 7.0 | $35,731 | 87.6 | 1.2 | 83.0 | 0.4 | 1.0 | |
| 48045 / Selfridge Air Natl Guard / MI / 20.6 mi. | 862 | 10,501 | 8.2 | $52,564 | 6.2 | 1.4 | 2.3 | 0.4 | 0.6 | |
| 48302 / Bloomfield Township / MI / 20 mi. | 857 | 6,362 | 13.5 | $112,099 | 17.3 | 1.3 | 6.0 | 0.0 | 8.5 | |
| 48184 / Wayne / MI / 16.2 mi. | 850 | 7,401 | 11.5 | $46,426 | 16.9 | 1.9 | 11.2 | 0.6 | 1.5 | |
| 48141 / Inkster / MI / 12.9 mi. | 820 | 11,169 | 7.3 | $35,950 | 75.5 | 1.6 | 67.3 | 0.4 | 3.4 | |
| 48326 / Lake Angelus / MI / 24.1 mi. | 809 | 7,781 | 10.4 | $51,089 | 26.1 | 4.7 | 12.1 | 0.3 | 6.6 | |
| 48323 / West Bloomfield / MI / 21.7 mi. | 808 | 6,232 | 13.0 | $105,091 | 14.6 | 1.3 | 4.3 | 0.1 | 6.9 | |
| 48240 / Redford Township / MI / 13.3 mi. | 797 | 7,295 | 10.9 | $48,131 | 8.2 | 1.9 | 3.3 | 0.5 | 0.7 | |
| 48114 / Hartland Township / MI / 37 mi. | 790 | 6,678 | 11.8 | $78,171 | 3.3 | 1.0 | 0.4 | 0.3 | 0.8 | |
| 48025 / Southfield Township / MI / 15.9 mi. | 784 | 5,606 | 14.0 | $97,437 | 8.9 | 1.2 | 3.8 | 0.1 | 2.3 | |
| 48353 / Hartland / MI / 36.5 mi. | 772 | 2,140 | 36.1 | $71,964 | 2.6 | 0.9 | 0.2 | 0.3 | 0.3 | |
| 48134 / Flat Rock / MI / 18.1 mi. | 763 | 5,997 | 12.7 | $52,500 | 8.0 | 3.0 | 1.5 | 0.4 | 1.5 | |
| 48082 / Saint Clair Shores / MI / 14.7 mi. | 761 | 6,989 | 10.9 | $47,599 | 4.5 | 1.4 | 1.0 | 0.3 | 0.5 | |
| 48094 / Washington Township / MI / 25.4 mi. | 734 | 4,835 | 15.2 | $70,125 | 4.2 | 2.3 | 0.3 | 0.3 | 0.6 | |
| 48382 / Commerce Township / MI / 26.6 mi. | 722 | 6,541 | 11.0 | $78,982 | 3.7 | 1.2 | 0.5 | 0.2 | 0.9 | |
| 48215 / Grosse Pointe Park / MI / 5.5 mi. | 706 | 6,811 | 10.4 | $25,020 | 92.0 | 0.9 | 88.8 | 0.2 | 0.4 | |
| 48197 / Ypsilanti / MI / 28 mi. | 695 | 21,681 | 3.2 | $44,171 | 36.1 | 3.1 | 24.6 | 0.4 | 4.6 | |
| 48051 / New Baltimore / MI / 25.7 mi. | 663 | 4,663 | 14.2 | $59,429 | 8.1 | 2.3 | 2.9 | 0.4 | 0.8 | |
| 48128 / Dearborn / MI / 10.2 mi. | 634 | 4,341 | 14.6 | $63,155 | 5.9 | 3.4 | 0.4 | 0.2 | 0.9 | |
| 48507 / Flint / MI / 51.6 mi. | 608 | 14,324 | 4.2 | $37,490 | 19.6 | 3.1 | 12.9 | 0.6 | 0.8 | |
| 48138 / Hickory Isle / MI / 13.8 mi. | 584 | 4,122 | 14.2 | $87,062 | 6.0 | 1.6 | 0.4 | 0.3 | 2.7 | |
| 48122 / Melvindale / MI / 7.1 mi. | 568 | 4,506 | 12.6 | $38,037 | 18.3 | 8.9 | 5.2 | 0.6 | 1.3 | |
| 48933 / Lansing / MI / 75.7 mi. | 561 | 1,511 | 37.1 | $15,599 | 49.6 | 10.4 | 26.9 | 0.7 | 6.7 | |
| 48341 / Pontiac / MI / 22.1 mi. | 560 | 7,208 | 7.8 | $32,031 | 70.9 | 7.5 | 59.5 | 0.4 | 1.1 | |
| 48374 / Novi / MI / 24.2 mi. | 551 | 3,552 | 15.5 | $112,809 | 13.3 | 1.5 | 1.0 | 0.2 | 9.4 | |
| 48015 / Center Line / MI / 9.5 mi. | 550 | 3,958 | 13.9 | $30,853 | 7.2 | 1.5 | 3.0 | 0.2 | 0.9 | |
| 48393 / Wixom / MI / 26.3 mi. | 547 | 6,998 | 7.8 | $45,977 | 9.9 | 2.9 | 2.2 | 0.4 | 2.5 | |
| 48043 / Mount Clemens / MI / 18.8 mi. | 530 | 7,277 | 7.3 | $37,884 | 25.5 | 2.4 | 19.4 | 0.6 | 0.5 | |
| 48030 / Hazel Park / MI / 8.5 mi. | 527 | 7,244 | 7.3 | $36,987 | 9.6 | 2.1 | 1.6 | 0.8 | 1.8 | |
| 48072 / Berkley / MI / 12.6 mi. | 526 | 6,678 | 7.9 | $57,620 | 4.8 | 1.3 | 0.7 | 0.2 | 1.0 | |
| 48381 / Milford Township / MI / 30.1 mi. | 525 | 4,447 | 11.8 | $64,009 | 3.5 | 1.2 | 0.4 | 0.3 | 0.5 | |
| 48377 / Novi / MI / 23.1 mi. | 524 | 5,305 | 9.9 | $49,432 | 12.7 | 1.9 | 2.6 | 0.3 | 5.8 | |
| 48430 / Fenton / MI / 44.3 mi. | 521 | 12,082 | 4.3 | $60,463 | 3.9 | 1.4 | 0.3 | 0.4 | 0.7 | |
| 48208 / Detroit / MI / 2.2 mi. | 512 | 5,133 | 10.0 | $17,680 | 92.3 | 2.0 | 88.3 | 0.2 | 0.2 | |
| 48328 / Waterford Township / MI / 24.9 mi. | 505 | 10,805 | 4.7 | $47,917 | 13.1 | 5.1 | 5.1 | 0.3 | 1.2 | |
| 48065 / Romeo / MI / 32.6 mi. | 503 | 3,614 | 13.9 | $60,584 | 5.9 | 2.0 | 1.9 | 0.3 | 0.5 | |
| 48017 / Clawson / MI / 14 mi. | 496 | 5,661 | 8.8 | $50,822 | 4.7 | 1.1 | 0.8 | 0.3 | 1.3 | |
| 48324 / West Bloomfield / MI / 23.7 mi. | 494 | 6,424 | 7.7 | $89,021 | 10.3 | 1.5 | 3.4 | 0.2 | 3.9 | |
| 48439 / Grand Blanc / MI / 47.3 mi. | 490 | 15,720 | 3.1 | $60,980 | 11.8 | 1.8 | 5.7 | 0.3 | 2.6 | |
| 48103 / Scio Township / MI / 35.9 mi. | 476 | 20,877 | 2.3 | $61,809 | 17.6 | 2.5 | 7.3 | 0.2 | 5.1 | |
| 48348 / Independence Township / MI / 32.5 mi. | 447 | 6,694 | 6.7 | $83,476 | 4.6 | 1.8 | 0.8 | 0.2 | 0.9 | |
| 49707 / Alpena / MI / 177.8 mi. | 423 | 10,099 | 4.2 | $34,153 | 2.3 | 0.6 | 0.3 | 0.4 | 0.4 | |
| 48104 / Pittsfield Township / MI / 32.2 mi. | 420 | 16,140 | 2.6 | $39,839 | 21.6 | 3.6 | 5.1 | 0.2 | 9.9 | |
| 48162 / Woodland Beach / MI / 29.9 mi. | 418 | 11,267 | 3.7 | $47,317 | 6.3 | 1.9 | 2.0 | 0.2 | 0.9 | |
| 48327 / Waterford Township / MI / 26.5 mi. | 417 | 8,784 | 4.7 | $52,000 | 9.3 | 3.9 | 1.9 | 0.3 | 1.6 | |
| 49735 / Gaylord / MI / 187.1 mi. | 416 | 7,236 | 5.7 | $42,041 | 3.1 | 0.8 | 0.2 | 0.6 | 0.4 | |
| 48357 / Highland Township / MI / 34.8 mi. | 405 | 3,233 | 12.5 | $56,062 | 3.8 | 1.3 | 0.3 | 0.5 | 0.3 | |
| 48198 / Ypsilanti / MI / 26.2 mi. | 383 | 15,785 | 2.4 | $41,048 | 36.5 | 2.5 | 29.3 | 0.5 | 1.3 | |
| 48346 / Independence Township / MI / 30.6 mi. | 379 | 8,843 | 4.3 | $67,428 | 6.8 | 2.9 | 1.1 | 0.3 | 1.3 | |
| 48060 / Port Huron Township / MI / 50.5 mi. | 359 | 16,138 | 2.2 | $33,336 | 14.0 | 3.9 | 6.8 | 0.7 | 0.5 | |
| 48169 / Putnam Township / MI / 42.9 mi. | 359 | 6,888 | 5.2 | $67,593 | 3.6 | 1.0 | 1.0 | 0.3 | 0.4 | |
| 48858 / Mount Pleasant / MI / 115.8 mi. | 351 | 15,269 | 2.3 | $31,279 | 11.7 | 2.4 | 2.6 | 3.1 | 1.9 | |
| 48706 / Bay City / MI / 91.9 mi. | 345 | 16,575 | 2.1 | $40,190 | 5.6 | 3.1 | 0.6 | 0.3 | 0.6 | |
| 48173 / Rockwood / MI / 18.6 mi. | 343 | 4,016 | 8.5 | $56,571 | 5.0 | 2.2 | 0.5 | 0.7 | 0.4 | |
| 48371 / Oxford / MI / 34.5 mi. | 339 | 6,658 | 5.1 | $65,277 | 4.5 | 2.1 | 0.7 | 0.2 | 0.5 | |
| 49202 / Jackson / MI / 65 mi. | 332 | 9,097 | 3.6 | $31,695 | 12.7 | 3.1 | 6.2 | 0.5 | 0.6 | |
| 48386 / White Lake / MI / 28.2 mi. | 329 | 5,874 | 5.6 | $62,495 | 4.8 | 1.7 | 0.9 | 0.4 | 0.7 | |
| 48217 / Detroit / MI / 6.1 mi. | 326 | 3,973 | 8.2 | $28,161 | 91.7 | 5.6 | 84.4 | 0.2 | 0.3 | |
| 48216 / Detroit / MI / 1.5 mi. | 324 | 2,442 | 13.3 | $24,079 | 79.9 | 39.8 | 36.6 | 0.8 | 0.4 | |
| 48062 / Richmond Township / MI / 35 mi. | 322 | 3,013 | 10.7 | $53,894 | 5.8 | 3.2 | 0.6 | 0.3 | 0.7 | |
| 48362 / Orion Township / MI / 30.9 mi. | 320 | 5,149 | 6.2 | $70,123 | 4.6 | 2.0 | 0.6 | 0.3 | 0.8 | |
| 48329 / Waterford Township / MI / 27.9 mi. | 319 | 9,959 | 3.2 | $64,277 | 7.3 | 2.8 | 1.8 | 0.3 | 1.1 | |
| 48095 / Washington Township / MI / 28.9 mi. | 317 | 1,282 | 24.7 | $81,218 | 4.1 | 2.6 | 0.1 | 0.2 | 0.7 | |
| 48211 / Hamtramck / MI / 3.1 mi. | 316 | 3,353 | 9.4 | $21,044 | 84.8 | 0.9 | 73.9 | 0.2 | 2.2 | |
| 48176 / Saline / MI / 36.8 mi. | 312 | 6,489 | 4.8 | $77,274 | 5.3 | 1.3 | 0.8 | 0.2 | 1.9 | |
| 48229 / Ecorse / MI / 6.9 mi. | 310 | 4,279 | 7.2 | $27,267 | 53.2 | 9.1 | 40.7 | 0.5 | 0.2 | |
| 49684 / Traverse City / MI / 200.3 mi. | 305 | 13,586 | 2.2 | $44,677 | 4.7 | 1.6 | 0.4 | 1.0 | 0.5 | |
| 48359 / Orion Township / MI / 27.3 mi. | 295 | 2,893 | 10.2 | $60,114 | 9.3 | 4.4 | 2.0 | 0.3 | 1.3 | |
| 48164 / Willow / MI / 20.9 mi. | 281 | 2,672 | 10.5 | $65,308 | 6.8 | 1.9 | 3.0 | 0.5 | 0.4 | |
| 48640 / Midland / MI / 101.5 mi. | 281 | 12,674 | 2.2 | $47,573 | 6.4 | 1.6 | 1.3 | 0.4 | 2.0 | |
| 48105 / Superior Township / MI / 31.1 mi. | 275 | 13,785 | 2.0 | $51,476 | 34.6 | 2.8 | 7.7 | 0.2 | 20.9 | |
| 48823 / East Lansing / MI / 72.6 mi. | 265 | 19,524 | 1.4 | $33,153 | 19.6 | 3.0 | 6.0 | 0.3 | 8.1 | |
| 49015 / Springfield / MI / 102.9 mi. | 263 | 13,908 | 1.9 | $39,661 | 16.9 | 4.1 | 7.3 | 0.6 | 2.9 | |
| 48360 / Orion Township / MI / 28.7 mi. | 259 | 4,006 | 6.5 | $81,345 | 6.1 | 2.1 | 1.4 | 0.2 | 1.5 | |
| 48422 / Croswell / MI / 63.3 mi. | 257 | 2,313 | 11.1 | $36,869 | 7.8 | 6.4 | 0.1 | 0.4 | 0.1 | |
| 48383 / White Lake / MI / 31.5 mi. | 251 | 4,211 | 6.0 | $72,846 | 4.4 | 1.8 | 0.6 | 0.4 | 0.5 | |
| 48661 / West Branch / MI / 137.4 mi. | 251 | 4,076 | 6.2 | $34,601 | 2.9 | 0.8 | 0.1 | 0.3 | 0.8 | |
| 48601 / Saginaw / MI / 80.1 mi. | 244 | 17,162 | 1.4 | $25,388 | 73.7 | 11.2 | 60.2 | 0.4 | 0.2 | |
| 49601 / Hoxeyville / MI / 167.2 mi. | 244 | 7,978 | 3.1 | $36,091 | 3.1 | 0.9 | 0.2 | 0.7 | 0.5 | |
| 49036 / Coldwater / MI / 97.9 mi. | 240 | 8,808 | 2.7 | $39,052 | 10.4 | 2.9 | 4.5 | 0.5 | 0.6 | |
| 48446 / Lapeer / MI / 48.4 mi. | 234 | 11,014 | 2.1 | $49,214 | 6.2 | 2.3 | 1.9 | 0.4 | 0.4 | |
| 48603 / Saginaw / MI / 84.7 mi. | 230 | 16,766 | 1.4 | $44,837 | 13.7 | 4.2 | 5.3 | 0.2 | 2.7 | |
| 49203 / Jackson / MI / 65.1 mi. | 227 | 15,056 | 1.5 | $40,282 | 22.6 | 3.0 | 16.0 | 0.4 | 0.8 | |
| 48108 / Ann Arbor / MI / 32.5 mi. | 226 | 9,623 | 2.3 | $49,882 | 35.2 | 4.0 | 16.6 | 0.4 | 10.3 | |
| 48629 / Houghton Lake / MI / 150.9 mi. | 226 | 3,352 | 6.7 | $29,292 | 2.6 | 0.8 | 0.4 | 0.5 | 0.2 | |
| 49770 / Petoskey / MI / 213.6 mi. | 225 | 6,194 | 3.6 | $40,742 | 5.2 | 1.0 | 0.2 | 2.4 | 0.6 | |
| 48917 / Lansing / MI / 79.7 mi. | 224 | 13,677 | 1.6 | $47,468 | 18.8 | 4.9 | 8.7 | 0.4 | 2.6 | |
| 48836 / Fowlerville / MI / 53 mi. | 223 | 4,029 | 5.5 | $55,200 | 3.9 | 1.1 | 0.2 | 1.0 | 0.4 | |
| 48165 / New Hudson / MI / 29.5 mi. | 222 | 1,900 | 11.7 | $66,875 | 4.0 | 1.8 | 0.3 | 0.3 | 0.4 | |
| 48189 / Whitmore Lake / MI / 34.5 mi. | 222 | 5,127 | 4.3 | $59,203 | 5.7 | 1.3 | 2.2 | 0.4 | 0.6 | |
| 48444 / Imlay City / MI / 46.6 mi. | 222 | 3,203 | 6.9 | $42,831 | 13.7 | 11.8 | 0.5 | 0.2 | 0.7 | |
| 48624 / Gladwin / MI / 128.2 mi. | 219 | 6,557 | 3.3 | $31,848 | 2.6 | 0.6 | 0.1 | 0.5 | 0.3 | |
| 48001 / Russell Island / MI / 30.6 mi. | 217 | 5,244 | 4.1 | $49,777 | 3.0 | 1.0 | 0.2 | 0.8 | 0.2 | |
| 48161 / Monroe / MI / 33.9 mi. | 216 | 9,782 | 2.2 | $43,336 | 9.2 | 2.7 | 4.1 | 0.2 | 0.6 | |
| 49221 / Cadmus / MI / 55.1 mi. | 216 | 14,205 | 1.5 | $41,924 | 18.8 | 11.8 | 4.7 | 0.4 | 0.7 | |
| 49721 / Cheboygan / MI / 220.3 mi. | 215 | 6,120 | 3.5 | $32,847 | 6.7 | 0.8 | 0.2 | 3.2 | 0.3 | |
| 48864 / Okemos / MI / 69.4 mi. | 211 | 7,770 | 2.7 | $66,802 | 16.8 | 2.2 | 4.0 | 0.3 | 8.4 | |
| 49201 / Jackson / MI / 63.8 mi. | 210 | 14,555 | 1.4 | $47,044 | 14.6 | 2.2 | 10.1 | 0.3 | 0.7 | |
| 49738 / Grayling / MI / 169.2 mi. | 210 | 4,089 | 5.1 | $33,224 | 4.9 | 1.0 | 2.0 | 0.6 | 0.3 | |
| 48120 / Dearborn / MI / 6.1 mi. | 205 | 2,643 | 7.8 | $37,111 | 25.7 | 1.9 | 2.9 | 0.1 | 3.9 | |
| 48118 / Sylvan Township / MI / 46.7 mi. | 203 | 4,259 | 4.8 | $65,667 | 4.9 | 1.3 | 1.8 | 0.4 | 0.5 | |
| 48653 / Roscommon / MI / 157.2 mi. | 199 | 4,286 | 4.6 | $33,515 | 2.4 | 0.8 | 0.3 | 0.3 | 0.3 | |
| 48380 / Milford Township / MI / 32.9 mi. | 197 | 1,936 | 10.2 | $84,745 | 3.2 | 1.3 | 0.3 | 0.1 | 0.3 | |
| 48910 / Lansing / MI / 75 mi. | 197 | 15,833 | 1.2 | $35,765 | 26.8 | 7.8 | 13.3 | 0.6 | 1.9 | |
| 48079 / Saint Clair Township / MI / 41.2 mi. | 195 | 4,638 | 4.2 | $55,000 | 3.1 | 1.1 | 0.2 | 0.2 | 0.6 | |
| 48625 / Harrison / MI / 137.6 mi. | 194 | 5,627 | 3.4 | $26,773 | 3.6 | 1.3 | 0.4 | 0.7 | 0.3 | |
| 48070 / Huntington Woods / MI / 11 mi. | 192 | 2,382 | 8.1 | $87,507 | 3.8 | 0.9 | 0.7 | 0.1 | 1.4 | |
| 49509 / Wyoming / MI / 131.1 mi. | 192 | 22,566 | 0.9 | $42,138 | 23.5 | 13.5 | 5.0 | 0.5 | 2.6 | |
| 48356 / Highland Township / MI / 32.6 mi. | 191 | 3,162 | 6.0 | $66,141 | 3.2 | 1.3 | 0.3 | 0.3 | 0.5 | |
| 48602 / Saginaw / MI / 82.7 mi. | 184 | 13,051 | 1.4 | $33,500 | 26.3 | 11.4 | 11.6 | 0.4 | 0.5 | |
| 49017 / Battle Creek / MI / 101.5 mi. | 184 | 14,888 | 1.2 | $36,465 | 25.6 | 2.5 | 19.6 | 0.6 | 0.5 | |
| 48906 / Lansing / MI / 77.9 mi. | 183 | 10,397 | 1.8 | $35,988 | 32.2 | 12.7 | 12.5 | 1.0 | 2.9 | |
| 48320 / Sylvan Lake / MI / 22.6 mi. | 179 | 2,004 | 8.9 | $55,410 | 7.6 | 3.2 | 0.9 | 0.8 | 0.8 | |
| 48039 / Marine City / MI / 33.6 mi. | 177 | 3,142 | 5.6 | $43,330 | 2.6 | 1.1 | 0.1 | 0.4 | 0.2 | |
| 49660 / Stronach / MI / 195.3 mi. | 177 | 5,617 | 3.2 | $34,837 | 8.4 | 2.2 | 2.6 | 1.4 | 0.4 | |
| 49001 / Kalamazoo / MI / 119.2 mi. | 175 | 16,804 | 1.0 | $34,551 | 28.0 | 5.5 | 17.8 | 0.7 | 0.9 | |
| 48340 / Pontiac / MI / 24.6 mi. | 174 | 9,676 | 1.8 | $31,342 | 49.2 | 16.5 | 26.8 | 0.5 | 2.6 | |
| 48420 / Clio / MI / 62.9 mi. | 174 | 8,265 | 2.1 | $47,105 | 5.0 | 1.9 | 1.1 | 0.5 | 0.3 | |
| 48048 / New Haven / MI / 28.2 mi. | 173 | 1,925 | 9.0 | $47,226 | 28.0 | 3.5 | 20.5 | 0.8 | 0.3 | |
| 48040 / Marysville / MI / 46.3 mi. | 169 | 4,025 | 4.2 | $49,299 | 2.6 | 1.2 | 0.2 | 0.3 | 0.4 | |
| 48442 / Holly / MI / 39.7 mi. | 167 | 6,933 | 2.4 | $53,438 | 6.0 | 2.5 | 1.6 | 0.3 | 0.4 | |
| 48342 / Pontiac / MI / 22.8 mi. | 166 | 7,263 | 2.3 | $29,017 | 79.2 | 13.2 | 59.9 | 0.4 | 3.2 | |
| 48506 / Northeast / MI / 53.9 mi. | 165 | 13,031 | 1.3 | $33,163 | 14.7 | 5.4 | 5.3 | 0.8 | 0.5 | |
| 48005 / Armada Township / MI / 33.7 mi. | 164 | 1,719 | 9.5 | $68,783 | 2.9 | 1.5 | 0.1 | 0.3 | 0.1 | |
| 48750 / Oscoda / MI / 137.2 mi. | 164 | 3,997 | 4.1 | $32,198 | 5.2 | 1.3 | 0.8 | 0.8 | 0.7 | |
| 49783 / Sault Sainte Marie / MI / 273.9 mi. | 164 | 7,698 | 2.1 | $33,233 | 25.1 | 1.5 | 4.9 | 13.6 | 0.6 | |
| 48453 / Marlette / MI / 64.8 mi. | 163 | 1,940 | 8.4 | $37,959 | 4.3 | 2.0 | 0.9 | 0.3 | 0.2 | |
| 49230 / Brooklyn / MI / 58.9 mi. | 161 | 3,782 | 4.3 | $49,428 | 3.1 | 1.2 | 0.1 | 0.4 | 0.3 | |
| 49503 / Grand Rapids / MI / 130.1 mi. | 161 | 13,859 | 1.2 | $30,176 | 42.0 | 15.3 | 21.6 | 0.8 | 1.3 | |
| 48723 / Caro / MI / 76.1 mi. | 159 | 4,751 | 3.3 | $36,704 | 7.0 | 3.1 | 1.7 | 0.7 | 0.4 | |
| 48130 / Webster / MI / 40.3 mi. | 158 | 3,816 | 4.1 | $73,051 | 3.4 | 1.2 | 0.3 | 0.3 | 0.8 | |
| 48160 / York Township / MI / 33.5 mi. | 155 | 4,121 | 3.8 | $58,193 | 16.5 | 3.9 | 10.6 | 0.3 | 0.5 | |
| 48423 / Davison / MI / 50.2 mi. | 154 | 12,817 | 1.2 | $45,568 | 6.0 | 2.0 | 1.4 | 0.4 | 0.6 | |
| 49307 / Big Rapids / MI / 144 mi. | 148 | 6,561 | 2.3 | $30,483 | 12.1 | 1.5 | 6.5 | 0.6 | 1.7 | |
| 48096 / Ray Township / MI / 28.5 mi. | 147 | 1,367 | 10.8 | $70,282 | 3.0 | 1.2 | 0.1 | 0.4 | 0.4 | |
| 49242 / Hillsdale / MI / 80.1 mi. | 144 | 5,736 | 2.5 | $38,207 | 3.8 | 1.2 | 0.6 | 0.4 | 0.6 | |
| 49286 / Tecumseh / MI / 47.6 mi. | 144 | 5,457 | 2.6 | $53,325 | 6.1 | 4.1 | 0.2 | 0.5 | 0.6 | |
| 48867 / Owosso / MI / 68.9 mi. | 142 | 11,018 | 1.3 | $37,859 | 4.2 | 2.3 | 0.2 | 0.4 | 0.4 | |
| 48651 / Prudenville / MI / 147.4 mi. | 140 | 2,269 | 6.2 | $29,121 | 3.1 | 0.8 | 0.5 | 1.2 | 0.2 | |
| 48363 / Oakland Township / MI / 28.5 mi. | 136 | 1,520 | 8.9 | $76,491 | 3.8 | 0.9 | 0.9 | 0.1 | 0.8 | |
| 49525 / Grand Rapids / MI / 128.6 mi. | 134 | 9,809 | 1.4 | $50,316 | 6.5 | 1.9 | 2.0 | 0.3 | 1.3 | |
| 48604 / Saginaw / MI / 85 mi. | 133 | 4,316 | 3.1 | $39,658 | 17.3 | 7.8 | 7.0 | 0.3 | 1.0 | |
| 48730 / East Tawas / MI / 128.8 mi. | 133 | 2,215 | 6.0 | $30,443 | 3.0 | 0.9 | 0.1 | 0.5 | 0.6 | |
| 48462 / Ortonville / MI / 37.2 mi. | 132 | 4,388 | 3.0 | $74,932 | 3.3 | 1.3 | 0.3 | 0.3 | 0.5 | |
| 49417 / Grand Haven / MI / 155.3 mi. | 132 | 10,727 | 1.2 | $51,142 | 4.4 | 1.9 | 0.3 | 0.4 | 0.8 | |
| 48532 / Northwest / MI / 55.4 mi. | 131 | 8,254 | 1.6 | $40,348 | 26.6 | 2.2 | 18.3 | 0.6 | 3.2 | |
| 48003 / Almont Township / MI / 38.2 mi. | 129 | 1,946 | 6.6 | $63,971 | 4.7 | 3.2 | 0.2 | 0.3 | 0.3 | |
| 48911 / Lansing / MI / 75.4 mi. | 129 | 15,737 | 0.8 | $39,491 | 42.4 | 7.8 | 27.3 | 0.5 | 3.2 | |
| 48915 / Lansing / MI / 76.8 mi. | 129 | 4,053 | 3.2 | $33,761 | 56.7 | 10.8 | 39.8 | 0.5 | 1.7 | |
| 49068 / Marshall / MI / 90.4 mi. | 129 | 5,951 | 2.2 | $45,961 | 5.0 | 2.7 | 0.3 | 0.5 | 0.5 | |
| 49504 / Standale / MI / 133.5 mi. | 129 | 15,426 | 0.8 | $38,835 | 20.0 | 13.1 | 2.8 | 1.1 | 1.0 | |
| 48117 / Carleton / MI / 24.8 mi. | 128 | 3,637 | 3.5 | $56,393 | 5.7 | 1.5 | 2.3 | 0.3 | 0.1 | |
| 48617 / Clare / MI / 126.6 mi. | 128 | 3,310 | 3.9 | $33,103 | 4.2 | 1.5 | 0.3 | 1.2 | 0.2 | |
| 49512 / Kentwood / MI / 124.9 mi. | 128 | 5,397 | 2.4 | $42,315 | 26.2 | 4.0 | 12.0 | 0.4 | 7.4 | |
| 48708 / Bay City / MI / 89.2 mi. | 127 | 11,769 | 1.1 | $31,903 | 12.8 | 6.9 | 3.0 | 0.7 | 0.5 | |
| 43612 / Toledo / OH / 46.7 mi. | 126 | 13,117 | 1.0 | $39,337 | 12.3 | 4.4 | 5.5 | 0.3 | 0.5 | |
| 49508 / Wyoming / MI / 127 mi. | 125 | 15,347 | 0.8 | $47,495 | 25.3 | 4.8 | 12.8 | 0.3 | 5.1 | |
| 48642 / Midland / MI / 100 mi. | 120 | 12,089 | 1.0 | $48,994 | 6.2 | 1.9 | 1.3 | 0.3 | 1.8 | |
| 48879 / Saint Johns / MI / 84.1 mi. | 120 | 6,206 | 1.9 | $49,875 | 4.6 | 2.7 | 0.4 | 0.4 | 0.4 | |
| 49007 / Kalamazoo / MI / 122 mi. | 119 | 4,671 | 2.5 | $23,383 | 56.4 | 4.8 | 46.9 | 0.5 | 0.9 | |
| 48131 / Rea / MI / 37.9 mi. | 117 | 2,359 | 5.0 | $47,260 | 3.7 | 1.3 | 0.6 | 0.2 | 0.4 | |
| 48433 / Flushing / MI / 60.3 mi. | 117 | 9,705 | 1.2 | $55,915 | 5.8 | 1.8 | 1.9 | 0.4 | 0.6 | |
| 48504 / Northwest / MI / 56.1 mi. | 117 | 14,375 | 0.8 | $30,835 | 72.2 | 2.0 | 66.4 | 0.4 | 0.4 | |
| 49441 / Roosevelt Park / MI / 162.4 mi. | 117 | 16,961 | 0.7 | $37,515 | 13.0 | 3.5 | 6.4 | 0.7 | 0.7 | |
| 48509 / Northeast / MI / 51.6 mi. | 115 | 3,822 | 3.0 | $51,708 | 7.5 | 2.3 | 2.9 | 0.6 | 0.5 | |
| 48912 / Lansing / MI / 74.6 mi. | 113 | 8,127 | 1.4 | $34,588 | 31.2 | 10.7 | 12.8 | 0.8 | 2.8 | |
| 49686 / Traverse City / MI / 196.4 mi. | 113 | 11,895 | 1.0 | $42,650 | 4.1 | 1.6 | 0.3 | 0.8 | 0.5 | |
| 48166 / Newport / MI / 25.5 mi. | 111 | 3,648 | 3.0 | $52,300 | 5.5 | 2.5 | 0.9 | 0.6 | 0.2 | |
| 49756 / Lewiston / MI / 169.4 mi. | 111 | 1,835 | 6.0 | $29,700 | 2.3 | 1.0 | 0.1 | 0.4 | 0.1 | |
| 48367 / Leonard / MI / 33.3 mi. | 110 | 1,653 | 6.7 | $66,224 | 3.9 | 2.3 | 0.2 | 0.2 | 0.3 | |
| 48109 / Ann Arbor / MI / 31.8 mi. | 109 | 95 | 114.7 | $5,000 | 34.0 | 4.4 | 11.5 | 0.3 | 15.3 | |
| 48455 / Metamora / MI / 41.2 mi. | 108 | 3,011 | 3.6 | $64,806 | 2.9 | 1.3 | 0.1 | 0.3 | 0.4 | |
| 48413 / Bad Axe / MI / 95 mi. | 107 | 3,039 | 3.5 | $38,623 | 3.1 | 1.6 | 0.2 | 0.3 | 0.4 | |
| 49008 / Kalamazoo / MI / 122.1 mi. | 102 | 7,266 | 1.4 | $39,462 | 16.5 | 2.2 | 8.2 | 0.3 | 3.9 | |
| 49431 / Ludington / MI / 190.3 mi. | 102 | 6,832 | 1.5 | $34,322 | 6.2 | 3.4 | 0.6 | 0.7 | 0.3 | |
| 48801 / Alma / MI / 101.8 mi. | 100 | 4,597 | 2.2 | $35,875 | 8.2 | 5.7 | 0.4 | 0.4 | 0.7 | |
| 49002 / Portage / MI / 121.7 mi. | 100 | 8,131 | 1.2 | $42,172 | 8.6 | 2.1 | 2.9 | 0.4 | 1.4 | |
| 48854 / Mason / MI / 68 mi. | 99 | 6,285 | 1.6 | $51,746 | 6.4 | 2.6 | 1.7 | 0.5 | 0.7 | |
| 49093 / Three Rivers / MI / 126 mi. | 99 | 7,040 | 1.4 | $39,344 | 12.0 | 2.2 | 6.9 | 0.4 | 0.7 | |
| 48059 / North Lakeport / MI / 55 mi. | 98 | 5,740 | 1.7 | $48,837 | 5.2 | 1.8 | 1.1 | 0.3 | 1.1 | |
| 48473 / Swartz Creek / MI / 54.1 mi. | 97 | 7,563 | 1.3 | $55,109 | 4.7 | 1.7 | 0.9 | 0.4 | 0.6 | |
| 49085 / Saint Joseph / MI / 164.4 mi. | 95 | 9,884 | 1.0 | $49,914 | 7.7 | 1.5 | 2.7 | 0.3 | 2.3 | |
| 49014 / Battle Creek / MI / 98 mi. | 94 | 8,601 | 1.1 | $38,569 | 15.8 | 4.0 | 8.5 | 0.7 | 0.9 | |
| 48732 / Essexville / MI / 89.9 mi. | 93 | 4,941 | 1.9 | $37,347 | 6.4 | 2.5 | 1.2 | 0.6 | 0.7 | |
| 48471 / Sandusky / MI / 70.7 mi. | 92 | 2,265 | 4.1 | $36,667 | 5.4 | 3.0 | 0.5 | 0.2 | 1.0 | |
| 49091 / Sturgis / MI / 118.7 mi. | 92 | 7,656 | 1.2 | $39,839 | 11.4 | 8.6 | 0.8 | 0.2 | 0.8 | |
| 48813 / Charlotte / MI / 86.3 mi. | 90 | 7,545 | 1.2 | $46,924 | 4.9 | 2.8 | 0.5 | 0.3 | 0.4 | |
| 49080 / Plainwell / MI / 123 mi. | 90 | 5,328 | 1.7 | $47,614 | 3.9 | 1.5 | 0.4 | 0.4 | 0.4 | |
| 49548 / Wyoming / MI / 128.5 mi. | 90 | 12,281 | 0.7 | $39,543 | 17.8 | 6.6 | 5.3 | 0.7 | 3.0 | |
| 49855 / Marquette / MI / 336 mi. | 89 | 12,559 | 0.7 | $35,911 | 7.1 | 0.7 | 2.4 | 1.8 | 0.8 | |
| 48722 / Bridgeport / MI / 75.9 mi. | 87 | 1,308 | 6.7 | $41,776 | 14.4 | 5.6 | 7.4 | 0.5 | 0.4 | |
| 48838 / Greenville / MI / 117.8 mi. | 87 | 6,394 | 1.4 | $37,883 | 4.7 | 2.6 | 0.4 | 0.5 | 0.3 | |
| 48846 / Ionia / MI / 104.4 mi. | 87 | 5,572 | 1.6 | $41,071 | 20.6 | 4.1 | 13.4 | 0.6 | 0.5 | |
| 49346 / Stanwood / MI / 135.8 mi. | 85 | 1,839 | 4.6 | $43,482 | 2.7 | 1.1 | 0.3 | 0.4 | 0.2 | |
| 49058 / Hastings / MI / 108.5 mi. | 84 | 6,752 | 1.2 | $44,440 | 3.5 | 1.6 | 0.2 | 0.4 | 0.2 | |
| 49749 / Indian River / MI / 211.9 mi. | 84 | 1,892 | 4.4 | $34,932 | 4.9 | 1.1 | 0.5 | 1.3 | 0.1 | |
| 48503 / Flint / MI / 53.4 mi. | 83 | 12,382 | 0.7 | $29,455 | 52.5 | 2.7 | 45.2 | 0.6 | 0.7 | |
| 49442 / Muskegon / MI / 158.6 mi. | 82 | 15,756 | 0.5 | $31,000 | 32.1 | 5.5 | 22.7 | 0.9 | 0.4 | |
| 43613 / Toledo / OH / 48.3 mi. | 81 | 14,332 | 0.6 | $39,681 | 9.2 | 2.8 | 3.8 | 0.2 | 0.6 | |
| 48450 / Lexington / MI / 63.8 mi. | 81 | 2,224 | 3.6 | $37,404 | 2.7 | 1.6 | 0.1 | 0.5 | 0.1 | |
| 49224 / Albion / MI / 81.6 mi. | 81 | 5,378 | 1.5 | $34,237 | 29.3 | 3.6 | 22.2 | 0.5 | 0.5 | |
| 48182 / Temperance / MI / 43 mi. | 80 | 7,530 | 1.1 | $60,184 | 3.8 | 2.1 | 0.4 | 0.2 | 0.4 | |
| 48656 / Saint Helen / MI / 146.1 mi. | 80 | 2,049 | 3.9 | $27,019 | 2.4 | 0.8 | 0.1 | 0.8 | 0.2 | |
| File | mi_the_detroit_news | |||||||||
| Time | 5/13/05 5:39 PM | |||||||||
| Page | 46 | |||||||||
| Member | 121350B | |||||||||