
|
| Comparing the racial diversity of the journalists | ||||||||||
| at America's daily newspapers | ||||||||||
| with the communities that they serve | ||||||||||
| Newsroom diversity report for | ||||||||||
| The Daily Mining Gazette, Houghton | ||||||||||
| Houghton, Michigan | ||||||||||
| Owner: Ogden Newspapers (W.V.) | ||||||||||
| From a report for the Knight Foundation | ||||||||||
| by Bill Dedman and Stephen K. Doig, June 2005 | ||||||||||
| Click here to read the national report or to select another newspaper | ||||||||||
| Year | Non-white % of newsroom staff | |||||||||
| 2005 | Did not report | |||||||||
| 2004 | 16.7 | |||||||||
| 2003 | Did not report | |||||||||
| 2002 | 18.2 | |||||||||
| 2001 | 25.0 | |||||||||
| 2000 | 0.0 | |||||||||
| 1999 | 0.0 | |||||||||
| 1998 | 0.0 | |||||||||
| 1997 | 0.0 | |||||||||
| 1996 | Did not report | |||||||||
| 1995 | 0.0 | |||||||||
| 1994 | 0.0 | |||||||||
| 1993 | 0.0 | |||||||||
| 1992 | Did not report | |||||||||
| 1991 | Did not report | |||||||||
| 1990 | 0.0 | |||||||||
| The latest year at peak is | 2001 | |||||||||
| See the notes and definitions section below for the sources of these figures. | ||||||||||
| Newsroom Diversity Index | ||||||||||
| for The Daily Mining Gazette, Houghton | ||||||||||
| Year | Non-white % of newsroom staff | Non-white % of circulation area | Newsroom Diversity Index (parity=100) | |||||||
| 2005 | N/A | 7.7 | N/A | |||||||
| 2004 | 16.7 | 7.7 | 217 | |||||||
| How the index is calculated | ||||||||||
| The Newsroom Diversity Index is the non-white percentage of the newsroom staff | ||||||||||
| divided by the non-white percentage of residents in the circulation area. | ||||||||||
| (Parity = 100.) | ||||||||||
| Company index | ||||||||||
| This newspaper's owner, Ogden Newspapers (W.V.), | ||||||||||
| has a companywide, circulation-weighted Diversity Index of 12. | ||||||||||
| See the notes and definitions section below for the sources of these figures. | ||||||||||
| Peer group comparison | ||||||||||
| for The Daily Mining Gazette, Houghton | ||||||||||
| This paper | ||||||||||
| Peer group | ||||||||||
| The median Diversity Index is 33 for all newspapers | ||||||||||
| reporting in this circulation category of 10,001 to 25,000 daily sales. | ||||||||||
| An example of a newspaper of similar circulation, in an area of similar level of non-white residents, but one that has a relatively high Diversity Index, is The Herald, Sharon, Pennsylvania, with a 8 percent non-white staff in a community that is 7.3 percent non-white. Its index is 110. | ||||||||||
| FYI, in circulation, this newspaper's average weekday circulation of | ||||||||||
| approximately 10,027 ranks 797 out of 1,410 daily newspapers in the US. | ||||||||||
| See the notes and definitions section below for the sources of these figures. | ||||||||||
| Details on race/ethnicity | ||||||||||
| in the circulation area | ||||||||||
| and the home county | ||||||||||
| of The Daily Mining Gazette, Houghton | ||||||||||
| Circulation area | ||||||||||
| Race/ethnicity | % of population | Number of residents | 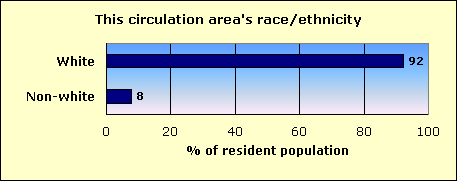
|
|||||||
| Hispanic | 0.8 | 381 | ||||||||
| Black | 1.7 | 846 | ||||||||
| Asian and Pacific Islander | 1.3 | 676 | ||||||||
| Native-American | 2.5 | 1,263 | ||||||||
| Other non-white | 0.1 | 27 | ||||||||
| Multi-racial | 1.4 | 710 | ||||||||
| Non-white | 7.7 | 3,903 | ||||||||
| White | 92.3 | 46,741 | ||||||||
| Total | 50,644 | |||||||||
| Home county: Houghton | ||||||||||
| Race/ethnicity | % of population | Number of residents | 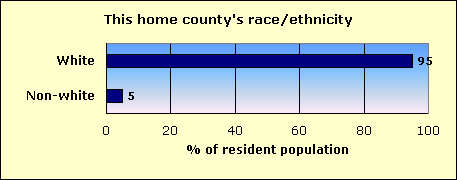
|
|||||||
| Hispanic | 0.7 | 251 | ||||||||
| Black | 0.9 | 334 | ||||||||
| Asian and Pacific Islander | 1.8 | 650 | ||||||||
| Native-American | 0.5 | 186 | ||||||||
| Other non-white | 0.1 | 21 | ||||||||
| Multi-racial | 0.9 | 335 | ||||||||
| Non-white | 4.9 | 1,777 | ||||||||
| White | 95.1 | 34,239 | ||||||||
| Total | 36,016 | |||||||||
| The home county of this newspaper is Houghton. | ||||||||||
| About this report | ||||||||||
| This third annual report for the Knight Foundation adds context to an annual survey by the American Society of Newspaper Editors. ASNE has set a goal that | ||||||||||
| every newspaper, to help it know its community and gather the news, should employ at least one non-white journalist, and that newspapers should strive to | ||||||||||
| employ non-whites in proportion to their share of the community. ASNE's report, at www.asne.org, shows each newspaper's non-white employment, but does | ||||||||||
| not disclose how closely that employment mirrors the newspaper's circulation area. | ||||||||||
| That gap is filled by the report you are reading now. This report was not done by ASNE, but was done for the Knight Foundation by Bill Dedman and | ||||||||||
| Stephen K. Doig. It shows how close each newspaper is to ASNE's goal, by comparing the newsroom staffing with the circulation area population. | ||||||||||
| The full report is at www.powerreporting.com/knight. | ||||||||||
| Notes and definitions | ||||||||||
| 1. The Newsroom Diversity Index is the non-white percentage of the newsroom staff divided by the non-white percentage of the circulation area's residents. Parity = 100. | ||||||||||
| 2. Source for staffing: Survey by American Society of Newspaper Editors, April 2005. Newspapers report non-white staff as of the end of the previous year. | ||||||||||
| 3. Following ASNE's definition, newsroom staff includes only supervisors, reporters, editors, copy/layout editors and photographers. | ||||||||||
| 4. Also following ASNE's definition, "whites," "blacks," etc., exclude Hispanics, who are counted in a separate category. | ||||||||||
| 5. Source for boundaries of this newspaper's circulation area: ZIP Code circulation data, Audit Bureau of Circulations, latest available. | ||||||||||
| 6. A paper may define its circulation area differently for marketing efforts, or news coverage, or to set advertising rates. | ||||||||||
| 7. If ZIP Codes or counties are used, this report applies a threshold: 10 percent household penetration is required to include an area in the circulation area. | ||||||||||
| 8. Source for the demographics of residents of that circulation area: US Census 2000. | ||||||||||
| 9. Source for total circulation: Editor & Publisher magazine, Monday-Friday average at year-end 2004. | ||||||||||
| 10. Staff of non-English publications, such as the Miami Herald's El Nuevo Herald, are excluded from the ASNE staffing survey for the first time this year. | ||||||||||
| Demographics of ZIP Codes | ||||||||||
| where sales were reported by | ||||||||||
| The Daily Mining Gazette, Houghton | ||||||||||
| Note that some ZIP Codes listed here may not have been included in determining the newspaper's circulation area. In calculating the Diversity Index, a | ||||||||||
| ZIP Code was included only if the household penetration was at least 10 percent. Any lower-penetration ZIP Codes are also listed here for your information. | ||||||||||
| Also, if the newspaper reported more than 300 ZIP Codes, only the top 300 in weekday sales are listed here. | ||||||||||
| ZIP / City / State / Approx. distance in miles from the newspaper's home office | Weekday sales | Households | Penetration % (daily sales per 100 households) | Median household income | Non-white % of population |
Hispanic % of population |
Black % of population |
Native % of population |
Asian % of population |
|
| 49931 / Houghton / MI / 0 mi. | 1,991 | 2,904 | 68.6 | $26,361 | 9.9 | 0.8 | 1.5 | 0.4 | 5.8 | |
| 49913 / Laurium / MI / 9.4 mi. | 1,859 | 3,288 | 56.5 | $26,233 | 2.1 | 0.9 | 0.1 | 0.4 | 0.1 | |
| 49930 / Ripley / MI / 1.6 mi. | 1,539 | 2,504 | 61.5 | $29,472 | 3.7 | 0.7 | 0.6 | 0.7 | 0.8 | |
| 49945 / Lake Linden / MI / 8.3 mi. | 644 | 1,154 | 55.8 | $30,169 | 2.0 | 0.4 | 0.1 | 0.4 | 0.4 | |
| 49946 / L'Anse / MI / 23.6 mi. | 522 | 1,707 | 30.6 | $33,670 | 16.9 | 0.7 | 0.1 | 13.1 | 0.2 | |
| 49916 / Chassell / MI / 6 mi. | 489 | 1,047 | 46.7 | $36,076 | 3.0 | 0.5 | 0.0 | 0.9 | 0.5 | |
| 49953 / Ontonagon / MI / 37.2 mi. | 356 | 1,442 | 24.7 | $32,315 | 3.0 | 0.8 | 0.0 | 0.8 | 0.2 | |
| 49908 / Keweenaw Bay / MI / 22.2 mi. | 295 | 1,013 | 29.1 | $32,171 | 36.0 | 1.3 | 13.6 | 15.1 | 0.5 | |
| 49950 / Mohawk / MI / 16.1 mi. | 282 | 578 | 48.8 | $30,648 | 7.6 | 1.1 | 5.6 | 0.1 | 0.0 | |
| 49905 / Atlantic Mine / MI / 5.1 mi. | 258 | 548 | 47.1 | $36,518 | 2.8 | 0.3 | 0.1 | 0.2 | 0.8 | |
| 49958 / Pelkie / MI / 25.3 mi. | 226 | 539 | 41.9 | $34,375 | 4.7 | 0.3 | 0.0 | 2.4 | 0.5 | |
| 49963 / South Range / MI / 4.7 mi. | 222 | 331 | 67.1 | $23,194 | 4.4 | 0.9 | 2.3 | 0.1 | 0.3 | |
| 49934 / Hubbell / MI / 6.9 mi. | 208 | 360 | 57.8 | $29,483 | 2.8 | 1.2 | 0.1 | 0.1 | 0.1 | |
| 49922 / Dollar Bay / MI / 2.6 mi. | 177 | 490 | 36.1 | $34,167 | 2.4 | 0.4 | 0.5 | 0.6 | 0.3 | |
| 49948 / Mass City / MI / 32.5 mi. | 105 | 305 | 34.4 | $30,648 | 3.2 | 1.5 | 0.0 | 0.2 | 0.0 | |
| 49965 / Toivola / MI / 17.1 mi. | 102 | 198 | 51.5 | $22,109 | 3.7 | 0.5 | 0.2 | 0.5 | 0.5 | |
| 49901 / Ahmeek / MI / 13.7 mi. | 96 | 191 | 50.3 | $24,125 | 1.8 | 0.0 | 0.0 | 0.0 | 0.3 | |
| 49955 / Painesdale / MI / 6.8 mi. | 80 | 183 | 43.7 | $29,083 | 20.7 | 1.2 | 17.7 | 0.3 | 0.0 | |
| 49805 / Allouez / MI / 12.9 mi. | 64 | 100 | 64.0 | $23,125 | 2.3 | 0.5 | 0.0 | 0.5 | 0.5 | |
| 49921 / Houghton / MI / 1.9 mi. | 51 | 151 | 33.8 | $27,614 | 4.4 | 1.0 | 0.0 | 0.5 | 1.7 | |
| 49971 / White Pine / MI / 50.6 mi. | 43 | 293 | 14.7 | $26,250 | 4.6 | 0.5 | 0.0 | 2.4 | 0.0 | |
| 49917 / Copper City / MI / 13.3 mi. | 39 | 76 | 51.3 | $24,125 | 2.1 | 0.0 | 0.0 | 0.0 | 1.1 | |
| 49918 / Copper Harbor / MI / 37.2 mi. | 37 | 33 | 112.1 | $42,917 | 4.0 | 1.3 | 0.0 | 0.0 | 0.0 | |
| 49929 / Greenland / MI / 31.9 mi. | 32 | 69 | 46.4 | $37,857 | 4.4 | 0.6 | 0.0 | 1.3 | 0.0 | |
| 49960 / Rockland / MI / 36.4 mi. | 24 | 110 | 21.8 | $30,500 | 2.6 | 0.4 | 0.0 | 1.1 | 0.8 | |
| File | mi_the_daily_mining_gazette__houghton | |||||||||
| Time | 5/21/05 9:39 PM | |||||||||
| Page | 796 | |||||||||
| Member | 121750 | |||||||||