
|
| Comparing the racial diversity of the journalists | ||||||||||
| at America's daily newspapers | ||||||||||
| with the communities that they serve | ||||||||||
| Newsroom diversity report for | ||||||||||
| Iron Mountain-Kingsford Daily News | ||||||||||
| Iron Mountain, Michigan | ||||||||||
| Owner: Ogden Newspapers (W.V.) | ||||||||||
| From a report for the Knight Foundation | ||||||||||
| by Bill Dedman and Stephen K. Doig, June 2005 | ||||||||||
| Click here to read the national report or to select another newspaper | ||||||||||
| Year | Non-white % of newsroom staff | |||||||||
| 2005 | Did not report | |||||||||
| 2004 | 10.0 | |||||||||
| 2003 | Did not report | |||||||||
| 2002 | Did not report | |||||||||
| 2001 | Did not report | |||||||||
| 2000 | Did not report | |||||||||
| 1999 | Did not report | |||||||||
| 1998 | Did not report | |||||||||
| 1997 | Did not report | |||||||||
| 1996 | 0.0 | |||||||||
| 1995 | Did not report | |||||||||
| 1994 | Did not report | |||||||||
| 1993 | Did not report | |||||||||
| 1992 | Did not report | |||||||||
| 1991 | Did not report | |||||||||
| 1990 | Did not report | |||||||||
| The latest year at peak is | 2004 | |||||||||
| See the notes and definitions section below for the sources of these figures. | ||||||||||
| Newsroom Diversity Index | ||||||||||
| for Iron Mountain-Kingsford Daily News | ||||||||||
| Year | Non-white % of newsroom staff | Non-white % of circulation area | Newsroom Diversity Index (parity=100) | |||||||
| 2005 | N/A | 2.8 | N/A | |||||||
| 2004 | 10.0 | 2.8 | 357 | |||||||
| How the index is calculated | ||||||||||
| The Newsroom Diversity Index is the non-white percentage of the newsroom staff | ||||||||||
| divided by the non-white percentage of residents in the circulation area. | ||||||||||
| (Parity = 100.) | ||||||||||
| Company index | ||||||||||
| This newspaper's owner, Ogden Newspapers (W.V.), | ||||||||||
| has a companywide, circulation-weighted Diversity Index of 12. | ||||||||||
| See the notes and definitions section below for the sources of these figures. | ||||||||||
| Peer group comparison | ||||||||||
| for Iron Mountain-Kingsford Daily News | ||||||||||
| This paper | ||||||||||
| Peer group | ||||||||||
| The median Diversity Index is 0 for all newspapers | ||||||||||
| reporting in this circulation category of 5,001 to 10,000 daily sales. | ||||||||||
| An example of a newspaper of similar circulation, in an area of similar level of non-white residents, but one that has a relatively high Diversity Index, is Eagle Times, Claremont, New Hampshire, with a 4.8 percent non-white staff in a community that is 2.6 percent non-white. Its index is 188. | ||||||||||
| FYI, in circulation, this newspaper's average weekday circulation of | ||||||||||
| approximately 9,600 ranks 818 out of 1,410 daily newspapers in the US. | ||||||||||
| See the notes and definitions section below for the sources of these figures. | ||||||||||
| Details on race/ethnicity | ||||||||||
| in the circulation area | ||||||||||
| and the home county | ||||||||||
| of Iron Mountain-Kingsford Daily News | ||||||||||
| Circulation area | ||||||||||
| Race/ethnicity | % of population | Number of residents | 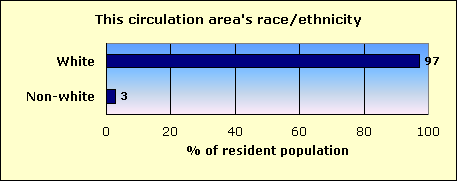
|
|||||||
| Hispanic | 0.7 | 349 | ||||||||
| Black | 0.4 | 190 | ||||||||
| Asian and Pacific Islander | 0.3 | 161 | ||||||||
| Native-American | 0.6 | 295 | ||||||||
| Other non-white | 0.0 | 16 | ||||||||
| Multi-racial | 0.8 | 388 | ||||||||
| Non-white | 2.8 | 1,399 | ||||||||
| White | 97.2 | 48,635 | ||||||||
| Total | 50,034 | |||||||||
| Home county: Dickinson | ||||||||||
| Race/ethnicity | % of population | Number of residents | 
|
|||||||
| Hispanic | 0.7 | 187 | ||||||||
| Black | 0.1 | 32 | ||||||||
| Asian and Pacific Islander | 0.4 | 115 | ||||||||
| Native-American | 0.5 | 135 | ||||||||
| Other non-white | 0.0 | 9 | ||||||||
| Multi-racial | 0.7 | 200 | ||||||||
| Non-white | 2.5 | 678 | ||||||||
| White | 97.5 | 26,794 | ||||||||
| Total | 27,472 | |||||||||
| The home county of this newspaper is Dickinson. | ||||||||||
| About this report | ||||||||||
| This third annual report for the Knight Foundation adds context to an annual survey by the American Society of Newspaper Editors. ASNE has set a goal that | ||||||||||
| every newspaper, to help it know its community and gather the news, should employ at least one non-white journalist, and that newspapers should strive to | ||||||||||
| employ non-whites in proportion to their share of the community. ASNE's report, at www.asne.org, shows each newspaper's non-white employment, but does | ||||||||||
| not disclose how closely that employment mirrors the newspaper's circulation area. | ||||||||||
| That gap is filled by the report you are reading now. This report was not done by ASNE, but was done for the Knight Foundation by Bill Dedman and | ||||||||||
| Stephen K. Doig. It shows how close each newspaper is to ASNE's goal, by comparing the newsroom staffing with the circulation area population. | ||||||||||
| The full report is at www.powerreporting.com/knight. | ||||||||||
| Notes and definitions | ||||||||||
| 1. The Newsroom Diversity Index is the non-white percentage of the newsroom staff divided by the non-white percentage of the circulation area's residents. Parity = 100. | ||||||||||
| 2. Source for staffing: Survey by American Society of Newspaper Editors, April 2005. Newspapers report non-white staff as of the end of the previous year. | ||||||||||
| 3. Following ASNE's definition, newsroom staff includes only supervisors, reporters, editors, copy/layout editors and photographers. | ||||||||||
| 4. Also following ASNE's definition, "whites," "blacks," etc., exclude Hispanics, who are counted in a separate category. | ||||||||||
| 5. Source for boundaries of this newspaper's circulation area: ZIP Code circulation data, Audit Bureau of Circulations, latest available. | ||||||||||
| 6. A paper may define its circulation area differently for marketing efforts, or news coverage, or to set advertising rates. | ||||||||||
| 7. If ZIP Codes or counties are used, this report applies a threshold: 10 percent household penetration is required to include an area in the circulation area. | ||||||||||
| 8. Source for the demographics of residents of that circulation area: US Census 2000. | ||||||||||
| 9. Source for total circulation: Editor & Publisher magazine, Monday-Friday average at year-end 2004. | ||||||||||
| 10. Staff of non-English publications, such as the Miami Herald's El Nuevo Herald, are excluded from the ASNE staffing survey for the first time this year. | ||||||||||
| Demographics of ZIP Codes | ||||||||||
| where sales were reported by | ||||||||||
| Iron Mountain-Kingsford Daily News | ||||||||||
| Note that some ZIP Codes listed here may not have been included in determining the newspaper's circulation area. In calculating the Diversity Index, a | ||||||||||
| ZIP Code was included only if the household penetration was at least 10 percent. Any lower-penetration ZIP Codes are also listed here for your information. | ||||||||||
| Also, if the newspaper reported more than 300 ZIP Codes, only the top 300 in weekday sales are listed here. | ||||||||||
| ZIP / City / State / Approx. distance in miles from the newspaper's home office | Weekday sales | Households | Penetration % (daily sales per 100 households) | Median household income | Non-white % of population |
Hispanic % of population |
Black % of population |
Native % of population |
Asian % of population |
|
| 49801 / Kingsford / MI / 0 mi. | 3,291 | 5,170 | 63.7 | $35,495 | 2.7 | 0.8 | 0.1 | 0.5 | 0.6 | |
| 49802 / Kingsford / MI / 0.2 mi. | 1,433 | 2,929 | 48.9 | $33,846 | 2.4 | 0.5 | 0.2 | 0.5 | 0.4 | |
| 49870 / Norway / MI / 7.7 mi. | 819 | 1,469 | 55.8 | $33,250 | 2.6 | 0.7 | 0.0 | 0.8 | 0.2 | |
| 54151 / Niagara / WI / 5.1 mi. | 724 | 1,615 | 44.8 | $35,031 | 1.8 | 0.8 | 0.2 | 0.3 | 0.2 | |
| 54121 / Florence / WI / 10.6 mi. | 551 | 1,339 | 41.2 | $36,045 | 1.8 | 0.2 | 0.1 | 0.3 | 0.3 | |
| 49935 / Iron River / MI / 32.3 mi. | 522 | 2,506 | 20.8 | $28,455 | 5.4 | 0.6 | 2.1 | 1.3 | 0.1 | |
| 49920 / Crystal Falls / MI / 22.4 mi. | 519 | 1,972 | 26.3 | $30,804 | 2.5 | 0.8 | 0.2 | 0.3 | 0.2 | |
| 49876 / Quinnesec / MI / 3.6 mi. | 324 | 439 | 73.8 | $41,685 | 1.7 | 0.2 | 0.0 | 0.5 | 0.3 | |
| 49892 / Vulcan / MI / 9.2 mi. | 314 | 812 | 38.7 | $38,393 | 1.9 | 0.4 | 0.1 | 0.2 | 0.2 | |
| 54156 / Pembine / WI / 16.6 mi. | 149 | 732 | 20.4 | $32,159 | 5.0 | 1.8 | 0.6 | 1.3 | 0.4 | |
| 49831 / Northland / MI / 15.9 mi. | 131 | 23 | 569.6 | $17,917 | 0.0 | 0.0 | 0.0 | 0.0 | 0.0 | |
| 49815 / Channing / MI / 21.8 mi. | 91 | 225 | 40.4 | $31,364 | 2.0 | 1.7 | 0.0 | 0.2 | 0.0 | |
| 49881 / Sagola / MI / 16.2 mi. | 81 | 150 | 54.0 | $34,792 | 1.6 | 0.8 | 0.0 | 0.3 | 0.0 | |
| 49915 / Caspian / MI / 29.8 mi. | 80 | 414 | 19.3 | $25,139 | 3.1 | 0.2 | 0.3 | 1.4 | 0.6 | |
| 49847 / Hermansville / MI / 19.6 mi. | 73 | 444 | 16.4 | $33,409 | 2.0 | 1.3 | 0.1 | 0.3 | 0.0 | |
| 49852 / Vulcan / MI / 11.5 mi. | 51 | 57 | 89.5 | $27,917 | 0.0 | 0.0 | 0.0 | 0.0 | 0.0 | |
| 49874 / Powers / MI / 26.9 mi. | 46 | 369 | 12.5 | $30,795 | 2.4 | 0.5 | 0.0 | 0.8 | 0.1 | |
| 49807 / Schaffer / MI / 37.5 mi. | 42 | 1,407 | 3.0 | $39,915 | 4.7 | 0.1 | 0.1 | 2.7 | 0.2 | |
| 49834 / Foster City / MI / 21.4 mi. | 41 | 116 | 35.3 | $27,143 | 3.9 | 0.0 | 0.0 | 0.0 | 0.7 | |
| 54103 / Armstrong Creek / WI / 19.6 mi. | 38 | 245 | 15.5 | $30,750 | 3.2 | 1.9 | 0.0 | 0.6 | 0.6 | |
| 49903 / Amasa / MI / 31.7 mi. | 36 | 75 | 48.0 | $30,714 | 9.0 | 1.2 | 0.0 | 1.8 | 1.2 | |
| 54125 / Goodman / WI / 17.8 mi. | 36 | 285 | 12.6 | $30,109 | 2.9 | 1.1 | 0.2 | 0.6 | 0.2 | |
| 54119 / Pembine / WI / 15.6 mi. | 35 | 276 | 12.7 | $32,500 | 3.4 | 0.9 | 0.1 | 0.5 | 1.0 | |
| 49902 / Alpha / MI / 16.6 mi. | 34 | 90 | 37.8 | $21,500 | 1.0 | 0.0 | 0.0 | 0.0 | 0.0 | |
| 54120 / Fence / WI / 17.3 mi. | 28 | 162 | 17.3 | $35,278 | 1.7 | 0.3 | 0.3 | 0.9 | 0.0 | |
| 49927 / Gaastra / MI / 27.9 mi. | 23 | 194 | 11.9 | $28,333 | 4.1 | 0.6 | 1.9 | 0.4 | 0.0 | |
| 54542 / Tipler / WI / 32.1 mi. | 18 | 288 | 6.3 | $27,500 | 3.1 | 0.8 | 0.0 | 0.8 | 0.2 | |
| File | mi_iron_mountain-kingsford_daily_news | |||||||||
| Time | 5/21/05 11:12 PM | |||||||||
| Page | 817 | |||||||||
| Member | 121800 | |||||||||