
|
| Comparing the racial diversity of the journalists | ||||||||||
| at America's daily newspapers | ||||||||||
| with the communities that they serve | ||||||||||
| Newsroom diversity report for | ||||||||||
| Bangor Daily News | ||||||||||
| Bangor, Maine | ||||||||||
| From a report for the Knight Foundation | ||||||||||
| by Bill Dedman and Stephen K. Doig, June 2005 | ||||||||||
| Click here to read the national report or to select another newspaper | ||||||||||
| Year | Non-white % of newsroom staff | 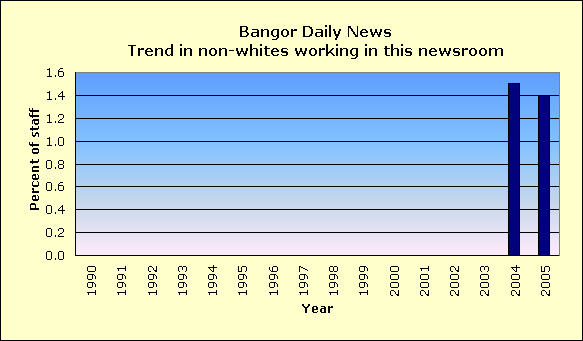
|
||||||||
| 2005 | 1.4 | |||||||||
| 2004 | 1.5 | |||||||||
| 2003 | 0.0 | |||||||||
| 2002 | 0.0 | |||||||||
| 2001 | 0.0 | |||||||||
| 2000 | 0.0 | |||||||||
| 1999 | 0.0 | |||||||||
| 1998 | 0.0 | |||||||||
| 1997 | 0.0 | |||||||||
| 1996 | 0.0 | |||||||||
| 1995 | 0.0 | |||||||||
| 1994 | Did not report | |||||||||
| 1993 | Did not report | |||||||||
| 1992 | Did not report | |||||||||
| 1991 | Did not report | |||||||||
| 1990 | Did not report | |||||||||
| The latest year at peak is | 2004 | |||||||||
| See the notes and definitions section below for the sources of these figures. | ||||||||||
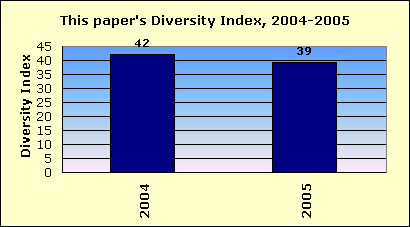
| Newsroom Diversity Index | ||||||||||
| for Bangor Daily News | ||||||||||
 |
||||||||||
| Year | Non-white % of newsroom staff | Non-white % of circulation area | Newsroom Diversity Index (parity=100) | |||||||
| 2005 | 1.4 | 3.6 | 39 | |||||||
| 2004 | 1.5 | 3.6 | 42 | |||||||
| How the index is calculated | ||||||||||
| The Newsroom Diversity Index is the non-white percentage of the newsroom staff | ||||||||||
| divided by the non-white percentage of residents in the circulation area. | ||||||||||
| (Parity = 100.) | ||||||||||
| See the notes and definitions section below for the sources of these figures. | ||||||||||
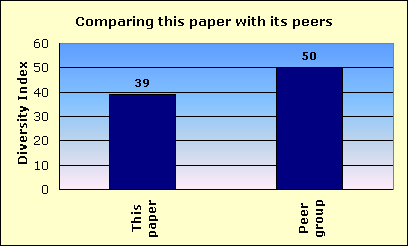
| Peer group comparison | ||||||||||
| for Bangor Daily News | ||||||||||
 |
||||||||||
| This newspaper's Newsroom Diversity Index is 39. | This paper | |||||||||
| Peer group | ||||||||||
| Compare that with 50, which is the median Diversity Index for all newspapers | ||||||||||
| reporting in this circulation category of 50,001 to 100,000 daily sales. | ||||||||||
| In that group, this newspaper's Diversity Index ranks 57 out of 90 | ||||||||||
| newspapers reporting in the category of 50,001 to 100,000 daily sales. | ||||||||||
| An example of a newspaper of similar circulation, in an area of similar level of non-white residents, but one that has a relatively high Diversity Index, is Bangor Daily News, Maine, with a 1.4 percent non-white staff in a community that is 3.6 percent non-white. Its index is 39. | ||||||||||
| FYI, in circulation, this newspaper's average weekday circulation of | ||||||||||
| approximately 62,462 ranks 166 out of 1,410 daily newspapers in the US. | ||||||||||
| See the notes and definitions section below for the sources of these figures. | ||||||||||
| Details on race/ethnicity | ||||||||||
| in the circulation area | ||||||||||
| and the home county | ||||||||||
| of Bangor Daily News | ||||||||||
| Circulation area | ||||||||||
| Race/ethnicity | % of population | Number of residents | 
|
|||||||
| Hispanic | 0.6 | 2,426 | ||||||||
| Black | 0.3 | 1,337 | ||||||||
| Asian and Pacific Islander | 0.5 | 2,023 | ||||||||
| Native-American | 1.1 | 4,358 | ||||||||
| Other non-white | 0.1 | 240 | ||||||||
| Multi-racial | 0.9 | 3,502 | ||||||||
| Non-white | 3.6 | 13,886 | ||||||||
| White | 96.5 | 376,796 | ||||||||
| Total | 390,682 | |||||||||
| Home county: Penobscot | ||||||||||
| Race/ethnicity | % of population | Number of residents | 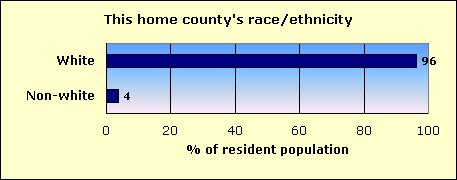
|
|||||||
| Hispanic | 0.6 | 882 | ||||||||
| Black | 0.5 | 684 | ||||||||
| Asian and Pacific Islander | 0.7 | 1,047 | ||||||||
| Native-American | 1.0 | 1,423 | ||||||||
| Other non-white | 0.1 | 122 | ||||||||
| Multi-racial | 0.9 | 1,300 | ||||||||
| Non-white | 3.8 | 5,458 | ||||||||
| White | 96.2 | 139,461 | ||||||||
| Total | 144,919 | |||||||||
| The home county of this newspaper is Penobscot. | ||||||||||
| About this report | ||||||||||
| This third annual report for the Knight Foundation adds context to an annual survey by the American Society of Newspaper Editors. ASNE has set a goal that | ||||||||||
| every newspaper, to help it know its community and gather the news, should employ at least one non-white journalist, and that newspapers should strive to | ||||||||||
| employ non-whites in proportion to their share of the community. ASNE's report, at www.asne.org, shows each newspaper's non-white employment, but does | ||||||||||
| not disclose how closely that employment mirrors the newspaper's circulation area. | ||||||||||
| That gap is filled by the report you are reading now. This report was not done by ASNE, but was done for the Knight Foundation by Bill Dedman and | ||||||||||
| Stephen K. Doig. It shows how close each newspaper is to ASNE's goal, by comparing the newsroom staffing with the circulation area population. | ||||||||||
| The full report is at www.powerreporting.com/knight. | ||||||||||
| Notes and definitions | ||||||||||
| 1. The Newsroom Diversity Index is the non-white percentage of the newsroom staff divided by the non-white percentage of the circulation area's residents. Parity = 100. | ||||||||||
| 2. Source for staffing: Survey by American Society of Newspaper Editors, April 2005. Newspapers report non-white staff as of the end of the previous year. | ||||||||||
| 3. Following ASNE's definition, newsroom staff includes only supervisors, reporters, editors, copy/layout editors and photographers. | ||||||||||
| 4. Also following ASNE's definition, "whites," "blacks," etc., exclude Hispanics, who are counted in a separate category. | ||||||||||
| 5. Source for boundaries of this newspaper's circulation area: ZIP Code circulation data, Audit Bureau of Circulations, latest available. | ||||||||||
| 6. A paper may define its circulation area differently for marketing efforts, or news coverage, or to set advertising rates. | ||||||||||
| 7. If ZIP Codes or counties are used, this report applies a threshold: 10 percent household penetration is required to include an area in the circulation area. | ||||||||||
| 8. Source for the demographics of residents of that circulation area: US Census 2000. | ||||||||||
| 9. Source for total circulation: Editor & Publisher magazine, Monday-Friday average at year-end 2004. | ||||||||||
| 10. Staff of non-English publications, such as the Miami Herald's El Nuevo Herald, are excluded from the ASNE staffing survey for the first time this year. | ||||||||||
| Demographics of ZIP Codes | ||||||||||
| where sales were reported by | ||||||||||
| Bangor Daily News | ||||||||||
| Note that some ZIP Codes listed here may not have been included in determining the newspaper's circulation area. In calculating the Diversity Index, a | ||||||||||
| ZIP Code was included only if the household penetration was at least 10 percent. Any lower-penetration ZIP Codes are also listed here for your information. | ||||||||||
| Also, if the newspaper reported more than 300 ZIP Codes, only the top 300 in weekday sales are listed here. | ||||||||||
| ZIP / City / State / Approx. distance in miles from the newspaper's home office | Weekday sales | Households | Penetration % (daily sales per 100 households) | Median household income | Non-white % of population |
Hispanic % of population |
Black % of population |
Native % of population |
Asian % of population |
|
| 04401 / Veazie / ME / 1.2 mi. | 9,222 | 17,127 | 53.8 | $32,393 | 5.0 | 0.9 | 0.8 | 0.9 | 1.0 | |
| 04605 / Trenton / ME / 25 mi. | 2,276 | 4,614 | 49.3 | $35,679 | 2.7 | 0.5 | 0.2 | 0.5 | 0.4 | |
| 04412 / Brewer / ME / 3.5 mi. | 2,233 | 3,842 | 58.1 | $36,949 | 2.8 | 0.6 | 0.3 | 0.6 | 0.6 | |
| 04444 / Newburgh / ME / 5.8 mi. | 1,657 | 2,992 | 55.4 | $50,853 | 2.3 | 0.5 | 0.4 | 0.3 | 0.5 | |
| 04468 / Old Town / ME / 8.7 mi. | 1,577 | 4,081 | 38.6 | $30,469 | 9.9 | 0.5 | 0.6 | 6.1 | 1.6 | |
| 04609 / Bar Harbor / ME / 39.2 mi. | 1,420 | 2,114 | 67.2 | $37,405 | 2.6 | 0.6 | 0.1 | 0.2 | 0.9 | |
| 04730 / Littleton / ME / 93.6 mi. | 1,364 | 4,237 | 32.2 | $27,419 | 4.9 | 0.5 | 0.3 | 3.2 | 0.4 | |
| 04769 / Presque Isle / ME / 124.2 mi. | 1,332 | 3,963 | 33.6 | $29,325 | 5.2 | 0.7 | 0.3 | 2.3 | 0.9 | |
| 04915 / Waldo / ME / 28.5 mi. | 1,323 | 3,541 | 37.4 | $31,991 | 3.1 | 0.8 | 0.2 | 0.3 | 0.3 | |
| 04462 / Millinocket / ME / 53.2 mi. | 1,173 | 2,377 | 49.3 | $29,595 | 1.6 | 0.2 | 0.1 | 0.5 | 0.3 | |
| 04736 / Woodland / ME / 134.4 mi. | 1,112 | 4,274 | 26.0 | $29,371 | 4.0 | 0.5 | 0.4 | 1.4 | 0.9 | |
| 04473 / Orono / ME / 6.3 mi. | 1,098 | 2,691 | 40.8 | $30,619 | 7.1 | 1.2 | 1.3 | 0.9 | 2.5 | |
| 04416 / Verona / ME / 16.7 mi. | 938 | 1,973 | 47.5 | $35,339 | 2.6 | 0.8 | 0.1 | 0.3 | 0.2 | |
| 04429 / Holden / ME / 8.2 mi. | 931 | 1,744 | 53.4 | $50,494 | 2.1 | 0.3 | 0.2 | 0.5 | 0.5 | |
| 04426 / Sebec / ME / 30.2 mi. | 785 | 2,088 | 37.6 | $30,412 | 3.4 | 0.9 | 0.2 | 0.5 | 0.5 | |
| 04619 / Calais / ME / 72.3 mi. | 757 | 1,491 | 50.8 | $24,741 | 3.4 | 0.7 | 0.4 | 0.6 | 0.7 | |
| 04457 / Mattamiscontis Township / ME / 36.5 mi. | 746 | 2,855 | 26.1 | $31,554 | 1.8 | 0.4 | 0.1 | 0.3 | 0.3 | |
| 04841 / Rockland / ME / 49 mi. | 705 | 3,460 | 20.4 | $30,179 | 2.5 | 0.6 | 0.2 | 0.2 | 0.6 | |
| 04930 / Ripley / ME / 25.8 mi. | 653 | 1,797 | 36.3 | $27,090 | 1.8 | 0.6 | 0.3 | 0.2 | 0.1 | |
| 04474 / Orrington / ME / 7.6 mi. | 616 | 1,396 | 44.1 | $44,327 | 1.0 | 0.1 | 0.2 | 0.1 | 0.2 | |
| 04953 / Newport / ME / 21.9 mi. | 585 | 1,270 | 46.1 | $30,091 | 2.1 | 0.4 | 0.2 | 0.4 | 0.4 | |
| 04654 / Whitneyville / ME / 60.9 mi. | 561 | 1,474 | 38.1 | $26,086 | 3.5 | 0.5 | 0.5 | 0.8 | 1.0 | |
| 04743 / Saint John Plt / ME / 156.2 mi. | 533 | 1,988 | 26.8 | $29,666 | 2.9 | 0.4 | 0.3 | 0.7 | 0.7 | |
| 04756 / Madawaska / ME / 137.3 mi. | 475 | 1,686 | 28.2 | $32,177 | 1.9 | 0.2 | 0.1 | 0.5 | 0.6 | |
| 04496 / Winterport / ME / 12.8 mi. | 474 | 1,379 | 34.4 | $40,776 | 2.2 | 0.4 | 0.2 | 0.5 | 0.3 | |
| 04461 / Milford / ME / 10.2 mi. | 458 | 1,180 | 38.8 | $39,500 | 3.6 | 0.5 | 0.1 | 1.3 | 0.5 | |
| 04614 / Blue Hill / ME / 33.9 mi. | 453 | 932 | 48.6 | $30,114 | 1.8 | 0.1 | 0.3 | 0.2 | 0.1 | |
| 04463 / Orneville Township / ME / 28.3 mi. | 445 | 1,175 | 37.9 | $25,521 | 1.7 | 0.2 | 0.3 | 0.6 | 0.2 | |
| 04843 / Camden / ME / 42.3 mi. | 412 | 2,388 | 17.3 | $39,877 | 2.4 | 0.9 | 0.3 | 0.1 | 0.4 | |
| 04428 / Eddington / ME / 10.5 mi. | 397 | 1,125 | 35.3 | $38,903 | 2.3 | 0.4 | 0.1 | 0.6 | 0.3 | |
| 04694 / Crawford / ME / 66.3 mi. | 396 | 1,075 | 36.8 | $31,535 | 1.9 | 0.5 | 0.1 | 0.3 | 0.1 | |
| 04742 / Fort Fairfield / ME / 132 mi. | 385 | 1,523 | 25.3 | $28,563 | 2.2 | 0.8 | 0.2 | 0.5 | 0.1 | |
| 04443 / Sebec Lake / ME / 37.4 mi. | 372 | 1,032 | 36.0 | $28,006 | 3.6 | 0.4 | 0.4 | 0.6 | 0.4 | |
| 04967 / Pittsfield / ME / 28.2 mi. | 370 | 1,635 | 22.6 | $33,015 | 4.3 | 0.6 | 0.9 | 0.4 | 1.2 | |
| 04430 / East Millinocket / ME / 52.1 mi. | 366 | 792 | 46.2 | $34,236 | 2.2 | 0.3 | 0.0 | 0.6 | 0.4 | |
| 04441 / Greenville / ME / 53.1 mi. | 356 | 651 | 54.7 | $30,806 | 1.6 | 0.1 | 0.1 | 0.2 | 0.3 | |
| 04974 / Searsport / ME / 24.3 mi. | 356 | 1,145 | 31.1 | $31,354 | 2.2 | 0.2 | 0.3 | 0.7 | 0.0 | |
| 04419 / Carmel / ME / 10.3 mi. | 348 | 1,364 | 25.5 | $40,159 | 1.9 | 0.4 | 0.1 | 0.3 | 0.4 | |
| 04427 / East Corinth / ME / 14 mi. | 339 | 959 | 35.3 | $37,318 | 2.1 | 0.8 | 0.1 | 0.6 | 0.1 | |
| 04631 / Eastport / ME / 82.1 mi. | 334 | 750 | 44.5 | $23,488 | 6.9 | 0.9 | 0.4 | 3.7 | 0.2 | |
| 04679 / Southwest Harbor / ME / 41.5 mi. | 327 | 987 | 33.1 | $35,889 | 1.7 | 0.6 | 0.3 | 0.1 | 0.1 | |
| 04448 / Seboeis Plt / ME / 26.9 mi. | 324 | 594 | 54.5 | $30,230 | 2.2 | 0.1 | 0.4 | 0.6 | 0.1 | |
| 04785 / Van Buren / ME / 154.8 mi. | 304 | 1,239 | 24.5 | $21,667 | 2.4 | 0.6 | 0.1 | 0.4 | 0.2 | |
| 04849 / Northport / ME / 36.4 mi. | 303 | 1,412 | 21.5 | $40,774 | 2.0 | 0.7 | 0.1 | 0.1 | 0.4 | |
| 04456 / Levant / ME / 7.5 mi. | 293 | 779 | 37.6 | $41,290 | 3.1 | 0.7 | 0.1 | 0.7 | 0.1 | |
| 04460 / Medway / ME / 52.4 mi. | 281 | 687 | 40.9 | $33,359 | 1.1 | 0.2 | 0.1 | 0.3 | 0.1 | |
| 04732 / Nashville Plt / ME / 116.8 mi. | 274 | 720 | 38.1 | $32,888 | 1.4 | 0.1 | 0.0 | 0.8 | 0.2 | |
| 04652 / Lubec / ME / 82 mi. | 264 | 904 | 29.2 | $20,740 | 2.5 | 0.7 | 0.3 | 0.1 | 0.2 | |
| 04330 / Togus / ME / 53.2 mi. | 250 | 10,791 | 2.3 | $32,619 | 3.9 | 0.8 | 0.4 | 0.5 | 1.1 | |
| 04750 / Limestone / ME / 140.7 mi. | 249 | 932 | 26.7 | $33,262 | 11.5 | 4.0 | 4.5 | 0.8 | 1.2 | |
| 04455 / Lee / ME / 41.3 mi. | 239 | 323 | 74.0 | $33,846 | 1.2 | 0.1 | 0.0 | 0.1 | 0.1 | |
| 04472 / Orland / ME / 19.3 mi. | 233 | 1,348 | 17.3 | $38,056 | 2.1 | 0.5 | 0.0 | 0.2 | 0.3 | |
| 04658 / Milbridge / ME / 45.7 mi. | 223 | 548 | 40.7 | $22,371 | 7.8 | 6.6 | 0.0 | 0.3 | 0.2 | |
| 04649 / Jonesport / ME / 56.8 mi. | 220 | 597 | 36.9 | $23,224 | 2.3 | 0.4 | 0.2 | 0.7 | 0.1 | |
| 04757 / Mapleton / ME / 120.5 mi. | 212 | 1,136 | 18.7 | $35,741 | 2.3 | 0.4 | 0.0 | 1.3 | 0.1 | |
| 04630 / East Machias / ME / 61.2 mi. | 210 | 673 | 31.2 | $29,000 | 1.2 | 0.0 | 0.0 | 0.3 | 0.1 | |
| 04421 / Castine / ME / 28.4 mi. | 209 | 372 | 56.2 | $46,250 | 3.2 | 0.6 | 0.6 | 0.6 | 0.7 | |
| 04634 / Franklin / ME / 29.3 mi. | 209 | 733 | 28.5 | $31,989 | 3.9 | 0.6 | 0.1 | 0.7 | 0.5 | |
| 04928 / Corinna / ME / 20.4 mi. | 209 | 842 | 24.8 | $32,115 | 2.1 | 0.5 | 0.4 | 0.1 | 0.1 | |
| 04765 / Patten / ME / 76.7 mi. | 205 | 609 | 33.7 | $26,908 | 1.1 | 0.0 | 0.2 | 0.2 | 0.0 | |
| 04981 / Stockton Springs / ME / 19.7 mi. | 205 | 881 | 23.3 | $36,953 | 3.1 | 0.6 | 0.2 | 0.4 | 0.2 | |
| 04747 / Island Falls / ME / 79.5 mi. | 204 | 534 | 38.2 | $30,260 | 1.2 | 0.6 | 0.0 | 0.5 | 0.2 | |
| 04786 / Washburn / ME / 129.1 mi. | 203 | 717 | 28.3 | $30,368 | 1.5 | 0.3 | 0.2 | 0.2 | 0.1 | |
| 04856 / Rockport / ME / 44.6 mi. | 202 | 1,379 | 14.6 | $47,026 | 1.9 | 0.7 | 0.2 | 0.0 | 0.5 | |
| 04411 / Bradley / ME / 9 mi. | 200 | 514 | 38.9 | $37,163 | 2.0 | 0.6 | 0.2 | 0.4 | 0.1 | |
| 04758 / Mars Hill / ME / 116.3 mi. | 199 | 938 | 21.2 | $25,660 | 2.6 | 0.4 | 0.2 | 1.3 | 0.1 | |
| 04414 / Williamsburg Twp / ME / 32.5 mi. | 194 | 658 | 29.5 | $27,917 | 2.4 | 0.7 | 0.0 | 0.9 | 0.1 | |
| 04450 / Kenduskeag / ME / 8.4 mi. | 193 | 470 | 41.1 | $34,632 | 3.2 | 0.3 | 0.3 | 0.5 | 0.0 | |
| 04681 / Stonington / ME / 42.2 mi. | 193 | 692 | 27.9 | $29,408 | 2.8 | 0.6 | 0.1 | 0.4 | 0.3 | |
| 04479 / Sangerville / ME / 30.5 mi. | 186 | 552 | 33.7 | $28,000 | 1.9 | 0.4 | 0.6 | 0.5 | 0.2 | |
| 04607 / South Gouldsboro / ME / 40.2 mi. | 184 | 787 | 23.4 | $33,682 | 2.5 | 0.9 | 0.3 | 0.6 | 0.3 | |
| 04901 / Winslow / ME / 42.6 mi. | 184 | 10,666 | 1.7 | $31,787 | 3.8 | 0.9 | 0.5 | 0.4 | 0.7 | |
| 04666 / Pembroke / ME / 74.7 mi. | 183 | 508 | 36.0 | $24,464 | 2.6 | 0.4 | 0.1 | 0.6 | 0.3 | |
| 04668 / Princeton / ME / 61.3 mi. | 182 | 648 | 28.1 | $27,438 | 37.6 | 0.8 | 0.1 | 34.4 | 0.0 | |
| 04622 / Deblois / ME / 42.3 mi. | 180 | 531 | 33.9 | $21,689 | 2.0 | 0.1 | 0.1 | 0.7 | 0.4 | |
| 04976 / Skowhegan / ME / 42.6 mi. | 178 | 4,175 | 4.3 | $29,140 | 2.8 | 0.7 | 0.2 | 0.4 | 0.5 | |
| 04861 / Thomaston / ME / 51.7 mi. | 174 | 1,431 | 12.2 | $33,347 | 2.4 | 0.4 | 0.6 | 0.2 | 0.5 | |
| 04617 / Brooksville / ME / 29.8 mi. | 171 | 364 | 47.0 | $36,302 | 1.4 | 0.4 | 0.0 | 0.0 | 0.3 | |
| 04627 / Deer Isle / ME / 39.1 mi. | 168 | 478 | 35.1 | $33,750 | 2.2 | 0.4 | 0.3 | 0.2 | 0.4 | |
| 04763 / Oakfield / ME / 87.8 mi. | 166 | 412 | 40.3 | $25,313 | 1.6 | 0.6 | 0.0 | 0.9 | 0.1 | |
| 04862 / Union / ME / 42.8 mi. | 166 | 1,348 | 12.3 | $37,271 | 1.7 | 0.4 | 0.1 | 0.1 | 0.1 | |
| 04623 / Columbia Falls / ME / 47.1 mi. | 164 | 456 | 36.0 | $28,313 | 1.8 | 0.4 | 0.0 | 0.6 | 0.2 | |
| 04643 / Harrington / ME / 47.1 mi. | 161 | 366 | 44.0 | $26,776 | 3.0 | 1.7 | 0.0 | 0.1 | 0.0 | |
| 04424 / Danforth / ME / 67.8 mi. | 154 | 352 | 43.8 | $20,688 | 0.6 | 0.0 | 0.1 | 0.2 | 0.1 | |
| 04684 / Surry / ME / 24.9 mi. | 154 | 551 | 27.9 | $36,932 | 3.5 | 0.4 | 0.2 | 0.6 | 0.4 | |
| 04640 / Hancock / ME / 32.8 mi. | 152 | 909 | 16.7 | $33,021 | 3.0 | 0.5 | 0.3 | 0.3 | 0.5 | |
| 04422 / Charleston / ME / 20.4 mi. | 147 | 431 | 34.1 | $36,118 | 1.9 | 0.2 | 0.7 | 0.3 | 0.2 | |
| 04774 / Saint Francis / ME / 146.8 mi. | 147 | 376 | 39.1 | $21,384 | 0.4 | 0.0 | 0.1 | 0.0 | 0.0 | |
| 04476 / Penobscot / ME / 23.7 mi. | 145 | 312 | 46.5 | $39,779 | 2.2 | 0.5 | 0.1 | 0.5 | 0.4 | |
| 04776 / Sherman Mills / ME / 66.9 mi. | 145 | 367 | 39.5 | $27,375 | 1.8 | 0.2 | 0.1 | 0.8 | 0.0 | |
| 04772 / Saint Agatha / ME / 156 mi. | 140 | 385 | 36.4 | $30,875 | 0.7 | 0.2 | 0.0 | 0.1 | 0.1 | |
| 04449 / Hudson / ME / 9.9 mi. | 137 | 496 | 27.6 | $38,125 | 2.3 | 0.2 | 0.4 | 0.7 | 0.2 | |
| 04932 / Dixmont / ME / 16.6 mi. | 137 | 414 | 33.1 | $33,365 | 1.6 | 0.2 | 0.0 | 0.4 | 0.5 | |
| 04606 / Addison / ME / 52.2 mi. | 135 | 489 | 27.6 | $26,083 | 1.9 | 0.2 | 0.5 | 0.3 | 0.3 | |
| 04667 / Perry / ME / 77.3 mi. | 130 | 566 | 23.0 | $25,043 | 46.9 | 0.5 | 0.1 | 44.5 | 0.1 | |
| 04435 / Exeter / ME / 17 mi. | 128 | 388 | 33.0 | $33,750 | 1.1 | 0.1 | 0.0 | 0.8 | 0.0 | |
| 04971 / Saint Albans / ME / 38.4 mi. | 126 | 718 | 17.5 | $28,306 | 1.6 | 0.4 | 0.2 | 0.2 | 0.5 | |
| 04740 / Easton / ME / 123.5 mi. | 123 | 524 | 23.5 | $29,922 | 3.2 | 0.6 | 0.3 | 1.6 | 0.3 | |
| 04616 / Brooklin / ME / 39.2 mi. | 122 | 371 | 32.9 | $36,786 | 2.4 | 1.0 | 0.1 | 0.1 | 0.6 | |
| 04739 / Eagle Lake / ME / 142.4 mi. | 117 | 414 | 28.3 | $23,250 | 1.8 | 0.3 | 0.0 | 0.2 | 0.6 | |
| 04664 / Sullivan / ME / 33.7 mi. | 116 | 179 | 64.8 | $32,344 | 2.1 | 0.2 | 0.0 | 0.2 | 1.4 | |
| 04680 / Steuben / ME / 44.3 mi. | 116 | 459 | 25.3 | $25,208 | 3.2 | 0.5 | 0.3 | 1.0 | 0.4 | |
| 04410 / Bradford / ME / 17.3 mi. | 114 | 426 | 26.8 | $34,750 | 2.7 | 1.0 | 0.3 | 0.3 | 0.0 | |
| 04431 / East Orland / ME / 16.9 mi. | 114 | 65 | 175.4 | $40,625 | 1.5 | 0.7 | 0.0 | 0.0 | 0.0 | |
| 04442 / Greenville Junction / ME / 58.4 mi. | 114 | 211 | 54.0 | $29,250 | 1.7 | 0.4 | 0.2 | 0.4 | 0.0 | |
| 04937 / Fairfield / ME / 41.4 mi. | 112 | 2,570 | 4.4 | $36,568 | 2.3 | 0.3 | 0.3 | 0.3 | 0.3 | |
| 04464 / Monson / ME / 43.7 mi. | 111 | 304 | 36.5 | $26,429 | 1.9 | 0.4 | 0.0 | 0.3 | 0.0 | |
| 04438 / Frankfort / ME / 16.5 mi. | 110 | 421 | 26.1 | $33,750 | 2.3 | 0.3 | 0.1 | 1.1 | 0.3 | |
| 04745 / Upper Frenchville / ME / 120.9 mi. | 110 | 478 | 23.0 | $33,214 | 1.0 | 0.4 | 0.1 | 0.2 | 0.2 | |
| 04943 / Hartland / ME / 30.6 mi. | 109 | 703 | 15.5 | $29,451 | 2.2 | 0.5 | 0.2 | 0.7 | 0.1 | |
| 04693 / Winter Harbor / ME / 44.3 mi. | 107 | 402 | 26.6 | $28,571 | 13.0 | 3.6 | 1.9 | 0.2 | 0.7 | |
| 04676 / Sedgwick / ME / 32.3 mi. | 105 | 403 | 26.1 | $33,942 | 4.5 | 1.1 | 0.2 | 0.7 | 0.3 | |
| 04459 / Mattawamkeag / ME / 50.8 mi. | 104 | 338 | 30.8 | $23,403 | 2.1 | 0.1 | 0.0 | 0.4 | 0.0 | |
| 04648 / Jonesboro / ME / 56 mi. | 104 | 257 | 40.5 | $27,639 | 1.2 | 0.5 | 0.2 | 0.0 | 0.0 | |
| 04921 / Jackson / ME / 24.8 mi. | 103 | 614 | 16.8 | $28,182 | 2.4 | 0.7 | 0.1 | 0.5 | 0.1 | |
| 04969 / Plymouth / ME / 20.6 mi. | 103 | 467 | 22.1 | $32,857 | 2.2 | 0.6 | 0.0 | 0.3 | 0.1 | |
| 04423 / Costigan / ME / 18 mi. | 102 | 125 | 81.6 | $40,125 | 1.9 | 0.6 | 0.0 | 0.6 | 0.0 | |
| 04660 / Otter Creek / ME / 38.6 mi. | 102 | 572 | 17.8 | $45,729 | 1.8 | 0.4 | 0.2 | 0.2 | 0.1 | |
| 04488 / Stetson / ME / 14 mi. | 100 | 383 | 26.1 | $30,606 | 1.3 | 0.0 | 0.2 | 0.5 | 0.0 | |
| 04572 / Waldoboro / ME / 61.5 mi. | 98 | 1,983 | 4.9 | $34,830 | 1.6 | 0.3 | 0.2 | 0.1 | 0.5 | |
| 04939 / Garland / ME / 21.5 mi. | 97 | 380 | 25.5 | $27,422 | 2.5 | 0.4 | 0.2 | 0.5 | 0.5 | |
| 04965 / Palmyra / ME / 26.8 mi. | 96 | 768 | 12.5 | $31,287 | 1.6 | 0.3 | 0.0 | 0.3 | 0.4 | |
| 04864 / Warren / ME / 50.5 mi. | 94 | 1,351 | 7.0 | $35,651 | 2.9 | 0.7 | 0.2 | 0.8 | 0.4 | |
| 04854 / Owls Head / ME / 50.4 mi. | 93 | 697 | 13.3 | $40,429 | 1.4 | 0.3 | 0.0 | 0.1 | 0.2 | |
| 04945 / Moose River / ME / 86.2 mi. | 93 | 443 | 21.0 | $30,457 | 3.5 | 1.9 | 0.1 | 0.6 | 0.1 | |
| 04406 / Blanchard Township / ME / 46.4 mi. | 91 | 302 | 30.1 | $32,250 | 1.8 | 0.0 | 0.2 | 0.6 | 0.2 | |
| 04434 / Etna / ME / 16.2 mi. | 90 | 392 | 23.0 | $33,681 | 1.0 | 0.1 | 0.2 | 0.2 | 0.3 | |
| 04671 / Robbinston / ME / 75.3 mi. | 86 | 193 | 44.6 | $32,279 | 4.5 | 0.6 | 0.0 | 1.4 | 0.0 | |
| 04628 / Dennysville / ME / 69.1 mi. | 84 | 274 | 30.7 | $24,044 | 2.7 | 0.6 | 0.2 | 1.1 | 0.0 | |
| 04783 / Westmanland / ME / 145.3 mi. | 84 | 286 | 29.4 | $30,833 | 3.2 | 1.5 | 0.0 | 1.2 | 0.0 | |
| 04662 / Northeast Harbor / ME / 41.8 mi. | 81 | 269 | 30.1 | $37,885 | 0.2 | 0.2 | 0.0 | 0.0 | 0.0 | |
| 04973 / Searsmont / ME / 27.2 mi. | 80 | 472 | 16.9 | $36,875 | 2.2 | 0.7 | 0.0 | 0.8 | 0.1 | |
| 04487 / Webster Plt / ME / 47.7 mi. | 78 | 361 | 21.6 | $22,375 | 4.4 | 0.8 | 0.8 | 0.7 | 0.1 | |
| 04760 / Monticello / ME / 104.2 mi. | 78 | 330 | 23.6 | $23,419 | 7.4 | 1.0 | 0.0 | 4.3 | 0.5 | |
| 04773 / Saint David / ME / 162.2 mi. | 76 | 309 | 24.6 | $27,500 | 2.5 | 0.1 | 0.3 | 0.1 | 1.1 | |
| 04626 / Cutler / ME / 72.5 mi. | 75 | 231 | 32.5 | $30,809 | 5.5 | 2.2 | 1.7 | 0.7 | 0.5 | |
| 04653 / Bass Harbor / ME / 46.4 mi. | 75 | 242 | 31.0 | $35,625 | 3.2 | 0.4 | 0.2 | 0.8 | 0.4 | |
| 04762 / New Sweden / ME / 140.8 mi. | 75 | 217 | 34.6 | $31,000 | 3.6 | 0.8 | 0.2 | 0.9 | 0.6 | |
| 04949 / Liberty / ME / 39.4 mi. | 75 | 413 | 18.2 | $32,788 | 1.8 | 0.6 | 0.1 | 0.1 | 0.1 | |
| 04453 / Maxfield / ME / 24.3 mi. | 74 | 377 | 19.6 | $31,667 | 2.5 | 0.3 | 0.1 | 0.4 | 0.5 | |
| 04986 / Thorndike / ME / 26.5 mi. | 74 | 562 | 13.2 | $28,958 | 1.0 | 0.3 | 0.1 | 0.0 | 0.1 | |
| 04988 / Unity / ME / 29.1 mi. | 73 | 692 | 10.5 | $26,420 | 2.9 | 0.8 | 0.3 | 0.4 | 0.3 | |
| 04475 / Passadumkeag / ME / 24.3 mi. | 71 | 168 | 42.3 | $35,500 | 2.1 | 0.5 | 0.0 | 0.5 | 0.2 | |
| 04495 / Winn / ME / 45.1 mi. | 71 | 124 | 57.3 | $28,333 | 1.6 | 0.6 | 0.0 | 0.3 | 0.0 | |
| 04848 / Islesboro / ME / 34.6 mi. | 71 | 280 | 25.4 | $39,643 | 2.0 | 1.3 | 0.2 | 0.0 | 0.2 | |
| 04777 / Sherman Station / ME / 69.9 mi. | 70 | 215 | 32.6 | $23,889 | 4.8 | 1.3 | 0.4 | 0.7 | 0.2 | |
| 04951 / Monroe / ME / 19.5 mi. | 69 | 355 | 19.4 | $32,250 | 1.6 | 0.6 | 0.1 | 0.0 | 0.1 | |
| 04938 / Industry / ME / 63.1 mi. | 65 | 3,536 | 1.8 | $27,981 | 2.8 | 0.8 | 0.2 | 0.2 | 0.7 | |
| 04478 / Rockwood / ME / 66.7 mi. | 64 | 140 | 45.7 | $22,083 | 3.3 | 0.3 | 0.0 | 3.0 | 0.0 | |
| 04493 / West Enfield / ME / 29.8 mi. | 64 | 295 | 21.7 | $37,250 | 0.9 | 0.1 | 0.0 | 0.0 | 0.3 | |
| 04860 / Tenants Harbor / ME / 59.2 mi. | 64 | 610 | 10.5 | $38,942 | 1.1 | 0.1 | 0.1 | 0.1 | 0.4 | |
| 04858 / South Thomaston / ME / 53.6 mi. | 63 | 594 | 10.6 | $43,594 | 2.2 | 0.3 | 0.4 | 0.1 | 0.4 | |
| 04781 / Wallagrass / ME / 149.3 mi. | 62 | 215 | 28.8 | $29,643 | 0.7 | 0.5 | 0.0 | 0.0 | 0.0 | |
| 04735 / Bridgewater / ME / 110.5 mi. | 60 | 255 | 23.5 | $27,500 | 2.1 | 0.6 | 0.0 | 0.5 | 0.0 | |
| 04011 / NAS Brunswick / ME / 80.8 mi. | 59 | 8,150 | 0.7 | $40,402 | 6.5 | 1.6 | 1.6 | 0.2 | 1.7 | |
| 04490 / Topsfield / ME / 62.8 mi. | 59 | 103 | 57.3 | $26,771 | 1.6 | 0.0 | 0.0 | 1.6 | 0.0 | |
| 04863 / Vinalhaven / ME / 50.6 mi. | 58 | 550 | 10.5 | $34,087 | 1.9 | 0.0 | 0.0 | 0.3 | 0.3 | |
| 04779 / Sinclair / ME / 152.1 mi. | 55 | 73 | 75.3 | $23,125 | 0.6 | 0.0 | 0.0 | 0.0 | 0.0 | |
| 04780 / Smyrna Mills / ME / 89.1 mi. | 55 | 199 | 27.6 | $27,273 | 3.8 | 0.6 | 0.0 | 1.3 | 0.0 | |
| 04674 / Seal Cove / ME / 38.6 mi. | 54 | 199 | 27.1 | $36,806 | 2.3 | 0.2 | 0.8 | 0.6 | 0.2 | |
| 04942 / Wellington / ME / 40.8 mi. | 54 | 407 | 13.3 | $24,074 | 2.3 | 0.0 | 0.0 | 0.9 | 0.4 | |
| 04655 / Machiasport / ME / 64.1 mi. | 53 | 342 | 15.5 | $29,034 | 2.8 | 0.3 | 0.1 | 0.8 | 0.3 | |
| 04101 / Portland / ME / 101.6 mi. | 52 | 8,990 | 0.6 | $26,689 | 14.0 | 2.8 | 4.5 | 0.7 | 3.5 | |
| 04746 / Lille / ME / 161.2 mi. | 52 | 229 | 22.7 | $27,083 | 1.5 | 0.4 | 0.0 | 0.4 | 0.2 | |
| 04691 / Whiting / ME / 73.8 mi. | 51 | 141 | 36.2 | $27,083 | 2.7 | 0.3 | 0.0 | 0.9 | 0.3 | |
| 04675 / Seal Harbor / ME / 42.4 mi. | 50 | 134 | 37.3 | $42,500 | 4.9 | 2.3 | 0.3 | 0.0 | 1.3 | |
| 04611 / Beals / ME / 59.3 mi. | 49 | 237 | 20.7 | $29,375 | 3.6 | 2.1 | 0.5 | 0.5 | 0.2 | |
| 04987 / Troy / ME / 23.6 mi. | 49 | 362 | 13.5 | $30,104 | 2.7 | 0.1 | 0.0 | 0.8 | 0.3 | |
| 04106 / South Portland / ME / 104.5 mi. | 48 | 10,127 | 0.5 | $42,646 | 4.8 | 1.1 | 0.6 | 0.3 | 1.6 | |
| 04408 / Great Pond / ME / 21.4 mi. | 47 | 75 | 62.7 | $28,125 | 5.1 | 0.0 | 0.6 | 0.0 | 0.6 | |
| 04929 / Detroit / ME / 24.4 mi. | 47 | 321 | 14.6 | $29,938 | 1.6 | 0.8 | 0.1 | 0.1 | 0.0 | |
| 04847 / Hope / ME / 40.5 mi. | 46 | 513 | 9.0 | $42,273 | 2.1 | 0.8 | 0.1 | 0.3 | 0.2 | |
| 04683 / Sunset / ME / 39.7 mi. | 45 | 3 | 1500.0 | $24,583 | 0.0 | 0.0 | 0.0 | 0.0 | 0.0 | |
| 04923 / Cambridge / ME / 32.4 mi. | 44 | 194 | 22.7 | $28,516 | 0.8 | 0.2 | 0.4 | 0.0 | 0.0 | |
| 04950 / Madison / ME / 49.9 mi. | 44 | 1,888 | 2.3 | $30,694 | 2.1 | 0.2 | 0.1 | 0.3 | 0.2 | |
| 04345 / West Gardiner / ME / 59.8 mi. | 43 | 4,663 | 0.9 | $38,968 | 3.0 | 0.7 | 0.4 | 0.6 | 0.3 | |
| 04624 / Corea / ME / 45.3 mi. | 42 | 119 | 35.3 | $33,125 | 11.2 | 3.9 | 2.7 | 1.2 | 0.9 | |
| 04543 / Damariscotta / ME / 60.9 mi. | 40 | 952 | 4.2 | $36,438 | 1.5 | 0.5 | 0.2 | 0.2 | 0.2 | |
| 04963 / Rome / ME / 46.6 mi. | 40 | 2,740 | 1.5 | $35,801 | 2.0 | 0.5 | 0.1 | 0.2 | 0.5 | |
| 04417 / Burlington / ME / 27.4 mi. | 39 | 119 | 32.8 | $26,250 | 0.7 | 0.7 | 0.0 | 0.0 | 0.0 | |
| 04677 / Sorrento / ME / 35.5 mi. | 38 | 128 | 29.7 | $42,125 | 4.1 | 0.7 | 0.0 | 2.1 | 0.0 | |
| 04413 / Brookton / ME / 68 mi. | 37 | 73 | 50.7 | $29,444 | 1.8 | 0.6 | 0.0 | 1.2 | 0.0 | |
| 04759 / Masardis / ME / 116.7 mi. | 37 | 63 | 58.7 | $30,417 | 0.7 | 0.7 | 0.0 | 0.0 | 0.0 | |
| 04920 / Pleasant Ridge Plt / ME / 52.3 mi. | 37 | 754 | 4.9 | $27,004 | 1.1 | 0.3 | 0.0 | 0.3 | 0.1 | |
| 04650 / Little Deer Isle / ME / 35.2 mi. | 36 | 110 | 32.7 | $32,813 | 2.4 | 1.2 | 0.0 | 0.0 | 0.0 | |
| 04563 / Cushing / ME / 58.6 mi. | 35 | 541 | 6.5 | $40,598 | 1.0 | 0.5 | 0.0 | 0.0 | 0.1 | |
| 04578 / Wiscasset / ME / 67.6 mi. | 35 | 1,790 | 2.0 | $37,934 | 2.2 | 0.6 | 0.3 | 0.3 | 0.4 | |
| 04859 / Tenants Harbor / ME / 55.6 mi. | 35 | 248 | 14.1 | $46,094 | 1.9 | 0.3 | 0.3 | 0.2 | 0.7 | |
| 04947 / Kingfield / ME / 71.4 mi. | 35 | 784 | 4.5 | $32,850 | 1.7 | 0.3 | 0.0 | 0.2 | 0.2 | |
| 04857 / Wileys Corner / ME / 56.9 mi. | 33 | 261 | 12.6 | $41,563 | 2.2 | 0.5 | 0.2 | 0.6 | 0.0 | |
| 04471 / Orient / ME / 80.4 mi. | 31 | 231 | 13.4 | $27,083 | 2.5 | 0.7 | 0.4 | 0.7 | 0.5 | |
| 04957 / Norridgewock / ME / 49.9 mi. | 31 | 1,538 | 2.0 | $36,051 | 2.1 | 0.4 | 0.3 | 0.4 | 0.3 | |
| 04685 / Swans Island / ME / 46.4 mi. | 30 | 142 | 21.1 | $28,438 | 1.8 | 0.0 | 0.3 | 0.0 | 0.0 | |
| 04952 / Morrill / ME / 31.9 mi. | 30 | 660 | 4.5 | $31,791 | 1.7 | 0.2 | 0.0 | 0.3 | 0.2 | |
| 04657 / Meddybemps / ME / 65.1 mi. | 29 | 141 | 20.6 | $35,750 | 1.5 | 0.0 | 0.6 | 0.0 | 0.3 | |
| 04766 / Perham / ME / 132.3 mi. | 29 | 162 | 17.9 | $25,962 | 3.9 | 0.0 | 0.0 | 0.9 | 0.0 | |
| 04922 / Burnham / ME / 27.1 mi. | 29 | 446 | 6.5 | $31,429 | 3.3 | 0.4 | 0.2 | 0.4 | 0.1 | |
| 04927 / Clinton / ME / 36.3 mi. | 29 | 1,277 | 2.3 | $32,379 | 2.6 | 1.0 | 0.1 | 0.2 | 0.1 | |
| 04970 / Rangeley / ME / 86 mi. | 28 | 586 | 4.8 | $34,609 | 1.1 | 0.1 | 0.1 | 0.4 | 0.1 | |
| 04096 / Yarmouth / ME / 92.7 mi. | 27 | 3,509 | 0.8 | $58,636 | 2.0 | 0.6 | 0.4 | 0.0 | 0.4 | |
| 04733 / Benedicta / ME / 65 mi. | 27 | 84 | 32.1 | $41,250 | 0.0 | 0.0 | 0.0 | 0.0 | 0.0 | |
| 04768 / Portage Lake / ME / 126.6 mi. | 27 | 183 | 14.8 | $32,232 | 0.3 | 0.3 | 0.0 | 0.0 | 0.0 | |
| 04364 / Winthrop / ME / 64 mi. | 26 | 2,495 | 1.0 | $41,733 | 2.0 | 0.5 | 0.3 | 0.3 | 0.4 | |
| 04497 / Wytopitlock / ME / 63.9 mi. | 26 | 143 | 18.2 | $21,339 | 2.3 | 0.0 | 0.3 | 0.0 | 1.0 | |
| 04032 / Freeport / ME / 87.5 mi. | 25 | 3,076 | 0.8 | $52,034 | 3.2 | 0.7 | 0.4 | 0.2 | 1.1 | |
| 04105 / Portland / ME / 98.4 mi. | 25 | 3,940 | 0.6 | $66,855 | 2.6 | 0.5 | 0.2 | 0.1 | 1.1 | |
| 04538 / Capitol Island / ME / 74.2 mi. | 25 | 1,205 | 2.1 | $36,094 | 2.6 | 0.9 | 0.2 | 0.3 | 0.7 | |
| 04574 / Washington / ME / 45.4 mi. | 25 | 509 | 4.9 | $35,682 | 1.4 | 0.4 | 0.0 | 0.1 | 0.0 | |
| 04853 / North Haven / ME / 43.8 mi. | 25 | 162 | 15.4 | $40,446 | 4.7 | 2.4 | 0.8 | 0.0 | 0.0 | |
| 04941 / Montville / ME / 33.7 mi. | 24 | 594 | 4.0 | $33,400 | 3.5 | 1.5 | 0.2 | 0.1 | 0.1 | |
| 04064 / Old Orchard Beach / ME / 112.5 mi. | 23 | 4,261 | 0.5 | $36,515 | 3.1 | 1.0 | 0.6 | 0.2 | 0.5 | |
| 04451 / Kingman Township / ME / 55.9 mi. | 23 | 98 | 23.5 | $19,167 | 0.0 | 0.0 | 0.0 | 0.0 | 0.0 | |
| 04530 / West Bath / ME / 76.2 mi. | 23 | 5,005 | 0.5 | $38,679 | 5.1 | 1.5 | 1.3 | 0.5 | 0.5 | |
| 04613 / Birch Harbor / ME / 44.6 mi. | 23 | 151 | 15.2 | $35,313 | 4.0 | 2.1 | 0.0 | 0.0 | 0.8 | |
| 04669 / Prospect Harbor / ME / 43.5 mi. | 23 | 60 | 38.3 | $46,250 | 4.7 | 0.0 | 0.0 | 1.6 | 0.0 | |
| 04672 / Salsbury Cove / ME / 34.7 mi. | 23 | 16 | 143.8 | $53,750 | 0.0 | 0.0 | 0.0 | 0.0 | 0.0 | |
| 04924 / Canaan / ME / 35.4 mi. | 23 | 776 | 3.0 | $29,310 | 2.3 | 0.3 | 0.1 | 0.6 | 0.2 | |
| File | me_bangor_daily_news | |||||||||
| Time | 5/20/05 6:39 PM | |||||||||
| Page | 166 | |||||||||
| Member | 118550 | |||||||||