
|
| Comparing the racial diversity of the journalists | ||||||||||
| at America's daily newspapers | ||||||||||
| with the communities that they serve | ||||||||||
| Newsroom diversity report for | ||||||||||
| The Berkshire Eagle, Pittsfield | ||||||||||
| Pittsfield, Massachusetts | ||||||||||
| Owner: MediaNews Group (Colo.) | ||||||||||
| From a report for the Knight Foundation | ||||||||||
| by Bill Dedman and Stephen K. Doig, June 2005 | ||||||||||
| Click here to read the national report or to select another newspaper | ||||||||||
| Year | Non-white % of newsroom staff | |||||||||
| 2005 | Did not report | |||||||||
| 2004 | 0.0 | |||||||||
| 2003 | 0.0 | |||||||||
| 2002 | 0.0 | |||||||||
| 2001 | 0.0 | |||||||||
| 2000 | 0.0 | |||||||||
| 1999 | 0.0 | |||||||||
| 1998 | Did not report | |||||||||
| 1997 | Did not report | |||||||||
| 1996 | Did not report | |||||||||
| 1995 | 0.0 | |||||||||
| 1994 | 0.0 | |||||||||
| 1993 | Did not report | |||||||||
| 1992 | 0.0 | |||||||||
| 1991 | Did not report | |||||||||
| 1990 | Did not report | |||||||||
| The latest year at peak is | 2004 | |||||||||
| See the notes and definitions section below for the sources of these figures. | ||||||||||
| Newsroom Diversity Index | ||||||||||
| for The Berkshire Eagle, Pittsfield | ||||||||||
| Year | Non-white % of newsroom staff | Non-white % of circulation area | Newsroom Diversity Index (parity=100) | |||||||
| 2005 | N/A | 5.8 | N/A | |||||||
| 2004 | 0.0 | 6.0 | 0 | |||||||
| How the index is calculated | ||||||||||
| The Newsroom Diversity Index is the non-white percentage of the newsroom staff | ||||||||||
| divided by the non-white percentage of residents in the circulation area. | ||||||||||
| (Parity = 100.) | ||||||||||
| Company index | ||||||||||
| This newspaper's owner, MediaNews Group (Colo.), | ||||||||||
| has a companywide, circulation-weighted Diversity Index of 47. | ||||||||||
| See the notes and definitions section below for the sources of these figures. | ||||||||||
| Peer group comparison | ||||||||||
| for The Berkshire Eagle, Pittsfield | ||||||||||
| This paper | ||||||||||
| Peer group | ||||||||||
| The median Diversity Index is 44 for all newspapers | ||||||||||
| reporting in this circulation category of 25,001 to 50,000 daily sales. | ||||||||||
| An example of a newspaper of similar circulation, in an area of similar level of non-white residents, but one that has a relatively high Diversity Index, is Herald & Review, Decatur, Illinois, with a 11.1 percent non-white staff in a community that is 11 percent non-white. Its index is 101. | ||||||||||
| FYI, in circulation, this newspaper's average weekday circulation of | ||||||||||
| approximately 30,009 ranks 341 out of 1,410 daily newspapers in the US. | ||||||||||
| See the notes and definitions section below for the sources of these figures. | ||||||||||
| Details on race/ethnicity | ||||||||||
| in the circulation area | ||||||||||
| and the home county | ||||||||||
| of The Berkshire Eagle, Pittsfield | ||||||||||
| Circulation area | ||||||||||
| Race/ethnicity | % of population | Number of residents | 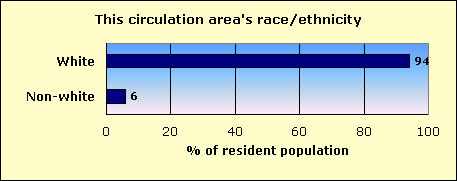
|
|||||||
| Hispanic | 1.7 | 2,402 | ||||||||
| Black | 1.9 | 2,745 | ||||||||
| Asian and Pacific Islander | 1.0 | 1,401 | ||||||||
| Native-American | 0.1 | 191 | ||||||||
| Other non-white | 0.1 | 173 | ||||||||
| Multi-racial | 1.1 | 1,510 | ||||||||
| Non-white | 6.0 | 8,422 | ||||||||
| White | 94.0 | 132,993 | ||||||||
| Total | 141,415 | |||||||||
| Home county: Berkshire | ||||||||||
| Race/ethnicity | % of population | Number of residents | 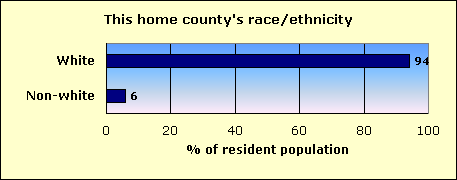
|
|||||||
| Hispanic | 1.7 | 2,286 | ||||||||
| Black | 1.9 | 2,570 | ||||||||
| Asian and Pacific Islander | 1.0 | 1,352 | ||||||||
| Native-American | 0.1 | 177 | ||||||||
| Other non-white | 0.1 | 161 | ||||||||
| Multi-racial | 1.1 | 1,446 | ||||||||
| Non-white | 5.9 | 7,992 | ||||||||
| White | 94.1 | 126,961 | ||||||||
| Total | 134,953 | |||||||||
| The home county of this newspaper is Berkshire. | ||||||||||
| About this report | ||||||||||
| This third annual report for the Knight Foundation adds context to an annual survey by the American Society of Newspaper Editors. ASNE has set a goal that | ||||||||||
| every newspaper, to help it know its community and gather the news, should employ at least one non-white journalist, and that newspapers should strive to | ||||||||||
| employ non-whites in proportion to their share of the community. ASNE's report, at www.asne.org, shows each newspaper's non-white employment, but does | ||||||||||
| not disclose how closely that employment mirrors the newspaper's circulation area. | ||||||||||
| That gap is filled by the report you are reading now. This report was not done by ASNE, but was done for the Knight Foundation by Bill Dedman and | ||||||||||
| Stephen K. Doig. It shows how close each newspaper is to ASNE's goal, by comparing the newsroom staffing with the circulation area population. | ||||||||||
| The full report is at www.powerreporting.com/knight. | ||||||||||
| Notes and definitions | ||||||||||
| 1. The Newsroom Diversity Index is the non-white percentage of the newsroom staff divided by the non-white percentage of the circulation area's residents. Parity = 100. | ||||||||||
| 2. Source for staffing: Survey by American Society of Newspaper Editors, April 2005. Newspapers report non-white staff as of the end of the previous year. | ||||||||||
| 3. Following ASNE's definition, newsroom staff includes only supervisors, reporters, editors, copy/layout editors and photographers. | ||||||||||
| 4. Also following ASNE's definition, "whites," "blacks," etc., exclude Hispanics, who are counted in a separate category. | ||||||||||
| 5. Source for boundaries of this newspaper's circulation area: ZIP Code circulation data, Audit Bureau of Circulations, latest available. | ||||||||||
| 6. A paper may define its circulation area differently for marketing efforts, or news coverage, or to set advertising rates. | ||||||||||
| 7. If ZIP Codes or counties are used, this report applies a threshold: 10 percent household penetration is required to include an area in the circulation area. | ||||||||||
| 8. Source for the demographics of residents of that circulation area: US Census 2000. | ||||||||||
| 9. Source for total circulation: Editor & Publisher magazine, Monday-Friday average at year-end 2004. | ||||||||||
| 10. Staff of non-English publications, such as the Miami Herald's El Nuevo Herald, are excluded from the ASNE staffing survey for the first time this year. | ||||||||||
| Demographics of ZIP Codes | ||||||||||
| where sales were reported by | ||||||||||
| The Berkshire Eagle, Pittsfield | ||||||||||
| Note that some ZIP Codes listed here may not have been included in determining the newspaper's circulation area. In calculating the Diversity Index, a | ||||||||||
| ZIP Code was included only if the household penetration was at least 10 percent. Any lower-penetration ZIP Codes are also listed here for your information. | ||||||||||
| Also, if the newspaper reported more than 300 ZIP Codes, only the top 300 in weekday sales are listed here. | ||||||||||
| ZIP / City / State / Approx. distance in miles from the newspaper's home office | Weekday sales | Households | Penetration % (daily sales per 100 households) | Median household income | Non-white % of population |
Hispanic % of population |
Black % of population |
Native % of population |
Asian % of population |
|
| 01201 / Richmond / MA / 3.5 mi. | 12,634 | 20,433 | 61.8 | $36,448 | 8.2 | 2.0 | 3.4 | 0.1 | 1.2 | |
| 01226 / Dalton / MA / 7.7 mi. | 1,501 | 3,068 | 48.9 | $49,238 | 2.5 | 0.9 | 0.4 | 0.1 | 0.6 | |
| 01238 / West Becket / MA / 10.1 mi. | 1,481 | 2,608 | 56.8 | $42,538 | 4.8 | 2.4 | 0.6 | 0.1 | 1.1 | |
| 01240 / Lenox / MA / 6.4 mi. | 1,422 | 2,242 | 63.4 | $43,700 | 5.1 | 1.9 | 1.3 | 0.1 | 1.1 | |
| 01230 / Van Deusenville / MA / 16.4 mi. | 1,341 | 3,725 | 36.0 | $45,630 | 6.0 | 1.8 | 2.0 | 0.1 | 1.1 | |
| 01247 / North Adams / MA / 18.3 mi. | 1,263 | 7,235 | 17.5 | $29,288 | 5.3 | 1.8 | 1.4 | 0.2 | 0.7 | |
| 01220 / Adams / MA / 14.3 mi. | 1,166 | 4,245 | 27.5 | $33,102 | 2.4 | 0.8 | 0.4 | 0.1 | 0.2 | |
| 01267 / Wmstown / MA / 16.6 mi. | 966 | 2,883 | 33.5 | $51,503 | 10.5 | 2.7 | 2.6 | 0.1 | 3.1 | |
| 01237 / New Ashford / MA / 5.3 mi. | 677 | 981 | 69.0 | $45,951 | 3.7 | 0.9 | 0.7 | 0.0 | 1.0 | |
| 01225 / Cheshire / MA / 10.2 mi. | 583 | 1,114 | 52.3 | $40,399 | 2.5 | 0.5 | 0.4 | 0.1 | 0.7 | |
| 01235 / Peru / MA / 10.4 mi. | 432 | 982 | 44.0 | $42,467 | 2.4 | 0.3 | 0.4 | 0.0 | 0.4 | |
| 01236 / Housatonic / MA / 13.4 mi. | 392 | 870 | 45.1 | $48,281 | 3.2 | 1.8 | 0.6 | 0.0 | 0.4 | |
| 01262 / Stockbridge / MA / 9.8 mi. | 392 | 395 | 99.2 | $37,917 | 7.5 | 4.3 | 2.0 | 0.1 | 0.6 | |
| 01223 / Washington / MA / 9.8 mi. | 374 | 667 | 56.1 | $48,750 | 2.7 | 0.9 | 0.7 | 0.2 | 0.3 | |
| 01257 / Sheffield / MA / 24.8 mi. | 299 | 982 | 30.4 | $45,586 | 3.5 | 1.3 | 1.1 | 0.4 | 0.4 | |
| 01266 / West Stockbridge Center / MA / 8.3 mi. | 297 | 726 | 40.9 | $51,818 | 2.4 | 1.0 | 0.4 | 0.1 | 0.5 | |
| 05201 / Woodford / VT / 28 mi. | 277 | 6,313 | 4.4 | $34,417 | 3.5 | 1.0 | 0.6 | 0.3 | 0.8 | |
| 01254 / Richmond / MA / 3.8 mi. | 258 | 421 | 61.3 | $58,125 | 3.3 | 0.5 | 1.4 | 0.8 | 0.4 | |
| 05301 / West Brattleboro / VT / 39.1 mi. | 247 | 7,154 | 3.5 | $35,060 | 5.8 | 1.4 | 0.8 | 0.2 | 1.4 | |
| 12534 / Hudson / NY / 25.3 mi. | 223 | 7,422 | 3.0 | $32,741 | 20.2 | 4.9 | 11.6 | 0.2 | 1.4 | |
| 05262 / South Shaftsbury / VT / 32 mi. | 202 | 997 | 20.3 | $43,616 | 2.0 | 0.6 | 0.3 | 0.1 | 0.4 | |
| 12018 / Glass Lake / NY / 15.9 mi. | 195 | 2,790 | 7.0 | $57,713 | 2.6 | 0.9 | 0.3 | 0.3 | 0.4 | |
| 12168 / Stephentown Center / NY / 5.8 mi. | 162 | 827 | 19.6 | $42,250 | 3.0 | 1.3 | 0.1 | 0.3 | 0.2 | |
| 01258 / South Egremont / MA / 23 mi. | 158 | 64 | 246.9 | $53,125 | 0.0 | 0.0 | 0.0 | 0.0 | 0.0 | |
| 01253 / Otis / MA / 20.5 mi. | 156 | 283 | 55.1 | $54,107 | 3.5 | 0.3 | 0.9 | 0.0 | 0.9 | |
| 12090 / Walloomsac / NY / 28.7 mi. | 143 | 2,426 | 5.9 | $40,799 | 2.3 | 0.7 | 0.4 | 0.3 | 0.4 | |
| 01222 / Ashley Falls / MA / 25.8 mi. | 140 | 314 | 44.6 | $51,250 | 4.0 | 1.6 | 1.1 | 0.1 | 0.1 | |
| 05257 / Wolumsak / VT / 30.8 mi. | 133 | 844 | 15.8 | $42,357 | 3.6 | 1.2 | 0.4 | 0.1 | 1.0 | |
| 12037 / Chatham / NY / 14.1 mi. | 127 | 1,682 | 7.6 | $42,391 | 5.4 | 1.2 | 1.8 | 0.2 | 0.6 | |
| 12125 / New Lebanon Center / NY / 3 mi. | 121 | 597 | 20.3 | $42,063 | 5.6 | 1.1 | 1.3 | 0.1 | 2.1 | |
| 01103 / Springfield / MA / 41.8 mi. | 120 | 1,519 | 7.9 | $17,899 | 68.7 | 43.8 | 17.2 | 0.5 | 4.1 | |
| 01242 / Lenox Dale / MA / 8.9 mi. | 117 | 51 | 229.4 | $80,783 | 1.8 | 0.9 | 0.0 | 0.0 | 0.0 | |
| 01001 / Agawam / MA / 41.6 mi. | 99 | 6,987 | 1.4 | $45,735 | 4.6 | 1.7 | 1.0 | 0.1 | 1.2 | |
| 01245 / West Otis / MA / 16.9 mi. | 98 | 396 | 24.7 | $50,903 | 4.4 | 1.3 | 0.5 | 0.2 | 0.6 | |
| 01256 / Savoy / MA / 15.9 mi. | 93 | 287 | 32.4 | $41,477 | 3.1 | 0.7 | 0.7 | 0.4 | 0.0 | |
| 01060 / Northampton / MA / 32.8 mi. | 84 | 6,998 | 1.2 | $38,739 | 14.8 | 5.7 | 2.4 | 0.3 | 4.4 | |
| 01129 / Springfield / MA / 45.4 mi. | 80 | 2,756 | 2.9 | $46,076 | 25.1 | 8.0 | 13.8 | 0.3 | 1.4 | |
| 05261 / South Pownal / VT / 22.3 mi. | 79 | 960 | 8.2 | $35,688 | 2.7 | 0.3 | 0.4 | 0.4 | 0.7 | |
| 01020 / Chicopee / MA / 40.2 mi. | 71 | 12,537 | 0.6 | $37,282 | 7.6 | 4.1 | 1.3 | 0.1 | 1.1 | |
| 01255 / South Sandisfield / MA / 24 mi. | 69 | 295 | 23.4 | $45,469 | 3.6 | 1.1 | 0.5 | 0.1 | 0.1 | |
| 01085 / Westfield / MA / 34.6 mi. | 64 | 15,051 | 0.4 | $45,482 | 7.8 | 4.9 | 0.8 | 0.2 | 0.8 | |
| 01026 / West Cummington / MA / 22.9 mi. | 63 | 399 | 15.8 | $42,917 | 5.7 | 3.1 | 0.6 | 0.4 | 0.3 | |
| 01089 / West Springfield / MA / 39.4 mi. | 62 | 11,823 | 0.5 | $40,266 | 11.6 | 5.8 | 1.9 | 0.2 | 2.0 | |
| 12196 / West Sand Lake / NY / 18.3 mi. | 62 | 1,069 | 5.8 | $54,205 | 1.9 | 0.6 | 0.2 | 0.1 | 0.7 | |
| 12029 / Canaan / NY / 5.6 mi. | 59 | 461 | 12.8 | $56,250 | 15.5 | 3.0 | 10.6 | 0.3 | 0.4 | |
| 01098 / Worthington / MA / 23.3 mi. | 57 | 494 | 11.5 | $52,734 | 2.4 | 1.1 | 0.2 | 0.1 | 0.2 | |
| 01040 / Holyoke / MA / 36.8 mi. | 56 | 14,967 | 0.4 | $30,441 | 46.0 | 41.4 | 2.6 | 0.1 | 0.8 | |
| 05352 / Stamford / VT / 24.3 mi. | 51 | 313 | 16.3 | $48,988 | 1.7 | 0.3 | 0.0 | 0.3 | 0.4 | |
| 12153 / Taborton / NY / 14.1 mi. | 50 | 343 | 14.6 | $59,861 | 1.9 | 0.6 | 0.0 | 0.6 | 0.4 | |
| 01028 / East Longmeadow / MA / 46.4 mi. | 44 | 5,257 | 0.8 | $62,835 | 3.1 | 0.9 | 0.7 | 0.0 | 0.9 | |
| 01264 / Tyringham / MA / 14.7 mi. | 43 | 94 | 45.7 | $49,750 | 3.9 | 1.3 | 0.4 | 0.0 | 0.4 | |
| 01075 / South Hadley Falls / MA / 38 mi. | 39 | 6,595 | 0.6 | $46,731 | 7.3 | 2.4 | 1.2 | 0.1 | 2.6 | |
| 01095 / Wilbraham / MA / 47.3 mi. | 38 | 4,957 | 0.8 | $64,691 | 4.4 | 1.4 | 1.1 | 0.0 | 1.3 | |
| 06018 / North Canaan / CT / 28 mi. | 35 | 1,150 | 3.0 | $39,440 | 5.1 | 2.8 | 1.1 | 0.1 | 0.2 | |
| 01035 / North Hadley / MA / 36.1 mi. | 31 | 1,895 | 1.6 | $51,851 | 5.3 | 1.7 | 0.8 | 0.1 | 1.6 | |
| 12077 / Glenmont / NY / 24.2 mi. | 31 | 1,959 | 1.6 | $66,270 | 11.2 | 3.0 | 5.3 | 0.1 | 1.8 | |
| 01057 / Monson / MA / 53 mi. | 30 | 3,050 | 1.0 | $52,159 | 3.0 | 1.1 | 0.5 | 0.2 | 0.3 | |
| 01053 / Leeds / MA / 30.3 mi. | 24 | 578 | 4.2 | $56,094 | 5.2 | 2.8 | 0.4 | 0.0 | 0.2 | |
| 01011 / Chester / MA / 20.3 mi. | 23 | 799 | 2.9 | $45,511 | 2.3 | 1.3 | 0.2 | 0.1 | 0.0 | |
| 12060 / Red Rock / NY / 8.2 mi. | 20 | 567 | 3.5 | $46,319 | 4.8 | 0.7 | 1.3 | 0.1 | 0.9 | |
| 06840 / New Canaan / CT / 84.5 mi. | 18 | 6,824 | 0.3 | $141,592 | 6.1 | 1.7 | 1.0 | 0.0 | 2.3 | |
| File | ma_the_berkshire_eagle__pittsfield | |||||||||
| Time | 5/19/05 6:10 PM | |||||||||
| Page | 341 | |||||||||
| Member | 120600 | |||||||||