
|
| Comparing the racial diversity of the journalists | ||||||||||
| at America's daily newspapers | ||||||||||
| with the communities that they serve | ||||||||||
| Newsroom diversity report for | ||||||||||
| MetroWest Daily News, Framingham | ||||||||||
| Framingham, Massachusetts | ||||||||||
| Owner: Herald Media (Mass.) | ||||||||||
| From a report for the Knight Foundation | ||||||||||
| by Bill Dedman and Stephen K. Doig, June 2005 | ||||||||||
| Click here to read the national report or to select another newspaper | ||||||||||
| Year | Non-white % of newsroom staff | 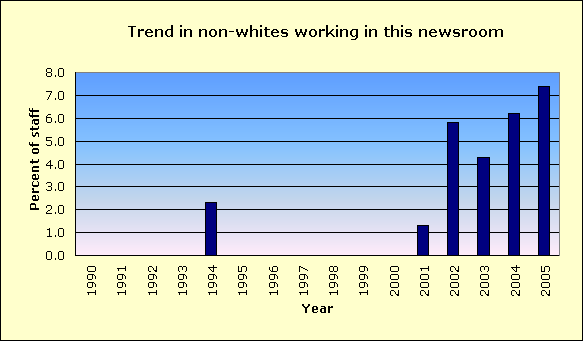
|
||||||||
| 2005 | 7.4 | |||||||||
| 2004 | 6.2 | |||||||||
| 2003 | 4.3 | |||||||||
| 2002 | 5.8 | |||||||||
| 2001 | 1.3 | |||||||||
| 2000 | Did not report | |||||||||
| 1999 | Did not report | |||||||||
| 1998 | Did not report | |||||||||
| 1997 | Did not report | |||||||||
| 1996 | Did not report | |||||||||
| 1995 | Did not report | |||||||||
| 1994 | 2.3 | |||||||||
| 1993 | Did not report | |||||||||
| 1992 | Did not report | |||||||||
| 1991 | Did not report | |||||||||
| 1990 | Did not report | |||||||||
| The latest year at peak is | 2005 | |||||||||
| See the notes and definitions section below for the sources of these figures. | ||||||||||
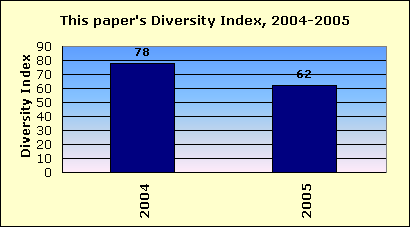
| Newsroom Diversity Index | ||||||||||
| for MetroWest Daily News, Framingham | ||||||||||
 |
||||||||||
| Year | Non-white % of newsroom staff | Non-white % of circulation area | Newsroom Diversity Index (parity=100) | |||||||
| 2005 | 7.4 | 12.0 | 62 | |||||||
| 2004 | 6.2 | 8.0 | 78 | |||||||
| How the index is calculated | ||||||||||
| The Newsroom Diversity Index is the non-white percentage of the newsroom staff | ||||||||||
| divided by the non-white percentage of residents in the circulation area. | ||||||||||
| (Parity = 100.) | ||||||||||
| Company index | ||||||||||
| This newspaper's owner, Herald Media (Mass.), | ||||||||||
| has a companywide, circulation-weighted Diversity Index of 84. | ||||||||||
| See the notes and definitions section below for the sources of these figures. | ||||||||||
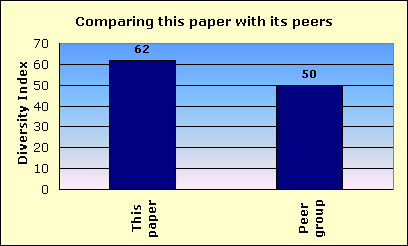
| Peer group comparison | ||||||||||
| for MetroWest Daily News, Framingham | ||||||||||
 |
||||||||||
| This newspaper's Newsroom Diversity Index is 62. | This paper | |||||||||
| Peer group | ||||||||||
| Compare that with 50, which is the median Diversity Index for all newspapers | ||||||||||
| reporting in this circulation category of 50,001 to 100,000 daily sales. | ||||||||||
| In that group, this newspaper's Diversity Index ranks 33 out of 90 | ||||||||||
| newspapers reporting in the category of 50,001 to 100,000 daily sales. | ||||||||||
| An example of a newspaper of similar circulation, in an area of similar level of non-white residents, but one that has a relatively high Diversity Index, is Lincoln Journal Star, Nebraska, with a 9.9 percent non-white staff in a community that is 8.3 percent non-white. Its index is 119. | ||||||||||
| FYI, in circulation, this newspaper's average weekday circulation of | ||||||||||
| approximately 50,608 ranks 203 out of 1,410 daily newspapers in the US. | ||||||||||
| See the notes and definitions section below for the sources of these figures. | ||||||||||
| Details on race/ethnicity | ||||||||||
| in the circulation area | ||||||||||
| and the home county | ||||||||||
| of MetroWest Daily News, Framingham | ||||||||||
| Circulation area | ||||||||||
| Race/ethnicity | % of population | Number of residents | 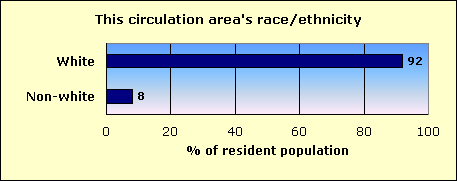
|
|||||||
| Hispanic | 2.3 | 8,638 | ||||||||
| Black | 1.3 | 4,819 | ||||||||
| Asian and Pacific Islander | 2.8 | 10,200 | ||||||||
| Native-American | 0.1 | 349 | ||||||||
| Other non-white | 0.4 | 1,327 | ||||||||
| Multi-racial | 1.2 | 4,271 | ||||||||
| Non-white | 8.0 | 29,604 | ||||||||
| White | 92.0 | 341,415 | ||||||||
| Total | 371,019 | |||||||||
| Home county: Middlesex | ||||||||||
| Race/ethnicity | % of population | Number of residents | 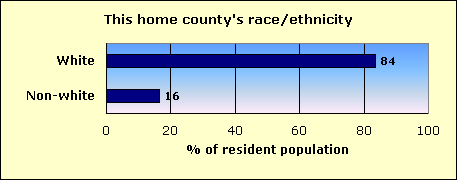
|
|||||||
| Hispanic | 4.6 | 66,707 | ||||||||
| Black | 3.2 | 46,598 | ||||||||
| Asian and Pacific Islander | 6.3 | 91,757 | ||||||||
| Native-American | 0.1 | 1,692 | ||||||||
| Other non-white | 0.5 | 6,821 | ||||||||
| Multi-racial | 1.9 | 27,050 | ||||||||
| Non-white | 16.4 | 240,625 | ||||||||
| White | 83.6 | 1,224,771 | ||||||||
| Total | 1,465,396 | |||||||||
| The home county of this newspaper is Middlesex. | ||||||||||
| About this report | ||||||||||
| This third annual report for the Knight Foundation adds context to an annual survey by the American Society of Newspaper Editors. ASNE has set a goal that | ||||||||||
| every newspaper, to help it know its community and gather the news, should employ at least one non-white journalist, and that newspapers should strive to | ||||||||||
| employ non-whites in proportion to their share of the community. ASNE's report, at www.asne.org, shows each newspaper's non-white employment, but does | ||||||||||
| not disclose how closely that employment mirrors the newspaper's circulation area. | ||||||||||
| That gap is filled by the report you are reading now. This report was not done by ASNE, but was done for the Knight Foundation by Bill Dedman and | ||||||||||
| Stephen K. Doig. It shows how close each newspaper is to ASNE's goal, by comparing the newsroom staffing with the circulation area population. | ||||||||||
| The full report is at www.powerreporting.com/knight. | ||||||||||
| Notes and definitions | ||||||||||
| 1. The Newsroom Diversity Index is the non-white percentage of the newsroom staff divided by the non-white percentage of the circulation area's residents. Parity = 100. | ||||||||||
| 2. Source for staffing: Survey by American Society of Newspaper Editors, April 2005. Newspapers report non-white staff as of the end of the previous year. | ||||||||||
| 3. Following ASNE's definition, newsroom staff includes only supervisors, reporters, editors, copy/layout editors and photographers. | ||||||||||
| 4. Also following ASNE's definition, "whites," "blacks," etc., exclude Hispanics, who are counted in a separate category. | ||||||||||
| 5. Source for boundaries of this newspaper's circulation area: ZIP Code circulation data, Audit Bureau of Circulations, latest available. | ||||||||||
| 6. A paper may define its circulation area differently for marketing efforts, or news coverage, or to set advertising rates. | ||||||||||
| 7. If ZIP Codes or counties are used, this report applies a threshold: 10 percent household penetration is required to include an area in the circulation area. | ||||||||||
| 8. Source for the demographics of residents of that circulation area: US Census 2000. | ||||||||||
| 9. Source for total circulation: Editor & Publisher magazine, Monday-Friday average at year-end 2004. | ||||||||||
| 10. Staff of non-English publications, such as the Miami Herald's El Nuevo Herald, are excluded from the ASNE staffing survey for the first time this year. | ||||||||||
| Demographics of ZIP Codes | ||||||||||
| where sales were reported by | ||||||||||
| MetroWest Daily News, Framingham | ||||||||||
| Note that some ZIP Codes listed here may not have been included in determining the newspaper's circulation area. In calculating the Diversity Index, a | ||||||||||
| ZIP Code was included only if the household penetration was at least 10 percent. Any lower-penetration ZIP Codes are also listed here for your information. | ||||||||||
| Also, if the newspaper reported more than 300 ZIP Codes, only the top 300 in weekday sales are listed here. | ||||||||||
| ZIP / City / State / Approx. distance in miles from the newspaper's home office | Weekday sales | Households | Penetration % (daily sales per 100 households) | Median household income | Non-white % of population |
Hispanic % of population |
Black % of population |
Native % of population |
Asian % of population |
|
| 01701 / Saxonville / MA / 0 mi. | 4,657 | 12,182 | 38.2 | $70,613 | 13.0 | 2.8 | 2.5 | 0.1 | 5.6 | |
| 01757 / Milford / MA / 11.5 mi. | 4,569 | 10,490 | 43.6 | $50,840 | 9.5 | 4.4 | 1.3 | 0.1 | 1.8 | |
| 01702 / Framingham / MA / 2.8 mi. | 3,207 | 14,058 | 22.8 | $42,614 | 35.1 | 17.8 | 6.2 | 0.2 | 5.0 | |
| 01752 / Marlborough / MA / 5.9 mi. | 2,972 | 14,501 | 20.5 | $56,879 | 15.1 | 6.1 | 2.0 | 0.1 | 3.8 | |
| 01760 / South Natick / MA / 4.1 mi. | 2,769 | 12,953 | 21.4 | $69,832 | 9.1 | 2.0 | 1.6 | 0.1 | 3.8 | |
| 02453 / Waltham / MA / 10 mi. | 2,322 | 11,523 | 20.2 | $50,189 | 25.0 | 12.3 | 4.5 | 0.1 | 6.5 | |
| 02062 / Norwood / MA / 13.8 mi. | 2,052 | 11,623 | 17.7 | $58,421 | 10.4 | 1.7 | 2.3 | 0.1 | 5.1 | |
| 01721 / Ashland / MA / 4.1 mi. | 1,888 | 5,720 | 33.0 | $68,392 | 9.9 | 2.9 | 1.7 | 0.1 | 2.5 | |
| 02038 / Franklin / MA / 14.3 mi. | 1,797 | 10,152 | 17.7 | $71,174 | 4.7 | 1.1 | 1.0 | 0.1 | 1.7 | |
| 02451 / Waltham / MA / 9.9 mi. | 1,725 | 7,276 | 23.7 | $57,186 | 20.7 | 5.5 | 4.3 | 0.1 | 9.2 | |
| 01746 / Holliston / MA / 7.5 mi. | 1,623 | 4,795 | 33.8 | $78,092 | 4.3 | 1.4 | 0.9 | 0.1 | 1.2 | |
| 02026 / Dedham / MA / 13.5 mi. | 1,460 | 8,666 | 16.8 | $61,631 | 6.8 | 2.4 | 1.4 | 0.1 | 1.9 | |
| 01749 / Hudson / MA / 7.8 mi. | 1,371 | 6,990 | 19.6 | $58,549 | 7.7 | 3.1 | 0.8 | 0.1 | 1.4 | |
| 01748 / Hopkinton / MA / 7.8 mi. | 1,288 | 4,444 | 29.0 | $89,281 | 4.7 | 1.3 | 0.6 | 0.1 | 1.7 | |
| 02019 / Bellingham / MA / 16 mi. | 1,235 | 5,557 | 22.2 | $64,496 | 3.9 | 1.2 | 0.9 | 0.1 | 0.9 | |
| 02452 / Waltham / MA / 11.5 mi. | 1,134 | 4,408 | 25.7 | $61,096 | 15.0 | 3.7 | 3.3 | 0.1 | 6.5 | |
| 02053 / Medway / MA / 11 mi. | 965 | 4,182 | 23.1 | $75,135 | 3.2 | 0.8 | 0.6 | 0.1 | 1.0 | |
| 01772 / Southborough / MA / 5 mi. | 872 | 2,779 | 31.4 | $105,160 | 6.6 | 1.4 | 0.5 | 0.1 | 3.7 | |
| 01747 / Spindleville / MA / 13 mi. | 810 | 2,170 | 37.3 | $60,651 | 2.9 | 1.1 | 0.6 | 0.0 | 0.7 | |
| 01756 / Mendon / MA / 15 mi. | 724 | 1,815 | 39.9 | $71,164 | 2.7 | 1.0 | 0.4 | 0.0 | 0.6 | |
| 02081 / Walpole / MA / 13.8 mi. | 627 | 6,370 | 9.8 | $72,861 | 6.1 | 2.2 | 1.9 | 0.1 | 1.2 | |
| 02090 / Westwood / MA / 12.5 mi. | 612 | 5,110 | 12.0 | $87,638 | 4.6 | 0.9 | 0.5 | 0.0 | 2.5 | |
| 01568 / West Upton / MA / 12.2 mi. | 460 | 2,040 | 22.5 | $78,410 | 2.9 | 0.7 | 0.5 | 0.1 | 1.0 | |
| 01569 / Uxbridge / MA / 18 mi. | 450 | 3,959 | 11.4 | $62,231 | 2.7 | 1.0 | 0.1 | 0.1 | 0.7 | |
| 02054 / Millis / MA / 10.1 mi. | 402 | 3,004 | 13.4 | $62,806 | 3.9 | 0.9 | 0.7 | 0.1 | 1.1 | |
| 01778 / Wayland / MA / 4 mi. | 385 | 4,664 | 8.3 | $101,585 | 8.5 | 1.1 | 0.7 | 0.1 | 5.3 | |
| 01776 / Sudbury / MA / 4.4 mi. | 361 | 5,505 | 6.6 | $118,579 | 6.7 | 1.2 | 0.8 | 0.0 | 3.7 | |
| 01532 / Northborough / MA / 10.3 mi. | 340 | 4,904 | 6.9 | $79,781 | 7.9 | 1.3 | 0.6 | 0.1 | 5.1 | |
| 01581 / Westborough / MA / 9.4 mi. | 290 | 6,536 | 4.4 | $73,418 | 14.2 | 3.3 | 1.4 | 0.1 | 8.1 | |
| 01754 / Maynard / MA / 7.7 mi. | 224 | 4,292 | 5.2 | $60,812 | 6.7 | 2.8 | 1.0 | 0.2 | 1.6 | |
| 02472 / Watertown / MA / 12.6 mi. | 208 | 14,629 | 1.4 | $59,764 | 10.3 | 2.7 | 1.7 | 0.1 | 3.9 | |
| 02465 / West Newton / MA / 10.1 mi. | 203 | 4,207 | 4.8 | $82,301 | 12.0 | 2.8 | 1.6 | 0.0 | 6.4 | |
| 01504 / Millerville / MA / 19.1 mi. | 202 | 3,235 | 6.2 | $55,163 | 3.4 | 1.0 | 0.3 | 0.2 | 0.8 | |
| 01775 / Stow / MA / 8.2 mi. | 152 | 2,082 | 7.3 | $96,290 | 5.3 | 1.4 | 0.4 | 0.1 | 2.0 | |
| 02052 / Medfield / MA / 10.6 mi. | 142 | 4,002 | 3.5 | $97,748 | 3.9 | 0.9 | 0.5 | 0.0 | 1.8 | |
| 02459 / Newton Center / MA / 11.4 mi. | 137 | 6,126 | 2.2 | $99,076 | 13.7 | 2.4 | 2.2 | 0.0 | 7.5 | |
| 02481 / Wellesley Hills / MA / 8 mi. | 132 | 4,755 | 2.8 | $123,622 | 8.0 | 1.8 | 1.1 | 0.0 | 4.0 | |
| 01770 / Sherborn / MA / 5.9 mi. | 102 | 1,423 | 7.2 | $121,693 | 4.4 | 1.1 | 0.4 | 0.0 | 2.4 | |
| 02458 / Riverside / MA / 11.9 mi. | 102 | 5,029 | 2.0 | $73,065 | 13.0 | 2.6 | 1.4 | 0.1 | 7.4 | |
| 02460 / Newtonville / MA / 11 mi. | 87 | 3,777 | 2.3 | $83,081 | 11.8 | 2.0 | 1.6 | 0.0 | 6.9 | |
| 01720 / West Acton / MA / 10.6 mi. | 70 | 7,293 | 1.0 | $91,492 | 12.7 | 1.8 | 0.7 | 0.1 | 8.6 | |
| 01588 / Whitinsville / MA / 16.9 mi. | 68 | 3,214 | 2.1 | $47,448 | 5.3 | 2.0 | 0.8 | 0.2 | 0.4 | |
| 01742 / West Concord / MA / 9.6 mi. | 65 | 5,976 | 1.1 | $95,997 | 9.2 | 2.8 | 2.2 | 0.1 | 2.9 | |
| 02493 / Weston / MA / 7 mi. | 46 | 3,718 | 1.2 | $153,918 | 11.4 | 1.9 | 1.2 | 0.1 | 6.9 | |
| 02021 / Canton / MA / 17.2 mi. | 45 | 7,950 | 0.6 | $69,260 | 8.5 | 1.4 | 2.8 | 0.1 | 3.1 | |
| 02466 / Newton / MA / 9 mi. | 45 | 2,724 | 1.7 | $78,786 | 14.6 | 2.9 | 2.3 | 0.1 | 8.1 | |
| 01545 / Shrewsbury / MA / 14 mi. | 32 | 12,376 | 0.3 | $64,175 | 11.9 | 1.6 | 1.4 | 0.1 | 7.6 | |
| 01503 / Berlin / MA / 10.3 mi. | 24 | 872 | 2.8 | $65,667 | 2.7 | 0.5 | 0.2 | 0.1 | 1.0 | |
| File | ma_metrowest_daily_news__framingham | |||||||||
| Time | 5/19/05 5:10 PM | |||||||||
| Page | 203 | |||||||||
| Member | 119850 | |||||||||