
|
| Comparing the racial diversity of the journalists | ||||||||||
| at America's daily newspapers | ||||||||||
| with the communities that they serve | ||||||||||
| Newsroom diversity report for | ||||||||||
| The Journal Gazette, Fort Wayne | ||||||||||
| Fort Wayne, Indiana | ||||||||||
| From a report for the Knight Foundation | ||||||||||
| by Bill Dedman and Stephen K. Doig, June 2005 | ||||||||||
| Click here to read the national report or to select another newspaper | ||||||||||
| Year | Non-white % of newsroom staff | 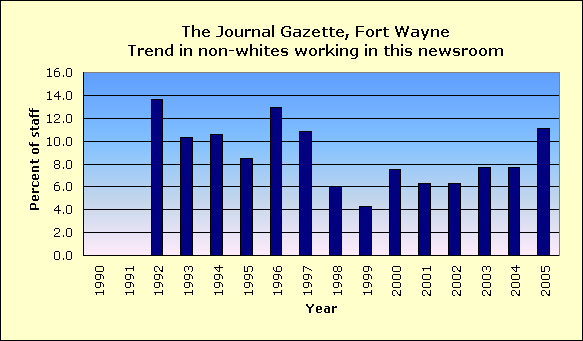
|
||||||||
| 2005 | 11.1 | |||||||||
| 2004 | 7.7 | |||||||||
| 2003 | 7.7 | |||||||||
| 2002 | 6.3 | |||||||||
| 2001 | 6.3 | |||||||||
| 2000 | 7.5 | |||||||||
| 1999 | 4.3 | |||||||||
| 1998 | 6.0 | |||||||||
| 1997 | 10.8 | |||||||||
| 1996 | 12.9 | |||||||||
| 1995 | 8.5 | |||||||||
| 1994 | 10.6 | |||||||||
| 1993 | 10.3 | |||||||||
| 1992 | 13.6 | |||||||||
| 1991 | Did not report | |||||||||
| 1990 | Did not report | |||||||||
| The latest year at peak is | 1992 | |||||||||
| See the notes and definitions section below for the sources of these figures. | ||||||||||
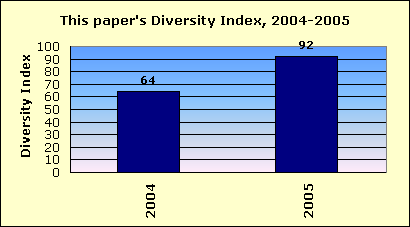
| Newsroom Diversity Index | ||||||||||
| for The Journal Gazette, Fort Wayne | ||||||||||
 |
||||||||||
| Year | Non-white % of newsroom staff | Non-white % of circulation area | Newsroom Diversity Index (parity=100) | |||||||
| 2005 | 11.1 | 12.1 | 92 | |||||||
| 2004 | 7.7 | 12.1 | 64 | |||||||
| How the index is calculated | ||||||||||
| The Newsroom Diversity Index is the non-white percentage of the newsroom staff | ||||||||||
| divided by the non-white percentage of residents in the circulation area. | ||||||||||
| (Parity = 100.) | ||||||||||
| See the notes and definitions section below for the sources of these figures. | ||||||||||
| Peer group comparison | ||||||||||
| for The Journal Gazette, Fort Wayne | ||||||||||
 |
||||||||||
| This newspaper's Newsroom Diversity Index is 92. | This paper | |||||||||
| Peer group | ||||||||||
| Compare that with 50, which is the median Diversity Index for all newspapers | ||||||||||
| reporting in this circulation category of 50,001 to 100,000 daily sales. | ||||||||||
| In that group, this newspaper's Diversity Index ranks 16 out of 90 | ||||||||||
| newspapers reporting in the category of 50,001 to 100,000 daily sales. | ||||||||||
| FYI, in circulation, this newspaper's average weekday circulation of | ||||||||||
| approximately 61,205 ranks 171 out of 1,410 daily newspapers in the US. | ||||||||||
| See the notes and definitions section below for the sources of these figures. | ||||||||||
| Details on race/ethnicity | ||||||||||
| in the circulation area | ||||||||||
| and the home county | ||||||||||
| of The Journal Gazette, Fort Wayne | ||||||||||
| Circulation area | ||||||||||
| Race/ethnicity | % of population | Number of residents | 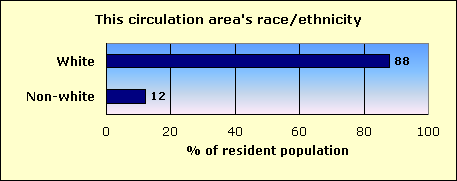
|
|||||||
| Hispanic | 3.3 | 19,277 | ||||||||
| Black | 6.4 | 37,889 | ||||||||
| Asian and Pacific Islander | 0.9 | 5,531 | ||||||||
| Native-American | 0.3 | 1,626 | ||||||||
| Other non-white | 0.1 | 651 | ||||||||
| Multi-racial | 1.1 | 6,446 | ||||||||
| Non-white | 12.1 | 71,420 | ||||||||
| White | 88.0 | 521,136 | ||||||||
| Total | 592,556 | |||||||||
| Home county: Allen | ||||||||||
| Race/ethnicity | % of population | Number of residents | 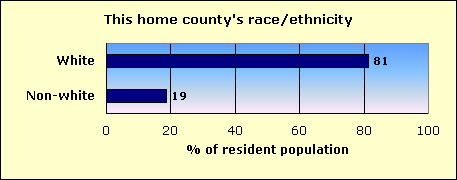
|
|||||||
| Hispanic | 4.2 | 13,877 | ||||||||
| Black | 11.2 | 37,149 | ||||||||
| Asian and Pacific Islander | 1.4 | 4,700 | ||||||||
| Native-American | 0.3 | 1,000 | ||||||||
| Other non-white | 0.2 | 562 | ||||||||
| Multi-racial | 1.5 | 4,829 | ||||||||
| Non-white | 18.7 | 62,117 | ||||||||
| White | 81.3 | 269,732 | ||||||||
| Total | 331,849 | |||||||||
| The home county of this newspaper is Allen. | ||||||||||
| About this report | ||||||||||
| This third annual report for the Knight Foundation adds context to an annual survey by the American Society of Newspaper Editors. ASNE has set a goal that | ||||||||||
| every newspaper, to help it know its community and gather the news, should employ at least one non-white journalist, and that newspapers should strive to | ||||||||||
| employ non-whites in proportion to their share of the community. ASNE's report, at www.asne.org, shows each newspaper's non-white employment, but does | ||||||||||
| not disclose how closely that employment mirrors the newspaper's circulation area. | ||||||||||
| That gap is filled by the report you are reading now. This report was not done by ASNE, but was done for the Knight Foundation by Bill Dedman and | ||||||||||
| Stephen K. Doig. It shows how close each newspaper is to ASNE's goal, by comparing the newsroom staffing with the circulation area population. | ||||||||||
| The full report is at www.powerreporting.com/knight. | ||||||||||
| Notes and definitions | ||||||||||
| 1. The Newsroom Diversity Index is the non-white percentage of the newsroom staff divided by the non-white percentage of the circulation area's residents. Parity = 100. | ||||||||||
| 2. Source for staffing: Survey by American Society of Newspaper Editors, April 2005. Newspapers report non-white staff as of the end of the previous year. | ||||||||||
| 3. Following ASNE's definition, newsroom staff includes only supervisors, reporters, editors, copy/layout editors and photographers. | ||||||||||
| 4. Also following ASNE's definition, "whites," "blacks," etc., exclude Hispanics, who are counted in a separate category. | ||||||||||
| 5. Source for boundaries of this newspaper's circulation area: ZIP Code circulation data, Audit Bureau of Circulations, latest available. | ||||||||||
| 6. A paper may define its circulation area differently for marketing efforts, or news coverage, or to set advertising rates. | ||||||||||
| 7. If ZIP Codes or counties are used, this report applies a threshold: 10 percent household penetration is required to include an area in the circulation area. | ||||||||||
| 8. Source for the demographics of residents of that circulation area: US Census 2000. | ||||||||||
| 9. Source for total circulation: Editor & Publisher magazine, Monday-Friday average at year-end 2004. | ||||||||||
| 10. Staff of non-English publications, such as the Miami Herald's El Nuevo Herald, are excluded from the ASNE staffing survey for the first time this year. | ||||||||||
| Demographics of ZIP Codes | ||||||||||
| where sales were reported by | ||||||||||
| The Journal Gazette, Fort Wayne | ||||||||||
| Note that some ZIP Codes listed here may not have been included in determining the newspaper's circulation area. In calculating the Diversity Index, a | ||||||||||
| ZIP Code was included only if the household penetration was at least 10 percent. Any lower-penetration ZIP Codes are also listed here for your information. | ||||||||||
| Also, if the newspaper reported more than 300 ZIP Codes, only the top 300 in weekday sales are listed here. | ||||||||||
| ZIP / City / State / Approx. distance in miles from the newspaper's home office | Weekday sales | Households | Penetration % (daily sales per 100 households) | Median household income | Non-white % of population |
Hispanic % of population |
Black % of population |
Native % of population |
Asian % of population |
|
| 46835 / Fort Wayne / IN / 8.7 mi. | 3,474 | 12,304 | 28.2 | $52,663 | 8.7 | 2.0 | 3.5 | 0.2 | 1.9 | |
| 46802 / Fort Wayne / IN / 0 mi. | 3,258 | 5,055 | 64.5 | $25,283 | 33.4 | 12.8 | 15.6 | 0.6 | 2.0 | |
| 46804 / Fort Wayne / IN / 2.6 mi. | 3,189 | 10,265 | 31.1 | $60,069 | 8.4 | 2.4 | 2.5 | 0.3 | 2.1 | |
| 46815 / Fort Wayne / IN / 6.2 mi. | 3,157 | 10,314 | 30.6 | $50,750 | 10.2 | 2.3 | 4.9 | 0.2 | 1.3 | |
| 46808 / Fort Wayne / IN / 2.3 mi. | 3,052 | 8,153 | 37.4 | $34,006 | 9.9 | 4.3 | 2.2 | 0.5 | 1.2 | |
| 46805 / Fort Wayne / IN / 3.5 mi. | 2,898 | 9,639 | 30.1 | $32,858 | 13.3 | 5.0 | 4.4 | 0.4 | 1.7 | |
| 46825 / Fort Wayne / IN / 6.4 mi. | 2,675 | 10,029 | 26.7 | $42,194 | 12.3 | 2.6 | 4.4 | 0.3 | 3.1 | |
| 46818 / Fort Wayne / IN / 7.1 mi. | 1,981 | 5,449 | 36.4 | $44,842 | 6.5 | 1.9 | 1.6 | 0.6 | 1.4 | |
| 46845 / Fort Wayne / IN / 10.1 mi. | 1,850 | 5,164 | 35.8 | $77,505 | 4.0 | 0.9 | 0.9 | 0.2 | 1.3 | |
| 46774 / New Haven / IN / 10.3 mi. | 1,806 | 5,330 | 33.9 | $46,584 | 2.9 | 1.3 | 0.5 | 0.2 | 0.3 | |
| 46733 / Decatur / IN / 20 mi. | 1,795 | 7,224 | 24.8 | $41,829 | 5.9 | 4.9 | 0.2 | 0.2 | 0.2 | |
| 46725 / Columbia City / IN / 17.1 mi. | 1,699 | 7,996 | 21.2 | $46,661 | 2.4 | 0.9 | 0.2 | 0.4 | 0.2 | |
| 46807 / Fort Wayne / IN / 1.7 mi. | 1,639 | 6,637 | 24.7 | $37,673 | 23.2 | 8.9 | 10.1 | 0.4 | 1.3 | |
| 46816 / Fort Wayne / IN / 7.9 mi. | 1,364 | 7,244 | 18.8 | $35,173 | 43.9 | 6.0 | 33.6 | 0.2 | 1.4 | |
| 46809 / Fort Wayne / IN / 4.8 mi. | 1,323 | 3,861 | 34.3 | $38,540 | 8.3 | 3.9 | 2.1 | 0.3 | 0.5 | |
| 46750 / Huntington / IN / 20 mi. | 1,307 | 10,549 | 12.4 | $41,006 | 2.4 | 0.9 | 0.2 | 0.4 | 0.4 | |
| 46706 / Auburn / IN / 20.2 mi. | 1,293 | 6,758 | 19.1 | $46,669 | 3.1 | 1.5 | 0.4 | 0.1 | 0.5 | |
| 46806 / Fort Wayne / IN / 3.4 mi. | 1,290 | 9,685 | 13.3 | $28,123 | 71.2 | 10.3 | 56.7 | 0.3 | 0.9 | |
| 46714 / Bluffton / IN / 24.1 mi. | 1,274 | 5,577 | 22.8 | $39,864 | 3.1 | 1.8 | 0.2 | 0.2 | 0.3 | |
| 46703 / Angola / IN / 41.8 mi. | 1,127 | 6,773 | 16.6 | $43,649 | 5.2 | 2.8 | 0.5 | 0.3 | 0.7 | |
| 46814 / Fort Wayne / IN / 6.3 mi. | 1,123 | 2,498 | 45.0 | $112,300 | 6.6 | 1.6 | 1.4 | 0.2 | 2.8 | |
| 46819 / Fort Wayne / IN / 7.2 mi. | 1,016 | 3,709 | 27.4 | $44,287 | 10.8 | 3.4 | 5.3 | 0.3 | 0.4 | |
| 46755 / Kendallville / IN / 27.7 mi. | 829 | 5,876 | 14.1 | $39,154 | 4.6 | 2.7 | 0.4 | 0.2 | 0.6 | |
| 46962 / North Manchester / IN / 33.1 mi. | 735 | 3,512 | 20.9 | $38,009 | 3.9 | 1.6 | 0.6 | 0.4 | 0.6 | |
| 46723 / Churubusco / IN / 13.7 mi. | 580 | 2,567 | 22.6 | $49,786 | 2.0 | 0.8 | 0.2 | 0.3 | 0.2 | |
| 46711 / Berne / IN / 31.4 mi. | 570 | 2,574 | 22.1 | $35,772 | 2.3 | 1.4 | 0.1 | 0.1 | 0.1 | |
| 46803 / Fort Wayne / IN / 4.2 mi. | 544 | 3,689 | 14.7 | $23,974 | 66.5 | 9.2 | 54.0 | 0.3 | 1.0 | |
| 46738 / Garrett / IN / 18.1 mi. | 532 | 2,831 | 18.8 | $44,205 | 3.6 | 1.8 | 0.3 | 0.3 | 0.6 | |
| 45891 / Van Wert / OH / 32 mi. | 515 | 6,310 | 8.2 | $37,813 | 4.5 | 2.1 | 1.3 | 0.1 | 0.3 | |
| 46761 / Lagrange / IN / 42.1 mi. | 486 | 3,715 | 13.1 | $41,102 | 5.7 | 4.6 | 0.3 | 0.0 | 0.2 | |
| 46580 / Warsaw / IN / 38.1 mi. | 426 | 7,765 | 5.5 | $42,041 | 9.9 | 7.3 | 1.0 | 0.2 | 0.6 | |
| 46777 / Ossian / IN / 13.8 mi. | 419 | 2,320 | 18.1 | $50,172 | 2.0 | 0.9 | 0.1 | 0.1 | 0.1 | |
| 46765 / Leo / IN / 13.1 mi. | 392 | 1,311 | 29.9 | $67,011 | 2.9 | 1.1 | 0.2 | 0.3 | 0.3 | |
| 46555 / North Webster / IN / 32.5 mi. | 367 | 1,101 | 33.3 | $42,540 | 3.1 | 1.7 | 0.1 | 0.3 | 0.3 | |
| 46737 / Fremont / IN / 47.6 mi. | 348 | 2,554 | 13.6 | $45,488 | 2.3 | 1.2 | 0.2 | 0.2 | 0.1 | |
| 46783 / Roanoke / IN / 11.8 mi. | 340 | 1,848 | 18.4 | $50,636 | 2.6 | 1.0 | 0.5 | 0.2 | 0.3 | |
| 46773 / Monroeville / IN / 15.9 mi. | 337 | 1,326 | 25.4 | $46,735 | 3.0 | 1.4 | 0.2 | 0.3 | 0.1 | |
| 43526 / Hicksville / OH / 28.9 mi. | 330 | 2,301 | 14.3 | $41,035 | 3.6 | 2.7 | 0.1 | 0.1 | 0.1 | |
| 46787 / South Whitley / IN / 23.2 mi. | 309 | 1,485 | 20.8 | $40,363 | 2.0 | 1.1 | 0.2 | 0.1 | 0.1 | |
| 45879 / Paulding / OH / 32.3 mi. | 285 | 2,472 | 11.5 | $39,349 | 8.2 | 5.1 | 1.7 | 0.2 | 0.2 | |
| 46710 / Avilla / IN / 21.4 mi. | 285 | 1,566 | 18.2 | $47,558 | 2.7 | 0.7 | 0.1 | 0.3 | 0.3 | |
| 43512 / Defiance / OH / 46.6 mi. | 269 | 11,459 | 2.3 | $45,653 | 12.7 | 8.9 | 2.2 | 0.3 | 0.5 | |
| 46745 / Hoagland / IN / 11.5 mi. | 266 | 565 | 47.1 | $56,034 | 1.8 | 0.7 | 0.2 | 0.4 | 0.3 | |
| 46797 / Woodburn / IN / 16.5 mi. | 259 | 1,394 | 18.6 | $49,592 | 2.1 | 1.3 | 0.3 | 0.1 | 0.1 | |
| 46562 / Pierceton / IN / 29.9 mi. | 252 | 1,565 | 16.1 | $40,458 | 6.2 | 4.3 | 0.2 | 0.4 | 0.4 | |
| 46567 / Syracuse / IN / 37.7 mi. | 239 | 3,856 | 6.2 | $46,532 | 4.8 | 3.0 | 0.5 | 0.2 | 0.4 | |
| 46701 / Albion / IN / 23.1 mi. | 235 | 2,784 | 8.4 | $45,134 | 2.9 | 1.0 | 0.9 | 0.4 | 0.1 | |
| 46992 / Wabash / IN / 41.8 mi. | 214 | 7,140 | 3.0 | $39,404 | 3.4 | 1.1 | 0.4 | 0.8 | 0.5 | |
| 46721 / Butler / IN / 29.3 mi. | 211 | 1,832 | 11.5 | $41,334 | 3.1 | 1.9 | 0.1 | 0.3 | 0.1 | |
| 46767 / Ligonier / IN / 36.6 mi. | 209 | 2,443 | 8.6 | $41,889 | 27.6 | 26.3 | 0.2 | 0.2 | 0.5 | |
| 46741 / Grabill / IN / 15.7 mi. | 193 | 1,364 | 14.1 | $49,970 | 1.7 | 0.5 | 0.2 | 0.1 | 0.4 | |
| 46742 / Hamilton / IN / 37 mi. | 193 | 1,309 | 14.7 | $45,500 | 2.2 | 1.5 | 0.1 | 0.2 | 0.1 | |
| 46705 / Ashley / IN / 32.9 mi. | 189 | 653 | 28.9 | $37,917 | 3.6 | 1.4 | 0.2 | 0.1 | 0.6 | |
| 43506 / Bryan / OH / 41.9 mi. | 185 | 6,162 | 3.0 | $40,820 | 5.0 | 3.2 | 0.2 | 0.2 | 0.7 | |
| 46792 / Warren / IN / 28.5 mi. | 184 | 1,432 | 12.8 | $45,068 | 2.0 | 1.1 | 0.1 | 0.3 | 0.2 | |
| 45813 / Antwerp / OH / 24 mi. | 182 | 1,417 | 12.8 | $40,532 | 3.5 | 1.9 | 0.5 | 0.2 | 0.1 | |
| 46743 / Harlan / IN / 20.7 mi. | 177 | 423 | 41.8 | $47,798 | 2.2 | 1.2 | 0.2 | 0.3 | 0.0 | |
| 46770 / Markle / IN / 17.8 mi. | 174 | 934 | 18.6 | $46,887 | 1.4 | 0.9 | 0.2 | 0.0 | 0.0 | |
| 46793 / Waterloo / IN / 28.5 mi. | 172 | 1,531 | 11.2 | $45,924 | 3.7 | 2.5 | 0.2 | 0.2 | 0.2 | |
| 45880 / Payne / OH / 21.9 mi. | 160 | 957 | 16.7 | $41,250 | 3.7 | 2.5 | 0.2 | 0.3 | 0.1 | |
| 46740 / Geneva / IN / 33.1 mi. | 158 | 1,163 | 13.6 | $38,233 | 2.3 | 1.1 | 0.1 | 0.1 | 0.4 | |
| 45874 / Ohio City / OH / 30.8 mi. | 141 | 940 | 15.0 | $39,122 | 1.8 | 0.8 | 0.4 | 0.0 | 0.1 | |
| 46776 / Orland / IN / 45.9 mi. | 134 | 568 | 23.6 | $44,955 | 1.8 | 0.6 | 0.0 | 0.1 | 0.1 | |
| 46772 / Monroe / IN / 30.3 mi. | 132 | 762 | 17.3 | $42,853 | 1.8 | 1.3 | 0.0 | 0.0 | 0.0 | |
| 46795 / Wolcottville / IN / 35.5 mi. | 132 | 2,208 | 6.0 | $44,533 | 1.7 | 0.7 | 0.0 | 0.1 | 0.1 | |
| 43517 / Edgerton / OH / 34.4 mi. | 122 | 1,397 | 8.7 | $45,528 | 2.8 | 1.6 | 0.1 | 0.1 | 0.2 | |
| 45832 / Convoy / OH / 23.5 mi. | 116 | 1,079 | 10.8 | $45,156 | 2.5 | 1.2 | 0.1 | 0.1 | 0.2 | |
| 46784 / Rome City / IN / 30.2 mi. | 116 | 993 | 11.7 | $43,646 | 3.0 | 1.2 | 0.1 | 0.2 | 0.3 | |
| 46748 / Huntertown / IN / 12.7 mi. | 98 | 1,164 | 8.4 | $58,456 | 2.3 | 0.9 | 0.4 | 0.2 | 0.4 | |
| 46702 / Andrews / IN / 28.9 mi. | 94 | 900 | 10.4 | $37,991 | 4.0 | 1.6 | 0.1 | 0.9 | 0.2 | |
| 49036 / Coldwater / MI / 58.5 mi. | 94 | 8,808 | 1.1 | $39,052 | 10.4 | 2.9 | 4.5 | 0.5 | 0.6 | |
| 45886 / Scott / OH / 30.7 mi. | 88 | 207 | 42.5 | $41,786 | 5.2 | 1.9 | 1.8 | 0.2 | 0.2 | |
| 47371 / Portland / IN / 44.7 mi. | 87 | 4,912 | 1.8 | $36,039 | 3.5 | 2.4 | 0.3 | 0.1 | 0.4 | |
| 46590 / Winona Lake / IN / 36.6 mi. | 84 | 1,294 | 6.5 | $42,037 | 11.1 | 8.7 | 0.7 | 0.0 | 0.8 | |
| 46799 / Zanesville / IN / 12.3 mi. | 82 | 48 | 170.8 | $61,458 | 0.0 | 0.0 | 0.0 | 0.0 | 0.0 | |
| 46747 / Hudson / IN / 34.4 mi. | 81 | 978 | 8.3 | $44,420 | 2.2 | 1.1 | 0.0 | 0.5 | 0.2 | |
| 46798 / Yoder / IN / 9.2 mi. | 80 | 711 | 11.3 | $49,500 | 4.1 | 2.0 | 0.4 | 0.4 | 0.5 | |
| 46788 / Spencerville / IN / 19.1 mi. | 70 | 877 | 8.0 | $58,621 | 1.3 | 0.3 | 0.4 | 0.1 | 0.1 | |
| 43543 / Montpelier / OH / 47 mi. | 67 | 3,211 | 2.1 | $37,781 | 3.6 | 1.7 | 0.2 | 0.2 | 0.9 | |
| 43556 / Sherwood / OH / 35.1 mi. | 67 | 672 | 10.0 | $44,118 | 3.9 | 2.5 | 0.4 | 0.3 | 0.1 | |
| 46571 / Topeka / IN / 39.8 mi. | 61 | 1,403 | 4.3 | $43,716 | 2.2 | 1.3 | 0.0 | 0.1 | 0.2 | |
| 46952 / Marion / IN / 41.3 mi. | 55 | 9,018 | 0.6 | $37,234 | 9.6 | 2.2 | 4.1 | 0.4 | 1.2 | |
| 46779 / Pleasant Lake / IN / 36.9 mi. | 54 | 827 | 6.5 | $41,992 | 2.7 | 1.8 | 0.1 | 0.2 | 0.1 | |
| 45851 / Haviland / OH / 27.9 mi. | 45 | 226 | 19.9 | $45,000 | 2.3 | 0.4 | 1.0 | 0.2 | 0.3 | |
| 46732 / Cromwell / IN / 30.5 mi. | 45 | 1,138 | 4.0 | $43,565 | 19.4 | 17.8 | 0.1 | 0.2 | 0.3 | |
| 47326 / Bryant / IN / 38.9 mi. | 44 | 634 | 6.9 | $40,344 | 3.9 | 1.5 | 0.5 | 0.5 | 0.6 | |
| 45882 / Rockford / OH / 37.1 mi. | 37 | 1,103 | 3.4 | $42,667 | 1.7 | 0.9 | 0.1 | 0.5 | 0.0 | |
| 46763 / Laotto / IN / 17.1 mi. | 37 | 612 | 6.0 | $48,654 | 2.0 | 0.9 | 0.1 | 0.1 | 0.3 | |
| 46760 / Kimmell / IN / 28.4 mi. | 36 | 497 | 7.2 | $39,821 | 3.0 | 2.3 | 0.3 | 0.3 | 0.0 | |
| 43518 / Edon / OH / 42.2 mi. | 33 | 1,084 | 3.0 | $42,172 | 1.4 | 0.7 | 0.1 | 0.0 | 0.2 | |
| 46781 / Poneto / IN / 30.3 mi. | 31 | 333 | 9.3 | $43,854 | 1.8 | 0.2 | 0.0 | 0.2 | 0.3 | |
| 46982 / Silver Lake / IN / 35.7 mi. | 30 | 984 | 3.0 | $38,457 | 3.4 | 2.3 | 0.2 | 0.3 | 0.1 | |
| 46730 / Corunna / IN / 27.4 mi. | 27 | 485 | 5.6 | $45,313 | 2.2 | 1.4 | 0.0 | 0.1 | 0.0 | |
| 46746 / Howe / IN / 47.8 mi. | 26 | 1,461 | 1.8 | $38,594 | 11.4 | 9.2 | 0.4 | 0.2 | 0.8 | |
| 45898 / Willshire / OH / 31.2 mi. | 25 | 474 | 5.3 | $46,445 | 1.3 | 0.6 | 0.1 | 0.0 | 0.1 | |
| 46943 / Laketon / IN / 35.5 mi. | 24 | 103 | 23.3 | $22,321 | 1.5 | 1.1 | 0.0 | 0.0 | 0.0 | |
| 46766 / Liberty Center / IN / 26 mi. | 22 | 224 | 9.8 | $50,625 | 4.0 | 1.6 | 0.2 | 0.0 | 0.2 | |
| 47359 / Montpelier / IN / 36.2 mi. | 22 | 1,315 | 1.7 | $32,831 | 2.2 | 0.8 | 0.1 | 0.2 | 0.0 | |
| 46510 / Claypool / IN / 35.9 mi. | 21 | 1,261 | 1.7 | $42,163 | 1.8 | 0.7 | 0.3 | 0.2 | 0.1 | |
| 46785 / Saint Joe / IN / 22.9 mi. | 20 | 481 | 4.2 | $45,139 | 2.4 | 1.7 | 0.1 | 0.0 | 0.0 | |
| 46975 / Rochester / IN / 56.7 mi. | 17 | 5,619 | 0.3 | $38,611 | 4.5 | 1.5 | 0.9 | 0.4 | 0.6 | |
| 46539 / Mentone / IN / 45.1 mi. | 16 | 833 | 1.9 | $45,256 | 4.5 | 4.0 | 0.0 | 0.2 | 0.1 | |
| 46794 / Wawaka / IN / 33 mi. | 14 | 573 | 2.4 | $49,100 | 3.8 | 2.7 | 0.2 | 0.0 | 0.3 | |
| 46910 / Akron / IN / 46.1 mi. | 9 | 1,145 | 0.8 | $37,314 | 9.3 | 8.3 | 0.1 | 0.2 | 0.0 | |
| 46542 / Milford / IN / 43.4 mi. | 7 | 1,378 | 0.5 | $44,788 | 8.9 | 7.4 | 0.4 | 0.1 | 0.2 | |
| 46974 / Roann / IN / 38.3 mi. | 4 | 589 | 0.7 | $45,038 | 2.0 | 0.2 | 0.1 | 0.4 | 0.2 | |
| 47369 / Pennville / IN / 37.6 mi. | 4 | 530 | 0.8 | $32,885 | 2.0 | 1.8 | 0.0 | 0.0 | 0.0 | |
| 45873 / Oakwood / OH / 39.5 mi. | 2 | 943 | 0.2 | $41,250 | 2.5 | 1.3 | 0.3 | 0.1 | 0.1 | |
| File | in_the_journal_gazette__fort_wayne | |||||||||
| Time | 5/20/05 6:32 PM | |||||||||
| Page | 171 | |||||||||
| Member | 113250A | |||||||||