
|
| Comparing the racial diversity of the journalists | ||||||||||
| at America's daily newspapers | ||||||||||
| with the communities that they serve | ||||||||||
| Newsroom diversity report for | ||||||||||
| The Pantagraph, Bloomington | ||||||||||
| Bloomington, Illinois | ||||||||||
| Owner: Pulitzer (Mo.) | ||||||||||
| From a report for the Knight Foundation | ||||||||||
| by Bill Dedman and Stephen K. Doig, June 2005 | ||||||||||
| Click here to read the national report or to select another newspaper | ||||||||||
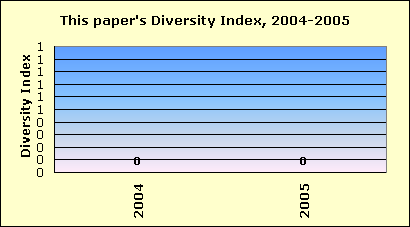
| Year | Non-white % of newsroom staff | |||||||||
| 2005 | 0.0 | |||||||||
| 2004 | 0.0 | |||||||||
| 2003 | 0.0 | |||||||||
| 2002 | 0.0 | |||||||||
| 2001 | 0.0 | |||||||||
| 2000 | 0.0 | |||||||||
| 1999 | 0.0 | |||||||||
| 1998 | 0.0 | |||||||||
| 1997 | Did not report | |||||||||
| 1996 | 0.0 | |||||||||
| 1995 | 0.0 | |||||||||
| 1994 | Did not report | |||||||||
| 1993 | 0.0 | |||||||||
| 1992 | Did not report | |||||||||
| 1991 | Did not report | |||||||||
| 1990 | Did not report | |||||||||
| The latest year at peak is | 2005 | |||||||||
| See the notes and definitions section below for the sources of these figures. | ||||||||||
| Newsroom Diversity Index | ||||||||||
| for The Pantagraph, Bloomington | ||||||||||
 |
||||||||||
| Year | Non-white % of newsroom staff | Non-white % of circulation area | Newsroom Diversity Index (parity=100) | |||||||
| 2005 | 0.0 | 9.5 | 0 | |||||||
| 2004 | 0.0 | 9.5 | 0 | |||||||
| How the index is calculated | ||||||||||
| The Newsroom Diversity Index is the non-white percentage of the newsroom staff | ||||||||||
| divided by the non-white percentage of residents in the circulation area. | ||||||||||
| (Parity = 100.) | ||||||||||
| Company index | ||||||||||
| This newspaper's owner, Pulitzer (Mo.), | ||||||||||
| has a companywide, circulation-weighted Diversity Index of 59. | ||||||||||
| See the notes and definitions section below for the sources of these figures. | ||||||||||
| Peer group comparison | ||||||||||
| for The Pantagraph, Bloomington | ||||||||||
 |
||||||||||
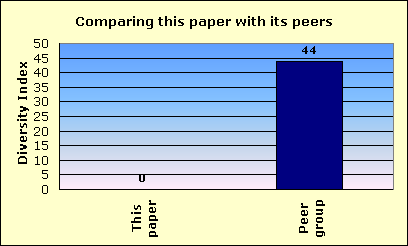
| This newspaper's Newsroom Diversity Index is 0. | This paper | |||||||||
| Peer group | ||||||||||
| Compare that with 44, which is the median Diversity Index for all newspapers | ||||||||||
| reporting in this circulation category of 25,001 to 50,000 daily sales. | ||||||||||
| In that group, this newspaper's Diversity Index ranks 123 out of 140 | ||||||||||
| newspapers reporting in the category of 25,001 to 50,000 daily sales. | ||||||||||
| An example of a newspaper of similar circulation, in an area of similar level of non-white residents, but one that has a relatively high Diversity Index, is Herald & Review, Decatur, Illinois, with a 11.1 percent non-white staff in a community that is 11 percent non-white. Its index is 101. | ||||||||||
| FYI, in circulation, this newspaper's average weekday circulation of | ||||||||||
| approximately 47,083 ranks 223 out of 1,410 daily newspapers in the US. | ||||||||||
| See the notes and definitions section below for the sources of these figures. | ||||||||||
| Details on race/ethnicity | ||||||||||
| in the circulation area | ||||||||||
| and the home county | ||||||||||
| of The Pantagraph, Bloomington | ||||||||||
| Circulation area | ||||||||||
| Race/ethnicity | % of population | Number of residents | 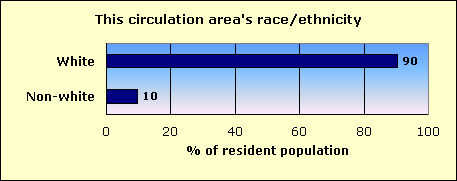
|
|||||||
| Hispanic | 2.4 | 6,974 | ||||||||
| Black | 4.8 | 13,717 | ||||||||
| Asian and Pacific Islander | 1.3 | 3,620 | ||||||||
| Native-American | 0.2 | 435 | ||||||||
| Other non-white | 0.1 | 184 | ||||||||
| Multi-racial | 0.9 | 2,605 | ||||||||
| Non-white | 9.5 | 27,535 | ||||||||
| White | 90.5 | 260,985 | ||||||||
| Total | 288,520 | |||||||||
| Home county: McLean | ||||||||||
| Race/ethnicity | % of population | Number of residents | 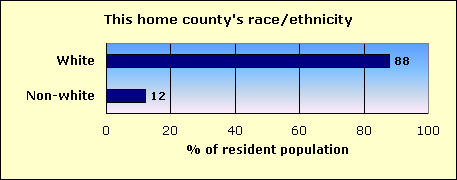
|
|||||||
| Hispanic | 2.6 | 3,833 | ||||||||
| Black | 6.1 | 9,189 | ||||||||
| Asian and Pacific Islander | 2.1 | 3,115 | ||||||||
| Native-American | 0.2 | 224 | ||||||||
| Other non-white | 0.1 | 145 | ||||||||
| Multi-racial | 1.1 | 1,703 | ||||||||
| Non-white | 12.1 | 18,209 | ||||||||
| White | 87.9 | 132,224 | ||||||||
| Total | 150,433 | |||||||||
| The home county of this newspaper is McLean. | ||||||||||
| About this report | ||||||||||
| This third annual report for the Knight Foundation adds context to an annual survey by the American Society of Newspaper Editors. ASNE has set a goal that | ||||||||||
| every newspaper, to help it know its community and gather the news, should employ at least one non-white journalist, and that newspapers should strive to | ||||||||||
| employ non-whites in proportion to their share of the community. ASNE's report, at www.asne.org, shows each newspaper's non-white employment, but does | ||||||||||
| not disclose how closely that employment mirrors the newspaper's circulation area. | ||||||||||
| That gap is filled by the report you are reading now. This report was not done by ASNE, but was done for the Knight Foundation by Bill Dedman and | ||||||||||
| Stephen K. Doig. It shows how close each newspaper is to ASNE's goal, by comparing the newsroom staffing with the circulation area population. | ||||||||||
| The full report is at www.powerreporting.com/knight. | ||||||||||
| Notes and definitions | ||||||||||
| 1. The Newsroom Diversity Index is the non-white percentage of the newsroom staff divided by the non-white percentage of the circulation area's residents. Parity = 100. | ||||||||||
| 2. Source for staffing: Survey by American Society of Newspaper Editors, April 2005. Newspapers report non-white staff as of the end of the previous year. | ||||||||||
| 3. Following ASNE's definition, newsroom staff includes only supervisors, reporters, editors, copy/layout editors and photographers. | ||||||||||
| 4. Also following ASNE's definition, "whites," "blacks," etc., exclude Hispanics, who are counted in a separate category. | ||||||||||
| 5. Source for boundaries of this newspaper's circulation area: ZIP Code circulation data, Audit Bureau of Circulations, latest available. | ||||||||||
| 6. A paper may define its circulation area differently for marketing efforts, or news coverage, or to set advertising rates. | ||||||||||
| 7. If ZIP Codes or counties are used, this report applies a threshold: 10 percent household penetration is required to include an area in the circulation area. | ||||||||||
| 8. Source for the demographics of residents of that circulation area: US Census 2000. | ||||||||||
| 9. Source for total circulation: Editor & Publisher magazine, Monday-Friday average at year-end 2004. | ||||||||||
| 10. Staff of non-English publications, such as the Miami Herald's El Nuevo Herald, are excluded from the ASNE staffing survey for the first time this year. | ||||||||||
| Demographics of ZIP Codes | ||||||||||
| where sales were reported by | ||||||||||
| The Pantagraph, Bloomington | ||||||||||
| Note that some ZIP Codes listed here may not have been included in determining the newspaper's circulation area. In calculating the Diversity Index, a | ||||||||||
| ZIP Code was included only if the household penetration was at least 10 percent. Any lower-penetration ZIP Codes are also listed here for your information. | ||||||||||
| Also, if the newspaper reported more than 300 ZIP Codes, only the top 300 in weekday sales are listed here. | ||||||||||
| ZIP / City / State / Approx. distance in miles from the newspaper's home office | Weekday sales | Households | Penetration % (daily sales per 100 households) | Median household income | Non-white % of population |
Hispanic % of population |
Black % of population |
Native % of population |
Asian % of population |
|
| 61704 / Covell / IL / 8.4 mi. | 10,425 | 13,423 | 77.7 | $65,814 | 13.9 | 2.9 | 5.5 | 0.2 | 4.1 | |
| 61701 / Yuton / IL / 8.3 mi. | 7,811 | 16,223 | 48.1 | $37,783 | 16.9 | 3.7 | 9.8 | 0.2 | 1.5 | |
| 61761 / Normal / IL / 6.2 mi. | 7,062 | 15,108 | 46.7 | $40,313 | 13.8 | 2.6 | 7.6 | 0.1 | 2.2 | |
| 61764 / Vermillion Estat / IL / 24.7 mi. | 1,934 | 5,202 | 37.2 | $40,458 | 13.9 | 3.8 | 8.8 | 0.1 | 0.4 | |
| 61727 / Texas Township / IL / 29.3 mi. | 1,158 | 4,171 | 27.8 | $39,868 | 3.7 | 1.7 | 0.6 | 0.1 | 0.3 | |
| 61739 / Fairbury / IL / 24.8 mi. | 1,046 | 1,822 | 57.4 | $43,239 | 3.9 | 2.4 | 0.3 | 0.0 | 0.4 | |
| 61364 / Streator West / IL / 34.4 mi. | 957 | 8,315 | 11.5 | $35,375 | 8.1 | 5.4 | 1.4 | 0.1 | 0.4 | |
| 61752 / Le Roy / IL / 19.8 mi. | 922 | 1,597 | 57.7 | $48,951 | 1.3 | 1.0 | 0.1 | 0.1 | 0.1 | |
| 62656 / Lincoln / IL / 34.8 mi. | 876 | 7,055 | 12.4 | $37,264 | 13.6 | 2.2 | 9.8 | 0.2 | 0.8 | |
| 61738 / Panola / IL / 8.8 mi. | 805 | 1,608 | 50.1 | $49,596 | 1.7 | 0.7 | 0.2 | 0.2 | 0.2 | |
| 61745 / Randolph / IL / 18.5 mi. | 792 | 1,482 | 53.4 | $56,906 | 2.2 | 0.6 | 0.2 | 0.1 | 0.3 | |
| 61753 / Money Creek / IL / 8.8 mi. | 655 | 1,144 | 57.3 | $48,250 | 1.8 | 0.7 | 0.3 | 0.2 | 0.0 | |
| 61748 / Hudson / IL / 0.4 mi. | 637 | 957 | 66.6 | $61,741 | 1.6 | 0.7 | 0.0 | 0.1 | 0.4 | |
| 60420 / Dwight / IL / 41.5 mi. | 560 | 1,947 | 28.8 | $40,769 | 15.3 | 3.3 | 11.1 | 0.2 | 0.3 | |
| 60936 / Gibson City / IL / 31.3 mi. | 549 | 1,794 | 30.6 | $35,189 | 2.3 | 0.8 | 0.5 | 0.0 | 0.5 | |
| 61726 / Yates / IL / 14.1 mi. | 516 | 1,045 | 49.4 | $44,806 | 3.2 | 1.9 | 0.2 | 0.1 | 0.4 | |
| 61760 / Woodford / IL / 19.3 mi. | 503 | 1,038 | 48.5 | $42,714 | 1.6 | 1.0 | 0.0 | 0.1 | 0.1 | |
| 61732 / Danvers / IL / 10.7 mi. | 423 | 746 | 56.7 | $54,412 | 2.1 | 0.7 | 0.6 | 0.3 | 0.1 | |
| 61744 / Waldo / IL / 10.3 mi. | 415 | 746 | 55.6 | $48,387 | 2.5 | 0.7 | 0.3 | 0.1 | 0.4 | |
| 61723 / Atlanta / IL / 25.4 mi. | 395 | 946 | 41.8 | $43,673 | 1.1 | 0.7 | 0.1 | 0.1 | 0.0 | |
| 61776 / Towanda / IL / 5 mi. | 359 | 504 | 71.2 | $62,171 | 1.8 | 0.7 | 0.5 | 0.0 | 0.3 | |
| 61842 / Farmer City / IL / 28.7 mi. | 347 | 1,147 | 30.3 | $44,051 | 1.4 | 0.7 | 0.2 | 0.0 | 0.0 | |
| 61736 / Holder / IL / 14.5 mi. | 336 | 482 | 69.7 | $57,426 | 1.7 | 0.6 | 0.5 | 0.1 | 0.2 | |
| 61740 / Nebraska Townshi / IL / 18.5 mi. | 331 | 651 | 50.8 | $43,239 | 1.8 | 0.6 | 0.5 | 0.0 | 0.1 | |
| 61728 / Martin / IL / 18.3 mi. | 328 | 554 | 59.2 | $44,250 | 1.6 | 1.0 | 0.0 | 0.4 | 0.1 | |
| 61741 / Wing / IL / 29.5 mi. | 317 | 651 | 48.7 | $46,813 | 3.8 | 2.0 | 0.4 | 0.4 | 0.2 | |
| 61759 / Minier / IL / 19.5 mi. | 306 | 620 | 49.4 | $40,958 | 2.0 | 1.0 | 0.3 | 0.1 | 0.1 | |
| 61725 / Carlock / IL / 7.4 mi. | 291 | 478 | 60.9 | $57,315 | 2.5 | 0.6 | 0.3 | 0.1 | 0.8 | |
| 61530 / Eureka / IL / 15.9 mi. | 279 | 2,152 | 13.0 | $46,639 | 2.8 | 1.0 | 0.5 | 0.3 | 0.4 | |
| 61754 / McLean / IL / 20.9 mi. | 274 | 492 | 55.7 | $50,288 | 1.6 | 0.0 | 0.5 | 0.2 | 0.6 | |
| 61755 / Mackinaw / IL / 18 mi. | 256 | 1,472 | 17.4 | $53,260 | 3.1 | 0.9 | 0.5 | 0.1 | 0.4 | |
| 60921 / Chatsworth / IL / 35.2 mi. | 252 | 668 | 37.7 | $33,510 | 3.0 | 1.9 | 0.4 | 0.2 | 0.1 | |
| 61770 / Saybrook / IL / 25.2 mi. | 232 | 464 | 50.0 | $41,042 | 1.2 | 0.4 | 0.3 | 0.0 | 0.1 | |
| 60460 / Odell / IL / 34.2 mi. | 200 | 595 | 33.6 | $40,250 | 2.6 | 1.1 | 0.3 | 0.1 | 0.3 | |
| 61774 / Stanford / IL / 16 mi. | 195 | 386 | 50.5 | $48,125 | 2.7 | 1.0 | 0.0 | 0.6 | 0.1 | |
| 61777 / Wapella / IL / 24.8 mi. | 188 | 398 | 47.2 | $44,519 | 2.0 | 1.1 | 0.2 | 0.3 | 0.1 | |
| 61561 / Roanoke / IL / 16.3 mi. | 170 | 1,026 | 16.6 | $45,982 | 0.9 | 0.1 | 0.1 | 0.1 | 0.0 | |
| 60959 / Piper City / IL / 40.1 mi. | 148 | 400 | 37.0 | $37,692 | 3.0 | 1.1 | 0.1 | 0.3 | 0.7 | |
| 61377 / Wenona / IL / 29 mi. | 146 | 568 | 25.7 | $37,647 | 2.9 | 1.2 | 0.3 | 0.3 | 0.1 | |
| 61747 / Hopedale / IL / 24.1 mi. | 128 | 510 | 25.1 | $47,738 | 0.9 | 0.1 | 0.1 | 0.4 | 0.1 | |
| 61737 / Padua / IL / 16.6 mi. | 126 | 198 | 63.6 | $53,802 | 5.2 | 0.7 | 0.9 | 1.4 | 0.4 | |
| 61729 / Congerville / IL / 10.9 mi. | 119 | 375 | 31.7 | $51,094 | 2.5 | 0.2 | 0.0 | 0.3 | 0.3 | |
| 61319 / Manville / IL / 27.7 mi. | 115 | 441 | 26.1 | $47,292 | 2.6 | 1.0 | 0.4 | 0.9 | 0.0 | |
| 60929 / Cullom / IL / 39.2 mi. | 114 | 326 | 35.0 | $33,438 | 1.4 | 0.3 | 0.5 | 0.1 | 0.1 | |
| 60957 / Paxton / IL / 44.7 mi. | 113 | 2,190 | 5.2 | $38,381 | 2.6 | 1.4 | 0.2 | 0.1 | 0.3 | |
| 61771 / Secor / IL / 11.4 mi. | 111 | 212 | 52.4 | $43,824 | 0.7 | 0.0 | 0.2 | 0.0 | 0.2 | |
| 61722 / West / IL / 20 mi. | 107 | 213 | 50.2 | $52,188 | 4.4 | 0.5 | 3.3 | 0.2 | 0.2 | |
| 61778 / Waynesville / IL / 24.5 mi. | 104 | 274 | 38.0 | $40,536 | 1.4 | 0.4 | 0.4 | 0.0 | 0.0 | |
| 61721 / Hittle / IL / 23.4 mi. | 100 | 254 | 39.4 | $43,929 | 2.1 | 1.4 | 0.0 | 0.0 | 0.3 | |
| 61550 / Ossami Lake / IL / 23.5 mi. | 99 | 6,711 | 1.5 | $54,353 | 2.5 | 0.8 | 0.1 | 0.1 | 1.1 | |
| 61369 / Toluca / IL / 26.7 mi. | 98 | 706 | 13.9 | $39,205 | 2.8 | 1.8 | 0.1 | 0.1 | 0.3 | |
| 61615 / Peoria / IL / 33.7 mi. | 91 | 7,707 | 1.2 | $51,548 | 17.5 | 1.7 | 10.4 | 0.1 | 3.8 | |
| 61742 / Goodfield / IL / 14.4 mi. | 86 | 305 | 28.2 | $61,111 | 0.4 | 0.0 | 0.1 | 0.0 | 0.1 | |
| 61772 / Shirley / IL / 13.1 mi. | 82 | 150 | 54.7 | $67,917 | 2.6 | 1.0 | 0.0 | 0.3 | 1.0 | |
| 62635 / Emden / IL / 31.6 mi. | 81 | 264 | 30.7 | $36,905 | 1.5 | 0.8 | 0.0 | 0.2 | 0.0 | |
| 61730 / Cooksville / IL / 12.7 mi. | 77 | 164 | 47.0 | $50,074 | 0.5 | 0.3 | 0.0 | 0.0 | 0.0 | |
| 61358 / Rutland / IL / 24.5 mi. | 75 | 208 | 36.1 | $33,182 | 1.7 | 0.2 | 0.2 | 0.8 | 0.2 | |
| 61734 / Delavan / IL / 31.3 mi. | 74 | 1,137 | 6.5 | $45,737 | 1.8 | 0.3 | 0.4 | 0.0 | 0.2 | |
| 61773 / Sibley / IL / 29.6 mi. | 71 | 207 | 34.3 | $41,818 | 3.3 | 2.9 | 0.0 | 0.2 | 0.0 | |
| 61769 / Scovel / IL / 33.7 mi. | 70 | 225 | 31.1 | $47,727 | 1.9 | 1.4 | 0.2 | 0.0 | 0.0 | |
| 60962 / Roberts / IL / 39.3 mi. | 69 | 246 | 28.0 | $41,635 | 1.7 | 0.9 | 0.0 | 0.7 | 0.0 | |
| 61516 / Benson / IL / 17.1 mi. | 69 | 270 | 25.6 | $50,694 | 1.3 | 0.9 | 0.0 | 0.0 | 0.1 | |
| 61724 / Kumler / IL / 28.6 mi. | 65 | 235 | 27.7 | $44,583 | 1.9 | 0.0 | 1.3 | 0.0 | 0.2 | |
| 61568 / Tremont / IL / 25.2 mi. | 61 | 1,500 | 4.1 | $55,806 | 1.6 | 0.8 | 0.1 | 0.2 | 0.3 | |
| 60952 / Melvin / IL / 36.1 mi. | 60 | 278 | 21.6 | $45,982 | 1.9 | 1.2 | 0.0 | 0.3 | 0.0 | |
| 61735 / Dewitt / IL / 28.7 mi. | 60 | 166 | 36.1 | $45,972 | 4.2 | 0.5 | 0.3 | 0.7 | 0.5 | |
| 61720 / Anchor / IL / 23.4 mi. | 59 | 119 | 49.6 | $50,089 | 2.5 | 0.0 | 0.0 | 0.3 | 0.0 | |
| 60938 / Gilman / IL / 49.7 mi. | 56 | 881 | 6.4 | $35,898 | 9.1 | 8.1 | 0.3 | 0.0 | 0.3 | |
| 61853 / Mahomet / IL / 39.2 mi. | 56 | 3,672 | 1.5 | $55,000 | 2.8 | 0.9 | 0.4 | 0.2 | 0.6 | |
| 61820 / Champaign / IL / 48.2 mi. | 50 | 12,638 | 0.4 | $19,591 | 32.9 | 5.5 | 16.0 | 0.2 | 9.1 | |
| 61333 / Long Point / IL / 26 mi. | 48 | 159 | 30.2 | $46,250 | 1.8 | 0.0 | 0.0 | 1.2 | 0.2 | |
| 61731 / Cropsey / IL / 23 mi. | 45 | 84 | 53.6 | $42,625 | 7.5 | 3.5 | 2.4 | 0.0 | 0.0 | |
| 61775 / Strawn / IL / 28.8 mi. | 45 | 110 | 40.9 | $42,679 | 5.8 | 0.3 | 2.9 | 0.0 | 0.3 | |
| 62664 / Teheran / IL / 43.6 mi. | 44 | 1,337 | 3.3 | $37,574 | 1.2 | 0.7 | 0.1 | 0.1 | 0.2 | |
| 61749 / Tunbridge / IL / 33.3 mi. | 43 | 267 | 16.1 | $39,432 | 1.7 | 0.9 | 0.5 | 0.0 | 0.3 | |
| 62643 / Hartsburg / IL / 31.9 mi. | 42 | 161 | 26.1 | $39,000 | 0.2 | 0.0 | 0.0 | 0.2 | 0.0 | |
| 61743 / Graymont / IL / 22.6 mi. | 41 | 96 | 42.7 | $41,250 | 1.9 | 1.1 | 0.0 | 0.0 | 0.4 | |
| 62548 / Mount Pulaski / IL / 41.1 mi. | 39 | 959 | 4.1 | $40,361 | 0.8 | 0.3 | 0.0 | 0.0 | 0.1 | |
| 62521 / Decatur / IL / 50.4 mi. | 38 | 15,265 | 0.2 | $39,449 | 18.5 | 0.9 | 15.5 | 0.2 | 0.6 | |
| 61882 / Weldon / IL / 33.1 mi. | 37 | 278 | 13.3 | $44,000 | 2.9 | 0.2 | 0.0 | 1.0 | 0.4 | |
| 61321 / Dana / IL / 24 mi. | 36 | 125 | 28.8 | $37,955 | 2.9 | 2.6 | 0.0 | 0.0 | 0.3 | |
| 62512 / Beason / IL / 31.8 mi. | 35 | 193 | 18.1 | $57,875 | 1.1 | 0.9 | 0.0 | 0.0 | 0.0 | |
| 62703 / Springfield / IL / 62.5 mi. | 35 | 12,887 | 0.3 | $31,844 | 37.0 | 1.2 | 32.6 | 0.3 | 0.9 | |
| 60924 / Cissna Park / IL / 53.4 mi. | 33 | 686 | 4.8 | $38,029 | 2.0 | 1.1 | 0.2 | 0.1 | 0.4 | |
| 60934 / Emington / IL / 38.6 mi. | 33 | 118 | 28.0 | $33,500 | 1.0 | 0.0 | 0.0 | 0.0 | 0.3 | |
| 61571 / Washington / IL / 23.4 mi. | 33 | 7,971 | 0.4 | $50,553 | 2.1 | 0.6 | 0.3 | 0.1 | 0.5 | |
| 61854 / Mansfield / IL / 34.6 mi. | 32 | 635 | 5.0 | $46,250 | 1.7 | 0.5 | 0.2 | 0.0 | 0.3 | |
| 60955 / Onarga / IL / 48.9 mi. | 31 | 677 | 4.6 | $38,438 | 29.4 | 26.6 | 1.7 | 0.2 | 0.2 | |
| 60424 / Gardner / IL / 48.6 mi. | 30 | 901 | 3.3 | $42,689 | 4.0 | 2.7 | 0.1 | 0.1 | 0.4 | |
| 61843 / Fisher / IL / 36.3 mi. | 29 | 787 | 3.7 | $44,414 | 1.5 | 0.2 | 0.1 | 0.2 | 0.0 | |
| 60968 / Thawville / IL / 42.8 mi. | 28 | 180 | 15.6 | $43,438 | 5.5 | 5.1 | 0.0 | 0.0 | 0.2 | |
| 61733 / Deer Creek / IL / 16.9 mi. | 28 | 371 | 7.5 | $51,477 | 2.2 | 0.2 | 0.3 | 0.0 | 0.5 | |
| 60933 / Elliott / IL / 36 mi. | 24 | 130 | 18.5 | $41,750 | 1.7 | 0.3 | 0.0 | 0.0 | 0.0 | |
| 62682 / San Jose / IL / 36.2 mi. | 24 | 373 | 6.4 | $39,231 | 2.4 | 1.0 | 0.3 | 0.3 | 0.6 | |
| 61570 / Wilbern / IL / 25.1 mi. | 19 | 667 | 2.8 | $44,792 | 2.8 | 1.0 | 0.4 | 0.1 | 0.2 | |
| 61301 / Tomahawk Bluff / IL / 48.5 mi. | 3 | 4,435 | 0.1 | $33,333 | 10.5 | 7.8 | 1.2 | 0.1 | 0.5 | |
| File | il_the_pantagraph__bloomington | |||||||||
| Time | 5/19/05 4:45 PM | |||||||||
| Page | 223 | |||||||||
| Member | 110300 | |||||||||