
|
| Comparing the racial diversity of the journalists | ||||||||||
| at America's daily newspapers | ||||||||||
| with the communities that they serve | ||||||||||
| Newsroom diversity report for | ||||||||||
| Rockford Register Star | ||||||||||
| Rockford, Illinois | ||||||||||
| Owner: Gannett Co. (Va.) | ||||||||||
| From a report for the Knight Foundation | ||||||||||
| by Bill Dedman and Stephen K. Doig, June 2005 | ||||||||||
| Click here to read the national report or to select another newspaper | ||||||||||
| Year | Non-white % of newsroom staff | 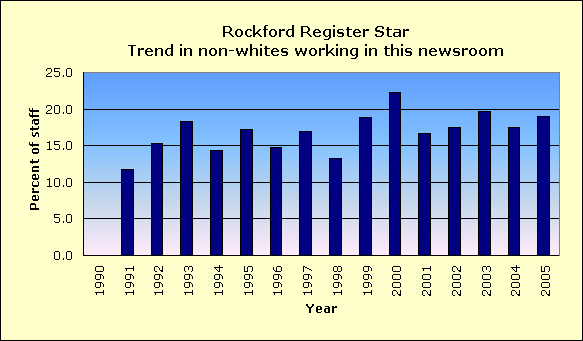
|
||||||||
| 2005 | 19.0 | |||||||||
| 2004 | 17.5 | |||||||||
| 2003 | 19.7 | |||||||||
| 2002 | 17.5 | |||||||||
| 2001 | 16.7 | |||||||||
| 2000 | 22.2 | |||||||||
| 1999 | 18.8 | |||||||||
| 1998 | 13.2 | |||||||||
| 1997 | 16.9 | |||||||||
| 1996 | 14.7 | |||||||||
| 1995 | 17.2 | |||||||||
| 1994 | 14.3 | |||||||||
| 1993 | 18.3 | |||||||||
| 1992 | 15.3 | |||||||||
| 1991 | 11.8 | |||||||||
| 1990 | Did not report | |||||||||
| The latest year at peak is | 2000 | |||||||||
| See the notes and definitions section below for the sources of these figures. | ||||||||||
| Newsroom Diversity Index | ||||||||||
| for Rockford Register Star | ||||||||||
 |
||||||||||
| Year | Non-white % of newsroom staff | Non-white % of circulation area | Newsroom Diversity Index (parity=100) | |||||||
| 2005 | 19.0 | 19.7 | 97 | |||||||
| 2004 | 17.5 | 19.7 | 89 | |||||||
| How the index is calculated | ||||||||||
| The Newsroom Diversity Index is the non-white percentage of the newsroom staff | ||||||||||
| divided by the non-white percentage of residents in the circulation area. | ||||||||||
| (Parity = 100.) | ||||||||||
| Company index | ||||||||||
| This newspaper's owner, Gannett Co. (Va.), | ||||||||||
| has a companywide, circulation-weighted Diversity Index of 89. | ||||||||||
| See the notes and definitions section below for the sources of these figures. | ||||||||||
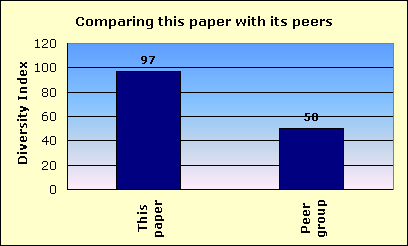
| Peer group comparison | ||||||||||
| for Rockford Register Star | ||||||||||
 |
||||||||||
| This newspaper's Newsroom Diversity Index is 97. | This paper | |||||||||
| Peer group | ||||||||||
| Compare that with 50, which is the median Diversity Index for all newspapers | ||||||||||
| reporting in this circulation category of 50,001 to 100,000 daily sales. | ||||||||||
| In that group, this newspaper's Diversity Index ranks 14 out of 90 | ||||||||||
| newspapers reporting in the category of 50,001 to 100,000 daily sales. | ||||||||||
| FYI, in circulation, this newspaper's average weekday circulation of | ||||||||||
| approximately 64,518 ranks 158 out of 1,410 daily newspapers in the US. | ||||||||||
| See the notes and definitions section below for the sources of these figures. | ||||||||||
| Details on race/ethnicity | ||||||||||
| in the circulation area | ||||||||||
| and the home county | ||||||||||
| of Rockford Register Star | ||||||||||
| Circulation area | ||||||||||
| Race/ethnicity | % of population | Number of residents | 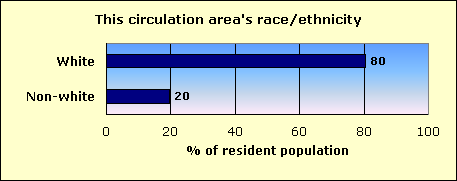
|
|||||||
| Hispanic | 7.5 | 24,490 | ||||||||
| Black | 9.0 | 29,400 | ||||||||
| Asian and Pacific Islander | 1.6 | 5,037 | ||||||||
| Native-American | 0.2 | 682 | ||||||||
| Other non-white | 0.1 | 230 | ||||||||
| Multi-racial | 1.3 | 4,202 | ||||||||
| Non-white | 19.7 | 64,041 | ||||||||
| White | 80.3 | 261,780 | ||||||||
| Total | 325,821 | |||||||||
| Home county: Winnebago | ||||||||||
| Race/ethnicity | % of population | Number of residents | 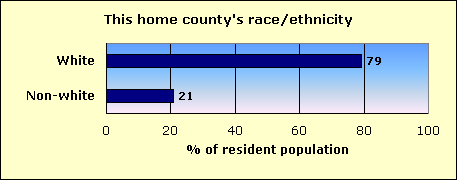
|
|||||||
| Hispanic | 6.9 | 19,206 | ||||||||
| Black | 10.4 | 29,038 | ||||||||
| Asian and Pacific Islander | 1.7 | 4,795 | ||||||||
| Native-American | 0.2 | 584 | ||||||||
| Other non-white | 0.1 | 216 | ||||||||
| Multi-racial | 1.4 | 3,762 | ||||||||
| Non-white | 20.7 | 57,601 | ||||||||
| White | 79.3 | 220,817 | ||||||||
| Total | 278,418 | |||||||||
| The home county of this newspaper is Winnebago. | ||||||||||
| About this report | ||||||||||
| This third annual report for the Knight Foundation adds context to an annual survey by the American Society of Newspaper Editors. ASNE has set a goal that | ||||||||||
| every newspaper, to help it know its community and gather the news, should employ at least one non-white journalist, and that newspapers should strive to | ||||||||||
| employ non-whites in proportion to their share of the community. ASNE's report, at www.asne.org, shows each newspaper's non-white employment, but does | ||||||||||
| not disclose how closely that employment mirrors the newspaper's circulation area. | ||||||||||
| That gap is filled by the report you are reading now. This report was not done by ASNE, but was done for the Knight Foundation by Bill Dedman and | ||||||||||
| Stephen K. Doig. It shows how close each newspaper is to ASNE's goal, by comparing the newsroom staffing with the circulation area population. | ||||||||||
| The full report is at www.powerreporting.com/knight. | ||||||||||
| Notes and definitions | ||||||||||
| 1. The Newsroom Diversity Index is the non-white percentage of the newsroom staff divided by the non-white percentage of the circulation area's residents. Parity = 100. | ||||||||||
| 2. Source for staffing: Survey by American Society of Newspaper Editors, April 2005. Newspapers report non-white staff as of the end of the previous year. | ||||||||||
| 3. Following ASNE's definition, newsroom staff includes only supervisors, reporters, editors, copy/layout editors and photographers. | ||||||||||
| 4. Also following ASNE's definition, "whites," "blacks," etc., exclude Hispanics, who are counted in a separate category. | ||||||||||
| 5. Source for boundaries of this newspaper's circulation area: ZIP Code circulation data, Audit Bureau of Circulations, latest available. | ||||||||||
| 6. A paper may define its circulation area differently for marketing efforts, or news coverage, or to set advertising rates. | ||||||||||
| 7. If ZIP Codes or counties are used, this report applies a threshold: 10 percent household penetration is required to include an area in the circulation area. | ||||||||||
| 8. Source for the demographics of residents of that circulation area: US Census 2000. | ||||||||||
| 9. Source for total circulation: Editor & Publisher magazine, Monday-Friday average at year-end 2004. | ||||||||||
| 10. Staff of non-English publications, such as the Miami Herald's El Nuevo Herald, are excluded from the ASNE staffing survey for the first time this year. | ||||||||||
| Demographics of ZIP Codes | ||||||||||
| where sales were reported by | ||||||||||
| Rockford Register Star | ||||||||||
| Note that some ZIP Codes listed here may not have been included in determining the newspaper's circulation area. In calculating the Diversity Index, a | ||||||||||
| ZIP Code was included only if the household penetration was at least 10 percent. Any lower-penetration ZIP Codes are also listed here for your information. | ||||||||||
| Also, if the newspaper reported more than 300 ZIP Codes, only the top 300 in weekday sales are listed here. | ||||||||||
| ZIP / City / State / Approx. distance in miles from the newspaper's home office | Weekday sales | Households | Penetration % (daily sales per 100 households) | Median household income | Non-white % of population |
Hispanic % of population |
Black % of population |
Native % of population |
Asian % of population |
|
| 61107 / Rockford / IL / 3.2 mi. | 6,054 | 12,298 | 49.2 | $49,068 | 13.5 | 5.7 | 4.3 | 0.1 | 2.3 | |
| 61108 / Rockford / IL / 2.6 mi. | 6,010 | 11,375 | 52.8 | $44,798 | 15.5 | 6.6 | 5.3 | 0.2 | 2.3 | |
| 61109 / Rockford / IL / 3 mi. | 4,736 | 10,630 | 44.6 | $41,954 | 20.1 | 7.4 | 7.9 | 0.2 | 3.0 | |
| 61103 / Rockford / IL / 3 mi. | 4,574 | 10,233 | 44.7 | $37,181 | 22.9 | 6.3 | 13.7 | 0.2 | 0.8 | |
| 61008 / Belvidere / IL / 11 mi. | 4,062 | 10,115 | 40.2 | $49,637 | 18.2 | 15.7 | 0.9 | 0.2 | 0.5 | |
| 61111 / Loves Park / IL / 5.3 mi. | 4,029 | 8,382 | 48.1 | $45,484 | 8.8 | 3.2 | 2.3 | 0.2 | 1.8 | |
| 61114 / Rockford / IL / 4.7 mi. | 3,746 | 6,018 | 62.2 | $67,605 | 12.4 | 2.7 | 4.6 | 0.1 | 3.7 | |
| 61115 / Machesney Park / IL / 6.8 mi. | 3,278 | 7,597 | 43.1 | $48,182 | 6.4 | 2.8 | 1.4 | 0.2 | 1.0 | |
| 61101 / Rockford / IL / 3.6 mi. | 3,180 | 8,188 | 38.8 | $31,769 | 47.0 | 9.1 | 35.1 | 0.3 | 0.3 | |
| 61102 / Rockford / IL / 2.3 mi. | 2,833 | 6,887 | 41.1 | $34,053 | 59.3 | 19.0 | 38.0 | 0.4 | 0.3 | |
| 61073 / The Ledges / IL / 11.7 mi. | 2,659 | 5,488 | 48.5 | $67,597 | 4.8 | 1.9 | 1.1 | 0.1 | 0.9 | |
| 61104 / Rockford / IL / 0 mi. | 2,622 | 8,407 | 31.2 | $27,046 | 36.7 | 16.1 | 13.8 | 0.3 | 4.1 | |
| 61072 / Rockton / IL / 12.6 mi. | 1,487 | 3,109 | 47.8 | $57,951 | 3.6 | 1.5 | 0.6 | 0.2 | 0.6 | |
| 61010 / Byron / IL / 12 mi. | 1,183 | 2,474 | 47.8 | $56,994 | 2.9 | 1.0 | 0.3 | 0.2 | 0.5 | |
| 61088 / Winnebago / IL / 8.1 mi. | 1,045 | 1,669 | 62.6 | $64,063 | 3.3 | 1.5 | 1.0 | 0.0 | 0.3 | |
| 61080 / South Beloit / IL / 14.9 mi. | 863 | 3,466 | 24.9 | $41,875 | 12.8 | 6.9 | 3.4 | 0.4 | 0.8 | |
| 61016 / Perryville / IL / 6 mi. | 810 | 1,466 | 55.3 | $67,348 | 5.9 | 2.4 | 0.8 | 0.1 | 1.7 | |
| 61065 / Poplar Grove / IL / 13.8 mi. | 660 | 2,275 | 29.0 | $58,443 | 8.3 | 5.6 | 1.1 | 0.2 | 0.4 | |
| 61063 / Pecatonica / IL / 12.4 mi. | 658 | 1,555 | 42.3 | $50,072 | 1.9 | 0.7 | 0.2 | 0.1 | 0.1 | |
| 61011 / Caledonia / IL / 12.4 mi. | 501 | 709 | 70.7 | $70,489 | 2.5 | 1.4 | 0.2 | 0.1 | 0.5 | |
| 61024 / Durand / IL / 16.2 mi. | 414 | 945 | 43.8 | $50,938 | 3.6 | 1.7 | 1.0 | 0.3 | 0.1 | |
| 61112 / Rockford / IL / 5.1 mi. | 263 | 1 | 26300.0 | $23,750 | 66.7 | 66.7 | 0.0 | 0.0 | 0.0 | |
| 61038 / Garden Prairie / IL / 16.4 mi. | 189 | 487 | 38.8 | $52,833 | 7.4 | 5.5 | 0.5 | 0.2 | 0.7 | |
| 61012 / Capron / IL / 18.5 mi. | 139 | 666 | 20.9 | $51,917 | 15.4 | 13.2 | 0.5 | 0.7 | 0.3 | |
| File | il_rockford_register_star | |||||||||
| Time | 5/20/05 3:07 PM | |||||||||
| Page | 158 | |||||||||
| Member | 112500 | |||||||||