
|
| Comparing the racial diversity of the journalists | ||||||||||
| at America's daily newspapers | ||||||||||
| with the communities that they serve | ||||||||||
| Newsroom diversity report for | ||||||||||
| Kane County Chronicle, Geneva | ||||||||||
| Geneva, Illinois | ||||||||||
| From a report for the Knight Foundation | ||||||||||
| by Bill Dedman and Stephen K. Doig, June 2005 | ||||||||||
| Click here to read the national report or to select another newspaper | ||||||||||
| Year | Non-white % of newsroom staff | 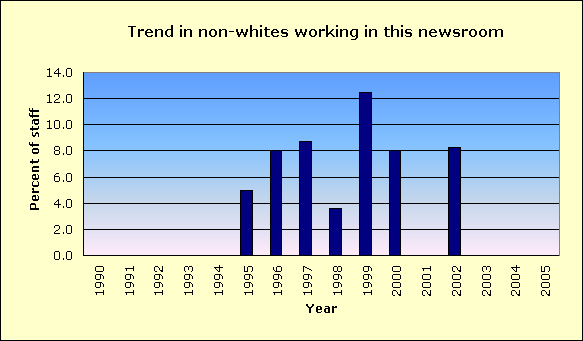
|
||||||||
| 2005 | 0.0 | |||||||||
| 2004 | 0.0 | |||||||||
| 2003 | Did not report | |||||||||
| 2002 | 8.3 | |||||||||
| 2001 | 0.0 | |||||||||
| 2000 | 8.0 | |||||||||
| 1999 | 12.5 | |||||||||
| 1998 | 3.6 | |||||||||
| 1997 | 8.7 | |||||||||
| 1996 | 8.0 | |||||||||
| 1995 | 5.0 | |||||||||
| 1994 | 0.0 | |||||||||
| 1993 | 0.0 | |||||||||
| 1992 | Did not report | |||||||||
| 1991 | Did not report | |||||||||
| 1990 | Did not report | |||||||||
| The latest year at peak is | 1999 | |||||||||
| See the notes and definitions section below for the sources of these figures. | ||||||||||
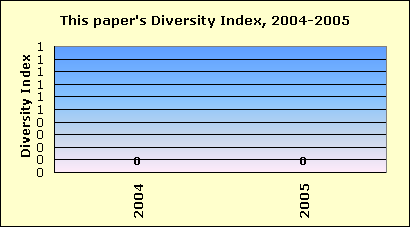
| Newsroom Diversity Index | ||||||||||
| for Kane County Chronicle, Geneva | ||||||||||
 |
||||||||||
| Year | Non-white % of newsroom staff | Non-white % of circulation area | Newsroom Diversity Index (parity=100) | |||||||
| 2005 | 0.0 | 8.5 | 0 | |||||||
| 2004 | 0.0 | 9.8 | 0 | |||||||
| How the index is calculated | ||||||||||
| The Newsroom Diversity Index is the non-white percentage of the newsroom staff | ||||||||||
| divided by the non-white percentage of residents in the circulation area. | ||||||||||
| (Parity = 100.) | ||||||||||
| See the notes and definitions section below for the sources of these figures. | ||||||||||
| Peer group comparison | ||||||||||
| for Kane County Chronicle, Geneva | ||||||||||
 |
||||||||||
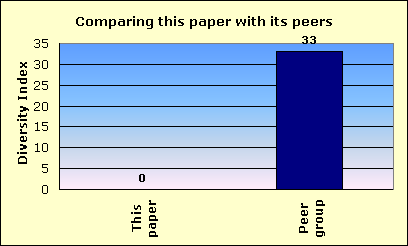
| This newspaper's Newsroom Diversity Index is 0. | This paper | |||||||||
| Peer group | ||||||||||
| Compare that with 33, which is the median Diversity Index for all newspapers | ||||||||||
| reporting in this circulation category of 10,001 to 25,000 daily sales. | ||||||||||
| In that group, this newspaper's Diversity Index ranks 159 out of 259 | ||||||||||
| newspapers reporting in the category of 10,001 to 25,000 daily sales. | ||||||||||
| An example of a newspaper of similar circulation, in an area of similar level of non-white residents, but one that has a relatively high Diversity Index, is The Herald, Sharon, Pennsylvania, with a 8 percent non-white staff in a community that is 7.3 percent non-white. Its index is 110. | ||||||||||
| FYI, in circulation, this newspaper's average weekday circulation of | ||||||||||
| approximately 14,753 ranks 617 out of 1,410 daily newspapers in the US. | ||||||||||
| See the notes and definitions section below for the sources of these figures. | ||||||||||
| Details on race/ethnicity | ||||||||||
| in the circulation area | ||||||||||
| and the home county | ||||||||||
| of Kane County Chronicle, Geneva | ||||||||||
| Circulation area | ||||||||||
| Race/ethnicity | % of population | Number of residents | 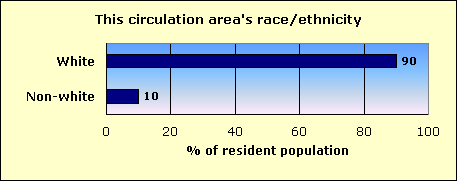
|
|||||||
| Hispanic | 5.2 | 7,405 | ||||||||
| Black | 1.8 | 2,578 | ||||||||
| Asian and Pacific Islander | 1.9 | 2,667 | ||||||||
| Native-American | 0.1 | 145 | ||||||||
| Other non-white | 0.1 | 88 | ||||||||
| Multi-racial | 0.8 | 1,113 | ||||||||
| Non-white | 9.8 | 13,996 | ||||||||
| White | 90.2 | 128,407 | ||||||||
| Total | 142,403 | |||||||||
| Home county: Kane | ||||||||||
| Race/ethnicity | % of population | Number of residents | 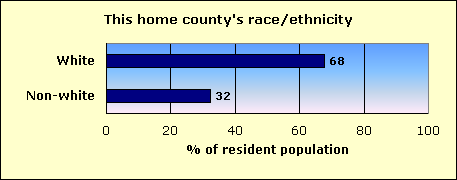
|
|||||||
| Hispanic | 23.7 | 95,924 | ||||||||
| Black | 5.6 | 22,477 | ||||||||
| Asian and Pacific Islander | 1.8 | 7,199 | ||||||||
| Native-American | 0.1 | 536 | ||||||||
| Other non-white | 0.1 | 338 | ||||||||
| Multi-racial | 1.1 | 4,255 | ||||||||
| Non-white | 32.4 | 130,729 | ||||||||
| White | 67.7 | 273,390 | ||||||||
| Total | 404,119 | |||||||||
| The home county of this newspaper is Kane. | ||||||||||
| About this report | ||||||||||
| This third annual report for the Knight Foundation adds context to an annual survey by the American Society of Newspaper Editors. ASNE has set a goal that | ||||||||||
| every newspaper, to help it know its community and gather the news, should employ at least one non-white journalist, and that newspapers should strive to | ||||||||||
| employ non-whites in proportion to their share of the community. ASNE's report, at www.asne.org, shows each newspaper's non-white employment, but does | ||||||||||
| not disclose how closely that employment mirrors the newspaper's circulation area. | ||||||||||
| That gap is filled by the report you are reading now. This report was not done by ASNE, but was done for the Knight Foundation by Bill Dedman and | ||||||||||
| Stephen K. Doig. It shows how close each newspaper is to ASNE's goal, by comparing the newsroom staffing with the circulation area population. | ||||||||||
| The full report is at www.powerreporting.com/knight. | ||||||||||
| Notes and definitions | ||||||||||
| 1. The Newsroom Diversity Index is the non-white percentage of the newsroom staff divided by the non-white percentage of the circulation area's residents. Parity = 100. | ||||||||||
| 2. Source for staffing: Survey by American Society of Newspaper Editors, April 2005. Newspapers report non-white staff as of the end of the previous year. | ||||||||||
| 3. Following ASNE's definition, newsroom staff includes only supervisors, reporters, editors, copy/layout editors and photographers. | ||||||||||
| 4. Also following ASNE's definition, "whites," "blacks," etc., exclude Hispanics, who are counted in a separate category. | ||||||||||
| 5. Source for boundaries of this newspaper's circulation area: ZIP Code circulation data, Audit Bureau of Circulations, latest available. | ||||||||||
| 6. A paper may define its circulation area differently for marketing efforts, or news coverage, or to set advertising rates. | ||||||||||
| 7. If ZIP Codes or counties are used, this report applies a threshold: 10 percent household penetration is required to include an area in the circulation area. | ||||||||||
| 8. Source for the demographics of residents of that circulation area: US Census 2000. | ||||||||||
| 9. Source for total circulation: Editor & Publisher magazine, Monday-Friday average at year-end 2004. | ||||||||||
| 10. Staff of non-English publications, such as the Miami Herald's El Nuevo Herald, are excluded from the ASNE staffing survey for the first time this year. | ||||||||||
| Demographics of ZIP Codes | ||||||||||
| where sales were reported by | ||||||||||
| Kane County Chronicle, Geneva | ||||||||||
| Note that some ZIP Codes listed here may not have been included in determining the newspaper's circulation area. In calculating the Diversity Index, a | ||||||||||
| ZIP Code was included only if the household penetration was at least 10 percent. Any lower-penetration ZIP Codes are also listed here for your information. | ||||||||||
| Also, if the newspaper reported more than 300 ZIP Codes, only the top 300 in weekday sales are listed here. | ||||||||||
| ZIP / City / State / Approx. distance in miles from the newspaper's home office | Weekday sales | Households | Penetration % (daily sales per 100 households) | Median household income | Non-white % of population |
Hispanic % of population |
Black % of population |
Native % of population |
Asian % of population |
|
| 60174 / Valley View / IL / 2.3 mi. | 3,211 | 11,583 | 27.7 | $67,608 | 10.2 | 5.8 | 2.0 | 0.1 | 1.7 | |
| 60134 / Geneva / IL / 0 mi. | 3,037 | 7,233 | 42.0 | $80,542 | 6.2 | 3.0 | 1.3 | 0.0 | 1.3 | |
| 60510 / Batavia / IL / 2.6 mi. | 2,648 | 9,414 | 28.1 | $70,225 | 9.6 | 5.1 | 2.2 | 0.1 | 1.4 | |
| 60175 / Saint Charles / IL / 4.6 mi. | 1,852 | 5,479 | 33.8 | $105,858 | 4.3 | 1.6 | 0.7 | 0.1 | 1.4 | |
| 60119 / Elburn / IL / 8.5 mi. | 832 | 2,692 | 30.9 | $79,159 | 4.1 | 2.4 | 0.1 | 0.2 | 0.6 | |
| 60542 / North Aurora / IL / 5.1 mi. | 758 | 4,166 | 18.2 | $59,820 | 17.7 | 9.5 | 4.3 | 0.2 | 2.5 | |
| 60177 / South Elgin / IL / 7 mi. | 503 | 5,871 | 8.6 | $67,163 | 19.8 | 10.4 | 2.5 | 0.1 | 5.3 | |
| 60151 / Virgil / IL / 13.6 mi. | 298 | 1,231 | 24.2 | $63,447 | 3.5 | 1.9 | 0.3 | 0.2 | 0.4 | |
| 60554 / Sugar Grove / IL / 10.4 mi. | 235 | 1,592 | 14.8 | $72,991 | 7.4 | 4.7 | 1.3 | 0.0 | 0.5 | |
| 60185 / West Chicago / IL / 5.3 mi. | 203 | 9,504 | 2.1 | $66,953 | 42.1 | 37.8 | 1.3 | 0.1 | 1.9 | |
| 60109 / Burlington / IL / 15 mi. | 191 | 64 | 298.4 | $52,500 | 5.1 | 1.9 | 0.0 | 0.0 | 0.0 | |
| 60123 / Elgin / IL / 10 mi. | 172 | 19,274 | 0.9 | $57,928 | 30.1 | 19.9 | 5.6 | 0.1 | 3.0 | |
| 60505 / Aurora / IL / 8.3 mi. | 110 | 16,204 | 0.7 | $40,475 | 72.7 | 60.9 | 10.1 | 0.2 | 0.7 | |
| 60504 / Aurora / IL / 9.1 mi. | 81 | 15,941 | 0.5 | $76,185 | 23.6 | 7.4 | 7.4 | 0.1 | 6.8 | |
| 60184 / Wayne / IL / 5.5 mi. | 60 | 251 | 23.9 | $93,785 | 6.6 | 2.9 | 0.6 | 0.0 | 1.9 | |
| 60178 / Sycamore / IL / 19.4 mi. | 51 | 6,259 | 0.8 | $54,867 | 8.1 | 4.0 | 2.2 | 0.2 | 0.7 | |
| 60506 / Aurora / IL / 8.2 mi. | 48 | 17,654 | 0.3 | $50,743 | 39.7 | 23.7 | 13.0 | 0.1 | 1.3 | |
| 60140 / Pingree Grove / IL / 16.7 mi. | 33 | 2,497 | 1.3 | $63,380 | 4.5 | 3.4 | 0.1 | 0.1 | 0.3 | |
| 60120 / Elgin / IL / 9.9 mi. | 26 | 15,403 | 0.2 | $52,067 | 57.0 | 44.9 | 6.4 | 0.2 | 4.2 | |
| File | il_kane_county_chronicle__geneva | |||||||||
| Time | 5/21/05 5:20 PM | |||||||||
| Page | 616 | |||||||||
| Member | 111600 | |||||||||