
|
| Comparing the racial diversity of the journalists | ||||||||||
| at America's daily newspapers | ||||||||||
| with the communities that they serve | ||||||||||
| Newsroom diversity report for | ||||||||||
| Daily Herald, Arlington Heights | ||||||||||
| Arlington Heights, Illinois | ||||||||||
| From a report for the Knight Foundation | ||||||||||
| by Bill Dedman and Stephen K. Doig, June 2005 | ||||||||||
| Click here to read the national report or to select another newspaper | ||||||||||
| Year | Non-white % of newsroom staff | 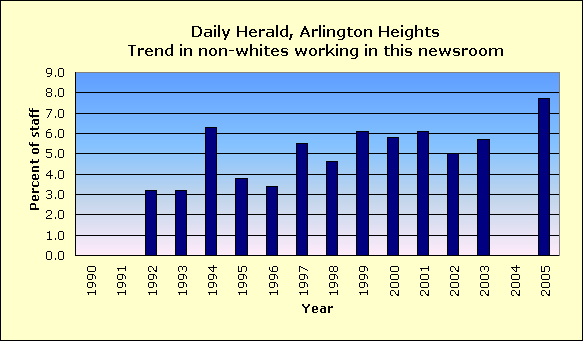
|
||||||||
| 2005 | 7.7 | |||||||||
| 2004 | Did not report | |||||||||
| 2003 | 5.7 | |||||||||
| 2002 | 5.0 | |||||||||
| 2001 | 6.1 | |||||||||
| 2000 | 5.8 | |||||||||
| 1999 | 6.1 | |||||||||
| 1998 | 4.6 | |||||||||
| 1997 | 5.5 | |||||||||
| 1996 | 3.4 | |||||||||
| 1995 | 3.8 | |||||||||
| 1994 | 6.3 | |||||||||
| 1993 | 3.2 | |||||||||
| 1992 | 3.2 | |||||||||
| 1991 | Did not report | |||||||||
| 1990 | Did not report | |||||||||
| The latest year at peak is | 2005 | |||||||||
| See the notes and definitions section below for the sources of these figures. | ||||||||||
| Newsroom Diversity Index | ||||||||||
| for Daily Herald, Arlington Heights | ||||||||||
| Year | Non-white % of newsroom staff | Non-white % of circulation area | Newsroom Diversity Index (parity=100) | |||||||
| 2005 | 7.7 | 22.6 | 34 | |||||||
| 2004 | N/A | 22.6 | N/A | |||||||
| How the index is calculated | ||||||||||
| The Newsroom Diversity Index is the non-white percentage of the newsroom staff | ||||||||||
| divided by the non-white percentage of residents in the circulation area. | ||||||||||
| (Parity = 100.) | ||||||||||
| See the notes and definitions section below for the sources of these figures. | ||||||||||
| Peer group comparison | ||||||||||
| for Daily Herald, Arlington Heights | ||||||||||
 |
||||||||||
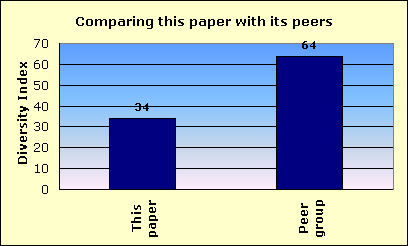
| This newspaper's Newsroom Diversity Index is 34. | This paper | |||||||||
| Peer group | ||||||||||
| Compare that with 64, which is the median Diversity Index for all newspapers | ||||||||||
| reporting in this circulation category of 100,001 to 250,000 daily sales. | ||||||||||
| In that group, this newspaper's Diversity Index ranks 53 out of 58 | ||||||||||
| newspapers reporting in the category of 100,001 to 250,000 daily sales. | ||||||||||
| An example of a newspaper of similar circulation, in an area of similar level of non-white residents, but one that has a relatively high Diversity Index, is The Detroit News, Michigan, with a 26.2 percent non-white staff in a community that is 21.6 percent non-white. Its index is 121. | ||||||||||
| FYI, in circulation, this newspaper's average weekday circulation of | ||||||||||
| approximately 149,446 ranks 74 out of 1,410 daily newspapers in the US. | ||||||||||
| See the notes and definitions section below for the sources of these figures. | ||||||||||
| Details on race/ethnicity | ||||||||||
| in the circulation area | ||||||||||
| and the home county | ||||||||||
| of Daily Herald, Arlington Heights | ||||||||||
| Circulation area | ||||||||||
| Race/ethnicity | % of population | Number of residents | 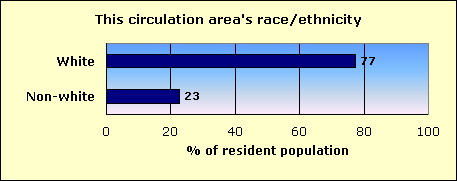
|
|||||||
| Hispanic | 11.7 | 217,563 | ||||||||
| Black | 2.5 | 46,324 | ||||||||
| Asian and Pacific Islander | 7.1 | 131,044 | ||||||||
| Native-American | 0.1 | 2,039 | ||||||||
| Other non-white | 0.1 | 1,792 | ||||||||
| Multi-racial | 1.2 | 21,955 | ||||||||
| Non-white | 22.6 | 420,717 | ||||||||
| White | 77.4 | 1,437,800 | ||||||||
| Total | 1,858,517 | |||||||||
| Home county: Cook | ||||||||||
| Race/ethnicity | % of population | Number of residents | 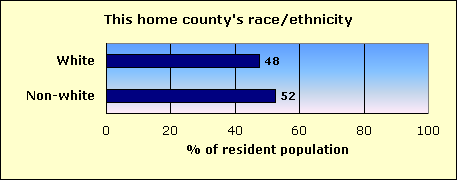
|
|||||||
| Hispanic | 19.9 | 1,071,740 | ||||||||
| Black | 25.9 | 1,390,448 | ||||||||
| Asian and Pacific Islander | 4.8 | 259,386 | ||||||||
| Native-American | 0.1 | 6,754 | ||||||||
| Other non-white | 0.1 | 7,291 | ||||||||
| Multi-racial | 1.5 | 82,413 | ||||||||
| Non-white | 52.4 | 2,818,032 | ||||||||
| White | 47.6 | 2,558,709 | ||||||||
| Total | 5,376,741 | |||||||||
| The home county of this newspaper is Cook. | ||||||||||
| About this report | ||||||||||
| This third annual report for the Knight Foundation adds context to an annual survey by the American Society of Newspaper Editors. ASNE has set a goal that | ||||||||||
| every newspaper, to help it know its community and gather the news, should employ at least one non-white journalist, and that newspapers should strive to | ||||||||||
| employ non-whites in proportion to their share of the community. ASNE's report, at www.asne.org, shows each newspaper's non-white employment, but does | ||||||||||
| not disclose how closely that employment mirrors the newspaper's circulation area. | ||||||||||
| That gap is filled by the report you are reading now. This report was not done by ASNE, but was done for the Knight Foundation by Bill Dedman and | ||||||||||
| Stephen K. Doig. It shows how close each newspaper is to ASNE's goal, by comparing the newsroom staffing with the circulation area population. | ||||||||||
| The full report is at www.powerreporting.com/knight. | ||||||||||
| Notes and definitions | ||||||||||
| 1. The Newsroom Diversity Index is the non-white percentage of the newsroom staff divided by the non-white percentage of the circulation area's residents. Parity = 100. | ||||||||||
| 2. Source for staffing: Survey by American Society of Newspaper Editors, April 2005. Newspapers report non-white staff as of the end of the previous year. | ||||||||||
| 3. Following ASNE's definition, newsroom staff includes only supervisors, reporters, editors, copy/layout editors and photographers. | ||||||||||
| 4. Also following ASNE's definition, "whites," "blacks," etc., exclude Hispanics, who are counted in a separate category. | ||||||||||
| 5. Source for boundaries of this newspaper's circulation area: ZIP Code circulation data, Audit Bureau of Circulations, latest available. | ||||||||||
| 6. A paper may define its circulation area differently for marketing efforts, or news coverage, or to set advertising rates. | ||||||||||
| 7. If ZIP Codes or counties are used, this report applies a threshold: 10 percent household penetration is required to include an area in the circulation area. | ||||||||||
| 8. Source for the demographics of residents of that circulation area: US Census 2000. | ||||||||||
| 9. Source for total circulation: Editor & Publisher magazine, Monday-Friday average at year-end 2004. | ||||||||||
| 10. Staff of non-English publications, such as the Miami Herald's El Nuevo Herald, are excluded from the ASNE staffing survey for the first time this year. | ||||||||||
| Demographics of ZIP Codes | ||||||||||
| where sales were reported by | ||||||||||
| Daily Herald, Arlington Heights | ||||||||||
| Note that some ZIP Codes listed here may not have been included in determining the newspaper's circulation area. In calculating the Diversity Index, a | ||||||||||
| ZIP Code was included only if the household penetration was at least 10 percent. Any lower-penetration ZIP Codes are also listed here for your information. | ||||||||||
| Also, if the newspaper reported more than 300 ZIP Codes, only the top 300 in weekday sales are listed here. | ||||||||||
| ZIP / City / State / Approx. distance in miles from the newspaper's home office | Weekday sales | Households | Penetration % (daily sales per 100 households) | Median household income | Non-white % of population |
Hispanic % of population |
Black % of population |
Native % of population |
Asian % of population |
|
| 60004 / Arlington Height / IL / 5.8 mi. | 6,892 | 20,330 | 33.9 | $71,512 | 13.2 | 5.8 | 1.1 | 0.0 | 5.3 | |
| 60056 / Mount Prospect / IL / 8.7 mi. | 5,255 | 21,638 | 24.3 | $57,659 | 26.2 | 11.7 | 1.8 | 0.1 | 11.3 | |
| 60067 / Palatine / IL / 2.4 mi. | 5,061 | 19,851 | 25.5 | $74,764 | 12.3 | 4.4 | 1.0 | 0.1 | 5.7 | |
| 60007 / Elk Grove Villag / IL / 9.1 mi. | 4,934 | 13,452 | 36.7 | $62,271 | 17.5 | 6.3 | 1.4 | 0.1 | 8.6 | |
| 60005 / Arlington Height / IL / 6.7 mi. | 4,275 | 12,522 | 34.1 | $56,877 | 17.0 | 7.2 | 1.4 | 0.1 | 7.3 | |
| 60187 / Wheaton / IL / 17.6 mi. | 4,243 | 21,537 | 19.7 | $75,242 | 11.5 | 3.3 | 2.4 | 0.1 | 4.7 | |
| 60193 / Schaumburg / IL / 7.6 mi. | 4,116 | 16,475 | 25.0 | $61,097 | 17.1 | 4.7 | 2.0 | 0.1 | 9.0 | |
| 60123 / Elgin / IL / 12.1 mi. | 4,016 | 19,274 | 20.8 | $57,928 | 30.1 | 19.9 | 5.6 | 0.1 | 3.0 | |
| 60047 / Long Grove / IL / 4.3 mi. | 3,648 | 11,879 | 30.7 | $100,938 | 9.8 | 4.0 | 0.8 | 0.1 | 4.2 | |
| 60194 / Schaumburg / IL / 6.2 mi. | 3,453 | 15,551 | 22.2 | $59,660 | 33.5 | 11.0 | 4.6 | 0.1 | 15.8 | |
| 60010 / Tower Lakes / IL / 4.4 mi. | 3,396 | 14,029 | 24.2 | $110,470 | 8.0 | 2.0 | 0.6 | 0.1 | 4.6 | |
| 60195 / Schaumburg / IL / 4.1 mi. | 3,228 | 10,876 | 29.7 | $67,761 | 27.9 | 7.2 | 4.5 | 0.1 | 14.5 | |
| 60103 / Ontarioville / IL / 11.2 mi. | 3,223 | 23,463 | 13.7 | $70,938 | 31.3 | 16.0 | 3.9 | 0.1 | 9.7 | |
| 60089 / Buffalo Grove / IL / 6.6 mi. | 3,222 | 15,235 | 21.1 | $81,324 | 13.2 | 3.4 | 0.7 | 0.0 | 8.0 | |
| 60074 / Palatine / IL / 3.2 mi. | 2,872 | 9,044 | 31.8 | $51,594 | 48.6 | 32.2 | 4.1 | 0.1 | 10.6 | |
| 60008 / Rolling Meadows / IL / 4.5 mi. | 2,760 | 8,458 | 32.6 | $57,694 | 30.5 | 20.2 | 2.8 | 0.1 | 6.3 | |
| 60016 / Des Plaines / IL / 11 mi. | 2,718 | 23,019 | 11.8 | $51,192 | 31.9 | 10.5 | 2.6 | 0.1 | 16.5 | |
| 60060 / Mundelein / IL / 9.1 mi. | 2,468 | 11,896 | 20.7 | $70,726 | 31.3 | 22.6 | 1.5 | 0.1 | 6.1 | |
| 60120 / Elgin / IL / 11 mi. | 2,461 | 15,403 | 16.0 | $52,067 | 57.0 | 44.9 | 6.4 | 0.2 | 4.2 | |
| 60188 / Wheaton / IL / 13.9 mi. | 2,421 | 14,813 | 16.3 | $65,766 | 26.3 | 9.7 | 4.0 | 0.1 | 10.9 | |
| 60174 / Valley View / IL / 17 mi. | 2,415 | 11,583 | 20.8 | $67,608 | 10.2 | 5.8 | 2.0 | 0.1 | 1.7 | |
| 60018 / Rosemont / IL / 12.3 mi. | 2,406 | 10,533 | 22.8 | $48,945 | 33.9 | 24.1 | 0.9 | 0.1 | 7.4 | |
| 60540 / Woodridge / IL / 23.9 mi. | 2,304 | 14,797 | 15.6 | $87,514 | 15.2 | 3.5 | 1.9 | 0.1 | 8.5 | |
| 60090 / Wheeling / IL / 7.5 mi. | 2,290 | 14,249 | 16.1 | $54,892 | 33.9 | 20.8 | 2.4 | 0.1 | 9.3 | |
| 60107 / Streamwood / IL / 7.9 mi. | 2,235 | 11,828 | 18.9 | $64,523 | 31.2 | 17.3 | 3.5 | 0.1 | 8.4 | |
| 60048 / Mettawa / IL / 12 mi. | 2,093 | 9,793 | 21.4 | $94,334 | 9.6 | 2.7 | 1.1 | 0.1 | 4.7 | |
| 60134 / Geneva / IL / 19 mi. | 2,072 | 7,233 | 28.6 | $80,542 | 6.2 | 3.0 | 1.3 | 0.0 | 1.3 | |
| 60137 / Glendale Heights / IL / 16.9 mi. | 2,072 | 13,991 | 14.8 | $74,335 | 12.2 | 4.5 | 2.1 | 0.1 | 4.2 | |
| 60030 / Wildwood / IL / 13.9 mi. | 1,980 | 11,537 | 17.2 | $71,331 | 10.7 | 4.7 | 1.3 | 0.1 | 3.5 | |
| 60175 / Saint Charles / IL / 16.7 mi. | 1,976 | 5,479 | 36.1 | $105,858 | 4.3 | 1.6 | 0.7 | 0.1 | 1.4 | |
| 60510 / Batavia / IL / 21.2 mi. | 1,871 | 9,414 | 19.9 | $70,225 | 9.6 | 5.1 | 2.2 | 0.1 | 1.4 | |
| 60108 / Bloomingdale / IL / 11.7 mi. | 1,864 | 8,296 | 22.5 | $67,323 | 17.7 | 4.9 | 2.6 | 0.1 | 8.9 | |
| 60031 / Gurnee / IL / 17.2 mi. | 1,837 | 13,813 | 13.3 | $71,993 | 21.2 | 6.3 | 5.4 | 0.2 | 7.3 | |
| 60073 / Volo / IL / 15.1 mi. | 1,831 | 11,782 | 15.5 | $56,408 | 35.6 | 29.6 | 2.5 | 0.3 | 1.7 | |
| 60102 / Lake in the Hill / IL / 10.1 mi. | 1,819 | 16,048 | 11.3 | $75,542 | 10.0 | 5.1 | 1.1 | 0.1 | 2.7 | |
| 60118 / West Dundee / IL / 9.8 mi. | 1,785 | 5,404 | 33.0 | $72,500 | 8.4 | 4.0 | 0.7 | 0.1 | 2.1 | |
| 60148 / Lombard / IL / 17.2 mi. | 1,756 | 19,396 | 9.1 | $60,378 | 16.5 | 5.1 | 3.0 | 0.1 | 6.8 | |
| 60110 / Carpentersvle / IL / 8.6 mi. | 1,738 | 9,323 | 18.6 | $53,624 | 48.8 | 39.8 | 5.5 | 0.3 | 1.8 | |
| 60172 / Roselle / IL / 10 mi. | 1,709 | 9,212 | 18.6 | $65,130 | 14.6 | 5.2 | 1.5 | 0.2 | 6.7 | |
| 60565 / Naperville / IL / 25.5 mi. | 1,552 | 12,762 | 12.2 | $97,807 | 15.9 | 2.4 | 2.3 | 0.1 | 10.0 | |
| 60563 / Naperville / IL / 22.2 mi. | 1,365 | 12,962 | 10.5 | $66,592 | 20.2 | 4.1 | 4.4 | 0.1 | 10.2 | |
| 60101 / Addison / IL / 13.6 mi. | 1,350 | 12,395 | 10.9 | $54,495 | 38.9 | 27.6 | 2.4 | 0.1 | 7.7 | |
| 60532 / Lisle / IL / 22.1 mi. | 1,281 | 11,406 | 11.2 | $62,145 | 19.1 | 5.2 | 3.3 | 0.2 | 9.2 | |
| 60185 / West Chicago / IL / 16.6 mi. | 1,274 | 9,504 | 13.4 | $66,953 | 42.1 | 37.8 | 1.3 | 0.1 | 1.9 | |
| 60046 / West Miltmore / IL / 18 mi. | 1,270 | 10,347 | 12.3 | $69,276 | 9.2 | 3.7 | 1.8 | 0.2 | 2.2 | |
| 60564 / Naperville / IL / 27.6 mi. | 1,244 | 9,563 | 13.0 | $107,617 | 16.2 | 3.0 | 3.6 | 0.1 | 8.3 | |
| 60177 / South Elgin / IL / 13.2 mi. | 1,239 | 5,871 | 21.1 | $67,163 | 19.8 | 10.4 | 2.5 | 0.1 | 5.3 | |
| 60070 / Wheeling / IL / 7.5 mi. | 1,199 | 6,063 | 19.8 | $54,545 | 36.3 | 29.0 | 1.7 | 0.1 | 4.4 | |
| 60084 / Wauconda / IL / 8.8 mi. | 1,187 | 4,875 | 24.3 | $61,625 | 13.0 | 10.3 | 0.3 | 0.2 | 1.5 | |
| 60142 / Huntley / IL / 16.7 mi. | 1,172 | 2,977 | 39.4 | $64,840 | 8.4 | 4.9 | 0.4 | 0.1 | 2.3 | |
| 60061 / Vernon Hills / IL / 8.6 mi. | 1,170 | 7,560 | 15.5 | $71,354 | 22.0 | 7.4 | 1.7 | 0.1 | 11.4 | |
| 60139 / Glendale Heights / IL / 13.7 mi. | 1,160 | 10,980 | 10.6 | $56,791 | 44.7 | 18.1 | 4.6 | 0.1 | 19.9 | |
| 60143 / Itasca / IL / 10.9 mi. | 1,157 | 3,805 | 30.4 | $70,172 | 15.3 | 6.4 | 1.4 | 0.2 | 5.0 | |
| 60106 / Bensenville / IL / 13.3 mi. | 1,015 | 7,467 | 13.6 | $55,365 | 45.2 | 34.9 | 2.5 | 0.1 | 6.0 | |
| 60181 / Villa Park / IL / 17.1 mi. | 983 | 11,066 | 8.9 | $54,517 | 24.6 | 14.6 | 2.8 | 0.1 | 5.7 | |
| 60173 / Schaumburg / IL / 5.7 mi. | 947 | 5,873 | 16.1 | $62,031 | 40.5 | 5.5 | 5.2 | 0.1 | 27.9 | |
| 60191 / Wood Dale / IL / 12.3 mi. | 930 | 5,407 | 17.2 | $57,713 | 18.7 | 13.4 | 0.5 | 0.1 | 3.3 | |
| 60013 / Trout Valley / IL / 9 mi. | 857 | 7,830 | 10.9 | $74,560 | 7.4 | 5.2 | 0.3 | 0.1 | 1.1 | |
| 60190 / Winfield / IL / 17.2 mi. | 812 | 3,871 | 21.0 | $84,502 | 11.1 | 4.2 | 2.5 | 0.1 | 3.3 | |
| 60542 / North Aurora / IL / 23.7 mi. | 744 | 4,166 | 17.9 | $59,820 | 17.7 | 9.5 | 4.3 | 0.2 | 2.5 | |
| 60555 / Warrenville / IL / 20.4 mi. | 651 | 5,102 | 12.8 | $63,736 | 16.5 | 9.8 | 2.2 | 0.1 | 3.4 | |
| 60069 / Prairieview / IL / 8.6 mi. | 599 | 2,526 | 23.7 | $107,989 | 9.1 | 3.4 | 0.7 | 0.0 | 4.2 | |
| 60140 / Pingree Grove / IL / 20.4 mi. | 499 | 2,497 | 20.0 | $63,380 | 4.5 | 3.4 | 0.1 | 0.1 | 0.3 | |
| 60020 / Fox Lake / IL / 17.3 mi. | 482 | 2,854 | 16.9 | $41,726 | 9.4 | 6.7 | 0.7 | 0.2 | 0.7 | |
| 60041 / Volo / IL / 15 mi. | 469 | 3,393 | 13.8 | $59,874 | 6.3 | 4.2 | 0.4 | 0.2 | 0.7 | |
| 60119 / Elburn / IL / 25 mi. | 449 | 2,692 | 16.7 | $79,159 | 4.1 | 2.4 | 0.1 | 0.2 | 0.6 | |
| 60062 / Northbrook / IL / 11.9 mi. | 427 | 15,028 | 2.8 | $89,164 | 14.5 | 2.2 | 0.7 | 0.0 | 10.5 | |
| 60042 / Island Lake / IL / 11 mi. | 373 | 3,082 | 12.1 | $62,917 | 11.2 | 8.2 | 0.7 | 0.1 | 1.5 | |
| 60126 / Elmhurst / IL / 17 mi. | 339 | 16,538 | 2.0 | $69,268 | 9.8 | 4.1 | 0.9 | 0.0 | 3.8 | |
| 60136 / Gilberts / IL / 13.2 mi. | 268 | 456 | 58.8 | $84,919 | 6.3 | 3.7 | 0.1 | 0.3 | 1.6 | |
| 60021 / Fox River Grove / IL / 7.4 mi. | 256 | 2,055 | 12.5 | $64,403 | 7.2 | 3.9 | 0.4 | 0.1 | 1.8 | |
| 60504 / Aurora / IL / 25.3 mi. | 234 | 15,941 | 1.5 | $76,185 | 23.6 | 7.4 | 7.4 | 0.1 | 6.8 | |
| 60192 / Schaumburg / IL / 7.2 mi. | 217 | 517 | 42.0 | $118,431 | 29.5 | 5.8 | 1.5 | 0.1 | 21.1 | |
| 60157 / Medinah / IL / 10.6 mi. | 210 | 730 | 28.8 | $81,251 | 7.3 | 3.7 | 0.7 | 0.1 | 1.9 | |
| 60068 / Park Ridge / IL / 16.3 mi. | 184 | 14,181 | 1.3 | $73,172 | 6.5 | 2.9 | 0.2 | 0.1 | 2.7 | |
| 60015 / Riverwoods / IL / 10.5 mi. | 181 | 9,441 | 1.9 | $101,814 | 7.7 | 2.3 | 0.7 | 0.0 | 3.8 | |
| 60656 / Norridge / IL / 16.4 mi. | 175 | 12,091 | 1.4 | $47,512 | 15.0 | 6.6 | 1.1 | 0.1 | 5.6 | |
| 60521 / Oak Brook / IL / 22.9 mi. | 156 | 13,061 | 1.2 | $91,727 | 15.6 | 3.2 | 3.1 | 0.0 | 8.1 | |
| 60611 / Fort Dearborn / IL / 27.2 mi. | 154 | 17,532 | 0.9 | $69,889 | 19.9 | 3.6 | 5.1 | 0.1 | 9.4 | |
| 60559 / Westmont / IL / 22.5 mi. | 140 | 10,393 | 1.3 | $53,438 | 25.8 | 7.0 | 5.1 | 0.1 | 12.0 | |
| 60601 / Chicago / IL / 27.4 mi. | 139 | 3,501 | 4.0 | $77,374 | 28.9 | 5.6 | 11.1 | 0.4 | 10.3 | |
| 60014 / Village of Lakew / IL / 12.9 mi. | 124 | 15,125 | 0.8 | $69,395 | 10.4 | 7.1 | 0.5 | 0.1 | 1.7 | |
| 60025 / Glenview / IL / 13.5 mi. | 124 | 18,618 | 0.7 | $73,723 | 18.8 | 4.7 | 1.6 | 0.1 | 11.2 | |
| 60131 / Schiller Park / IL / 16.3 mi. | 120 | 6,470 | 1.9 | $47,032 | 42.0 | 38.1 | 0.6 | 0.1 | 2.4 | |
| 60176 / Schiller Park / IL / 15.5 mi. | 120 | 4,157 | 2.9 | $41,291 | 31.1 | 22.0 | 1.8 | 0.1 | 5.1 | |
| 60523 / Oak Brook / IL / 20.6 mi. | 119 | 3,911 | 3.0 | $109,942 | 22.8 | 2.4 | 1.2 | 0.0 | 17.9 | |
| 60602 / Chicago / IL / 27.5 mi. | 106 | 22 | 481.8 | $23,750 | 45.7 | 31.4 | 11.4 | 0.0 | 2.9 | |
| 60631 / Norwood Park / IL / 16.4 mi. | 93 | 11,952 | 0.8 | $55,316 | 9.3 | 5.2 | 1.0 | 0.1 | 2.2 | |
| 60085 / Waukegan / IL / 18.4 mi. | 88 | 23,020 | 0.4 | $39,276 | 73.7 | 48.9 | 18.9 | 0.2 | 3.8 | |
| 60517 / Woodridge / IL / 24.6 mi. | 80 | 11,607 | 0.7 | $61,769 | 29.6 | 9.2 | 7.9 | 0.1 | 10.9 | |
| 60160 / Melrose Park / IL / 18.5 mi. | 79 | 7,565 | 1.0 | $41,064 | 59.6 | 54.0 | 2.7 | 0.1 | 2.0 | |
| 60164 / Northlake / IL / 16.9 mi. | 74 | 6,971 | 1.1 | $50,068 | 42.9 | 34.9 | 2.8 | 0.2 | 4.0 | |
| 60603 / Chicago / IL / 27.5 mi. | 74 | 14 | 528.6 | $61,815 | 31.5 | 7.4 | 1.9 | 0.3 | 18.5 | |
| 60109 / Burlington / IL / 20.6 mi. | 70 | 64 | 109.4 | $52,500 | 5.1 | 1.9 | 0.0 | 0.0 | 0.0 | |
| 60184 / Wayne / IL / 13.6 mi. | 64 | 251 | 25.5 | $93,785 | 6.6 | 2.9 | 0.6 | 0.0 | 1.9 | |
| 60002 / Antioch / IL / 21.6 mi. | 63 | 7,380 | 0.9 | $58,578 | 5.5 | 3.0 | 0.7 | 0.3 | 0.7 | |
| 60053 / Morton Grove / IL / 15.4 mi. | 60 | 7,897 | 0.8 | $65,466 | 29.2 | 4.5 | 0.5 | 0.1 | 22.4 | |
| 60304 / Oak Park / IL / 22 mi. | 60 | 6,881 | 0.9 | $61,982 | 34.5 | 5.4 | 21.6 | 0.2 | 4.1 | |
| 60515 / Downers Grove / IL / 21.2 mi. | 60 | 11,155 | 0.5 | $61,179 | 8.2 | 3.0 | 1.3 | 0.1 | 3.1 | |
| 60505 / Aurora / IL / 26 mi. | 51 | 16,204 | 0.3 | $40,475 | 72.7 | 60.9 | 10.1 | 0.2 | 0.7 | |
| 60516 / Downers Grove / IL / 24.2 mi. | 44 | 11,177 | 0.4 | $73,687 | 16.1 | 4.3 | 2.4 | 0.1 | 8.1 | |
| 60064 / North Chicago / IL / 16.8 mi. | 39 | 4,939 | 0.8 | $33,248 | 87.0 | 27.6 | 56.1 | 0.1 | 1.6 | |
| 60506 / Aurora / IL / 26.9 mi. | 39 | 17,654 | 0.2 | $50,743 | 39.7 | 23.7 | 13.0 | 0.1 | 1.3 | |
| 60045 / Mettawa / IL / 12.7 mi. | 38 | 7,398 | 0.5 | $138,525 | 8.0 | 2.1 | 1.3 | 0.0 | 3.7 | |
| 60305 / River Forest / IL / 20.2 mi. | 36 | 4,092 | 0.9 | $89,284 | 13.3 | 4.0 | 4.8 | 0.1 | 3.2 | |
| 60561 / Westmont / IL / 25.2 mi. | 33 | 8,961 | 0.4 | $74,949 | 18.1 | 3.6 | 1.8 | 0.1 | 11.4 | |
| 60035 / Highland Park / IL / 14 mi. | 30 | 11,186 | 0.3 | $104,200 | 9.1 | 4.9 | 1.3 | 0.0 | 2.2 | |
| 60077 / Skokie / IL / 17.1 mi. | 30 | 10,081 | 0.3 | $48,460 | 33.2 | 5.7 | 2.7 | 0.1 | 22.3 | |
| 60171 / River Grove / IL / 17.9 mi. | 30 | 4,361 | 0.7 | $40,783 | 13.1 | 9.7 | 0.3 | 0.1 | 2.1 | |
| 60610 / Fort Dearborn / IL / 26.5 mi. | 24 | 28,638 | 0.1 | $51,294 | 36.8 | 3.9 | 26.9 | 0.1 | 4.4 | |
| File | il_daily_herald__arlington_heights | |||||||||
| Time | 5/13/05 5:07 PM | |||||||||
| Page | 74 | |||||||||
| Member | 110170 | |||||||||