
|
| Comparing the racial diversity of the journalists | ||||||||||
| at America's daily newspapers | ||||||||||
| with the communities that they serve | ||||||||||
| Newsroom diversity report for | ||||||||||
| Chicago Tribune | ||||||||||
| Chicago, Illinois | ||||||||||
| Owner: Tribune Co. (Ill.) | ||||||||||
| From a report for the Knight Foundation | ||||||||||
| by Bill Dedman and Stephen K. Doig, June 2005 | ||||||||||
| Click here to read the national report or to select another newspaper | ||||||||||
| Year | Non-white % of newsroom staff | 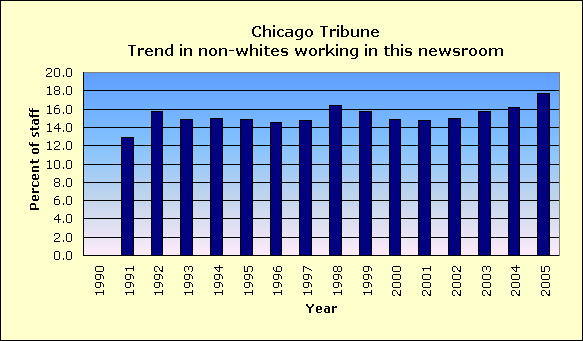
|
||||||||
| 2005 | 17.7 | |||||||||
| 2004 | 16.2 | |||||||||
| 2003 | 15.7 | |||||||||
| 2002 | 15.0 | |||||||||
| 2001 | 14.8 | |||||||||
| 2000 | 14.9 | |||||||||
| 1999 | 15.7 | |||||||||
| 1998 | 16.4 | |||||||||
| 1997 | 14.7 | |||||||||
| 1996 | 14.5 | |||||||||
| 1995 | 14.9 | |||||||||
| 1994 | 15.0 | |||||||||
| 1993 | 14.9 | |||||||||
| 1992 | 15.7 | |||||||||
| 1991 | 12.9 | |||||||||
| 1990 | Did not report | |||||||||
| The latest year at peak is | 2005 | |||||||||
| See the notes and definitions section below for the sources of these figures. | ||||||||||
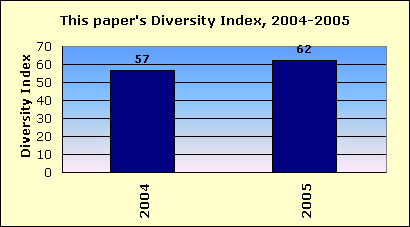
| Newsroom Diversity Index | ||||||||||
| for Chicago Tribune | ||||||||||
 |
||||||||||
| Year | Non-white % of newsroom staff | Non-white % of circulation area | Newsroom Diversity Index (parity=100) | |||||||
| 2005 | 17.7 | 28.5 | 62 | |||||||
| 2004 | 16.2 | 28.5 | 57 | |||||||
| How the index is calculated | ||||||||||
| The Newsroom Diversity Index is the non-white percentage of the newsroom staff | ||||||||||
| divided by the non-white percentage of residents in the circulation area. | ||||||||||
| (Parity = 100.) | ||||||||||
| Company index | ||||||||||
| This newspaper's owner, Tribune Co. (Ill.), | ||||||||||
| has a companywide, circulation-weighted Diversity Index of 55. | ||||||||||
| See the notes and definitions section below for the sources of these figures. | ||||||||||
| Peer group comparison | ||||||||||
| for Chicago Tribune | ||||||||||
 |
||||||||||
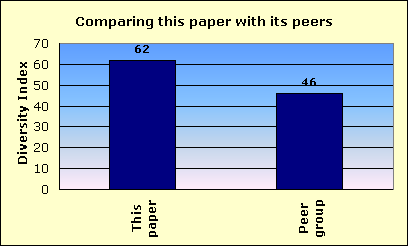
| This newspaper's Newsroom Diversity Index is 62. | This paper | |||||||||
| Peer group | ||||||||||
| Compare that with 46, which is the median Diversity Index for all newspapers | ||||||||||
| reporting in this circulation category of more than 500,000 daily sales. | ||||||||||
| In that group, this newspaper's Diversity Index ranks 1 out of 10 | ||||||||||
| newspapers reporting in the category of more than 500,000 daily sales. | ||||||||||
| FYI, in circulation, this newspaper's average weekday circulation of | ||||||||||
| approximately 600,988 ranks 8 out of 1,410 daily newspapers in the US. | ||||||||||
| See the notes and definitions section below for the sources of these figures. | ||||||||||
| Details on race/ethnicity | ||||||||||
| in the circulation area | ||||||||||
| and the home county | ||||||||||
| of Chicago Tribune | ||||||||||
| Circulation area | ||||||||||
| Race/ethnicity | % of population | Number of residents | 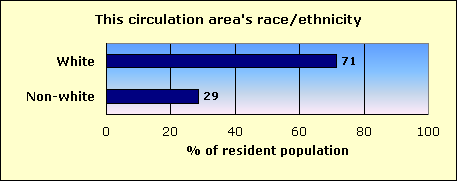
|
|||||||
| Hispanic | 11.7 | 722,504 | ||||||||
| Black | 9.2 | 570,368 | ||||||||
| Asian and Pacific Islander | 5.8 | 358,475 | ||||||||
| Native-American | 0.1 | 7,807 | ||||||||
| Other non-white | 0.1 | 8,191 | ||||||||
| Multi-racial | 1.5 | 92,384 | ||||||||
| Non-white | 28.5 | 1,759,729 | ||||||||
| White | 71.5 | 4,412,027 | ||||||||
| Total | 6,171,756 | |||||||||
| Home county: Cook | ||||||||||
| Race/ethnicity | % of population | Number of residents | 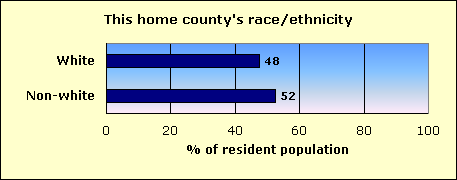
|
|||||||
| Hispanic | 19.9 | 1,071,740 | ||||||||
| Black | 25.9 | 1,390,448 | ||||||||
| Asian and Pacific Islander | 4.8 | 259,386 | ||||||||
| Native-American | 0.1 | 6,754 | ||||||||
| Other non-white | 0.1 | 7,291 | ||||||||
| Multi-racial | 1.5 | 82,413 | ||||||||
| Non-white | 52.4 | 2,818,032 | ||||||||
| White | 47.6 | 2,558,709 | ||||||||
| Total | 5,376,741 | |||||||||
| The home county of this newspaper is Cook. | ||||||||||
| About this report | ||||||||||
| This third annual report for the Knight Foundation adds context to an annual survey by the American Society of Newspaper Editors. ASNE has set a goal that | ||||||||||
| every newspaper, to help it know its community and gather the news, should employ at least one non-white journalist, and that newspapers should strive to | ||||||||||
| employ non-whites in proportion to their share of the community. ASNE's report, at www.asne.org, shows each newspaper's non-white employment, but does | ||||||||||
| not disclose how closely that employment mirrors the newspaper's circulation area. | ||||||||||
| That gap is filled by the report you are reading now. This report was not done by ASNE, but was done for the Knight Foundation by Bill Dedman and | ||||||||||
| Stephen K. Doig. It shows how close each newspaper is to ASNE's goal, by comparing the newsroom staffing with the circulation area population. | ||||||||||
| The full report is at www.powerreporting.com/knight. | ||||||||||
| Notes and definitions | ||||||||||
| 1. The Newsroom Diversity Index is the non-white percentage of the newsroom staff divided by the non-white percentage of the circulation area's residents. Parity = 100. | ||||||||||
| 2. Source for staffing: Survey by American Society of Newspaper Editors, April 2005. Newspapers report non-white staff as of the end of the previous year. | ||||||||||
| 3. Following ASNE's definition, newsroom staff includes only supervisors, reporters, editors, copy/layout editors and photographers. | ||||||||||
| 4. Also following ASNE's definition, "whites," "blacks," etc., exclude Hispanics, who are counted in a separate category. | ||||||||||
| 5. Source for boundaries of this newspaper's circulation area: ZIP Code circulation data, Audit Bureau of Circulations, latest available. | ||||||||||
| 6. A paper may define its circulation area differently for marketing efforts, or news coverage, or to set advertising rates. | ||||||||||
| 7. If ZIP Codes or counties are used, this report applies a threshold: 10 percent household penetration is required to include an area in the circulation area. | ||||||||||
| 8. Source for the demographics of residents of that circulation area: US Census 2000. | ||||||||||
| 9. Source for total circulation: Editor & Publisher magazine, Monday-Friday average at year-end 2004. | ||||||||||
| 10. Staff of non-English publications, such as the Miami Herald's El Nuevo Herald, are excluded from the ASNE staffing survey for the first time this year. | ||||||||||
| Demographics of ZIP Codes | ||||||||||
| where sales were reported by | ||||||||||
| Chicago Tribune | ||||||||||
| Note that some ZIP Codes listed here may not have been included in determining the newspaper's circulation area. In calculating the Diversity Index, a | ||||||||||
| ZIP Code was included only if the household penetration was at least 10 percent. Any lower-penetration ZIP Codes are also listed here for your information. | ||||||||||
| Also, if the newspaper reported more than 300 ZIP Codes, only the top 300 in weekday sales are listed here. | ||||||||||
| ZIP / City / State / Approx. distance in miles from the newspaper's home office | Weekday sales | Households | Penetration % (daily sales per 100 households) | Median household income | Non-white % of population |
Hispanic % of population |
Black % of population |
Native % of population |
Asian % of population |
|
| 60610 / Chicago / IL / 1 mi. | 10,796 | 28,638 | 37.7 | $51,294 | 36.8 | 3.9 | 26.9 | 0.1 | 4.4 | |
| 60614 / Chicago / IL / 2.5 mi. | 8,733 | 36,510 | 23.9 | $68,324 | 14.9 | 5.4 | 4.0 | 0.1 | 3.8 | |
| 60657 / Chicago / IL / 3.7 mi. | 8,208 | 39,846 | 20.6 | $55,647 | 18.1 | 7.9 | 3.3 | 0.1 | 5.1 | |
| 60611 / Chicago / IL / 0 mi. | 8,082 | 17,532 | 46.1 | $69,889 | 19.9 | 3.6 | 5.1 | 0.1 | 9.4 | |
| 60187 / Wheaton / IL / 25.7 mi. | 7,793 | 21,537 | 36.2 | $75,242 | 11.5 | 3.3 | 2.4 | 0.1 | 4.7 | |
| 60062 / Northbrook / IL / 19.6 mi. | 7,637 | 15,028 | 50.8 | $89,164 | 14.5 | 2.2 | 0.7 | 0.0 | 10.5 | |
| 60025 / Glenview / IL / 16.5 mi. | 7,509 | 18,618 | 40.3 | $73,723 | 18.8 | 4.7 | 1.6 | 0.1 | 11.2 | |
| 60606 / Chicago / IL / 1.3 mi. | 7,326 | 1,036 | 707.1 | $100,377 | 31.1 | 7.7 | 5.7 | 0.0 | 16.9 | |
| 60126 / Elmhurst / IL / 16.5 mi. | 6,335 | 16,538 | 38.3 | $69,268 | 9.8 | 4.1 | 0.9 | 0.0 | 3.8 | |
| 60201 / Evanston / IL / 11.9 mi. | 5,865 | 15,924 | 36.8 | $57,393 | 32.7 | 4.3 | 17.9 | 0.1 | 7.8 | |
| 60068 / Park Ridge / IL / 14.1 mi. | 5,798 | 14,181 | 40.9 | $73,172 | 6.5 | 2.9 | 0.2 | 0.1 | 2.7 | |
| 60035 / Highland Park / IL / 22.1 mi. | 5,791 | 11,186 | 51.8 | $104,200 | 9.1 | 4.9 | 1.3 | 0.0 | 2.2 | |
| 60540 / Naperville / IL / 28.6 mi. | 5,672 | 14,797 | 38.3 | $87,514 | 15.2 | 3.5 | 1.9 | 0.1 | 8.5 | |
| 60010 / Barrington / IL / 33.1 mi. | 5,500 | 14,029 | 39.2 | $110,470 | 8.0 | 2.0 | 0.6 | 0.1 | 4.6 | |
| 60148 / Lombard / IL / 20.5 mi. | 5,387 | 19,396 | 27.8 | $60,378 | 16.5 | 5.1 | 3.0 | 0.1 | 6.8 | |
| 60091 / Wilmette / IL / 13.8 mi. | 5,305 | 9,878 | 53.7 | $107,767 | 12.0 | 2.1 | 0.6 | 0.0 | 8.1 | |
| 60067 / Palatine / IL / 26.9 mi. | 5,296 | 19,851 | 26.7 | $74,764 | 12.3 | 4.4 | 1.0 | 0.1 | 5.7 | |
| 60565 / Naperville / IL / 28.1 mi. | 5,237 | 12,762 | 41.0 | $97,807 | 15.9 | 2.4 | 2.3 | 0.1 | 10.0 | |
| 60634 / Chicago / IL / 11.2 mi. | 5,162 | 26,276 | 19.6 | $50,042 | 26.2 | 19.6 | 0.6 | 0.1 | 3.8 | |
| 60453 / Oak Lawn / IL / 14.3 mi. | 5,159 | 21,948 | 23.5 | $47,529 | 9.9 | 5.3 | 1.2 | 0.1 | 1.7 | |
| 60004 / Arlington Heights / IL / 23.8 mi. | 5,023 | 20,330 | 24.7 | $71,512 | 13.2 | 5.8 | 1.1 | 0.0 | 5.3 | |
| 60613 / Chicago / IL / 4.6 mi. | 5,021 | 29,268 | 17.2 | $48,381 | 29.7 | 13.0 | 8.4 | 0.2 | 5.7 | |
| 60605 / Chicago / IL / 1.7 mi. | 5,017 | 6,638 | 75.6 | $56,151 | 46.8 | 4.8 | 31.5 | 0.2 | 7.8 | |
| 60137 / Glen Ellyn / IL / 23 mi. | 5,009 | 13,991 | 35.8 | $74,335 | 12.2 | 4.5 | 2.1 | 0.1 | 4.2 | |
| 60015 / Deerfield / IL / 23.3 mi. | 4,985 | 9,441 | 52.8 | $101,814 | 7.7 | 2.3 | 0.7 | 0.0 | 3.8 | |
| 60504 / Aurora / IL / 33.7 mi. | 4,839 | 15,941 | 30.4 | $76,185 | 23.6 | 7.4 | 7.4 | 0.1 | 6.8 | |
| 60618 / Chicago / IL / 5.6 mi. | 4,721 | 34,989 | 13.5 | $41,355 | 60.2 | 49.1 | 2.6 | 0.3 | 5.0 | |
| 60089 / Buffalo Grove / IL / 25.9 mi. | 4,644 | 15,235 | 30.5 | $81,324 | 13.2 | 3.4 | 0.7 | 0.0 | 8.0 | |
| 60525 / La Grange / IL / 15.2 mi. | 4,582 | 12,719 | 36.0 | $62,895 | 12.4 | 6.8 | 3.5 | 0.1 | 1.2 | |
| 60640 / Chicago / IL / 5.7 mi. | 4,457 | 35,237 | 12.6 | $32,466 | 57.4 | 21.3 | 19.0 | 0.4 | 13.4 | |
| 60056 / Mount Prospect / IL / 20.1 mi. | 4,396 | 21,638 | 20.3 | $57,659 | 26.2 | 11.7 | 1.8 | 0.1 | 11.3 | |
| 60477 / Tinley Park / IL / 24.3 mi. | 4,358 | 20,198 | 21.6 | $62,000 | 10.3 | 4.4 | 2.3 | 0.1 | 2.4 | |
| 60302 / Oak Park / IL / 8.8 mi. | 4,210 | 14,896 | 28.3 | $57,132 | 33.3 | 4.0 | 22.8 | 0.1 | 3.9 | |
| 60515 / Downers Grove / IL / 21.6 mi. | 4,183 | 11,155 | 37.5 | $61,179 | 8.2 | 3.0 | 1.3 | 0.1 | 3.1 | |
| 60045 / Lake Forest / IL / 26.9 mi. | 4,175 | 7,398 | 56.4 | $138,525 | 8.0 | 2.1 | 1.3 | 0.0 | 3.7 | |
| 60544 / Plainfield / IL / 37.3 mi. | 4,147 | 15,007 | 27.6 | $70,417 | 11.3 | 6.2 | 2.1 | 0.1 | 1.9 | |
| 60048 / Libertyville / IL / 32.3 mi. | 4,083 | 9,793 | 41.7 | $94,334 | 9.6 | 2.7 | 1.1 | 0.1 | 4.7 | |
| 60638 / Chicago / IL / 10.7 mi. | 4,071 | 20,761 | 19.6 | $45,173 | 25.4 | 15.5 | 7.9 | 0.1 | 0.7 | |
| 60462 / Orland Park / IL / 22.8 mi. | 4,030 | 14,338 | 28.1 | $65,103 | 9.5 | 4.0 | 0.6 | 0.1 | 3.6 | |
| 60521 / Hinsdale / IL / 17.2 mi. | 4,021 | 13,061 | 30.8 | $91,727 | 15.6 | 3.2 | 3.1 | 0.0 | 8.1 | |
| 60093 / Winnetka / IL / 16.1 mi. | 3,987 | 6,939 | 57.5 | $127,809 | 8.3 | 3.8 | 0.4 | 0.1 | 3.3 | |
| 60016 / Des Plaines / IL / 17.6 mi. | 3,942 | 23,019 | 17.1 | $51,192 | 31.9 | 10.5 | 2.6 | 0.1 | 16.5 | |
| 60047 / Lake Zurich / IL / 30.6 mi. | 3,909 | 11,879 | 32.9 | $100,938 | 9.8 | 4.0 | 0.8 | 0.1 | 4.2 | |
| 60646 / Chicago / IL / 10.3 mi. | 3,863 | 11,041 | 35.0 | $58,232 | 14.8 | 6.6 | 0.3 | 0.1 | 6.3 | |
| 60564 / Naperville / IL / 32.4 mi. | 3,862 | 9,563 | 40.4 | $107,617 | 16.2 | 3.0 | 3.6 | 0.1 | 8.3 | |
| 60402 / Berwyn / IL / 9.8 mi. | 3,836 | 22,225 | 17.3 | $43,828 | 40.8 | 35.6 | 1.0 | 0.2 | 2.4 | |
| 60563 / Naperville / IL / 28.9 mi. | 3,834 | 12,962 | 29.6 | $66,592 | 20.2 | 4.1 | 4.4 | 0.1 | 10.2 | |
| 60516 / Downers Grove / IL / 22.1 mi. | 3,749 | 11,177 | 33.5 | $73,687 | 16.1 | 4.3 | 2.4 | 0.1 | 8.1 | |
| 60630 / Chicago / IL / 8.7 mi. | 3,728 | 21,527 | 17.3 | $47,905 | 27.1 | 16.4 | 0.5 | 0.2 | 7.4 | |
| 60031 / Gurnee / IL / 37.2 mi. | 3,613 | 13,813 | 26.2 | $71,993 | 21.2 | 6.3 | 5.4 | 0.2 | 7.3 | |
| 60625 / Chicago / IL / 6.9 mi. | 3,598 | 30,653 | 11.7 | $40,083 | 63.0 | 37.6 | 3.5 | 0.2 | 17.1 | |
| 60631 / Chicago / IL / 12.1 mi. | 3,502 | 11,952 | 29.3 | $55,316 | 9.3 | 5.2 | 1.0 | 0.1 | 2.2 | |
| 60076 / Skokie / IL / 11.3 mi. | 3,432 | 11,839 | 29.0 | $62,932 | 36.2 | 5.9 | 4.6 | 0.1 | 22.2 | |
| 60014 / Crystal Lake / IL / 42.7 mi. | 3,382 | 15,125 | 22.4 | $69,395 | 10.4 | 7.1 | 0.5 | 0.1 | 1.7 | |
| 60202 / Evanston / IL / 10.1 mi. | 3,316 | 13,704 | 24.2 | $55,659 | 43.6 | 8.4 | 27.7 | 0.2 | 3.9 | |
| 60005 / Arlington Heights / IL / 22.5 mi. | 3,289 | 12,522 | 26.3 | $56,877 | 17.0 | 7.2 | 1.4 | 0.1 | 7.3 | |
| 60643 / Chicago / IL / 14.2 mi. | 3,253 | 17,525 | 18.6 | $51,305 | 80.2 | 1.8 | 76.7 | 0.1 | 0.3 | |
| 60622 / Chicago / IL / 2.8 mi. | 3,183 | 31,012 | 10.3 | $38,487 | 60.0 | 45.2 | 10.2 | 0.2 | 1.8 | |
| 60601 / Chicago / IL / 0.6 mi. | 3,174 | 3,501 | 90.7 | $77,374 | 28.9 | 5.6 | 11.1 | 0.4 | 10.3 | |
| 60656 / Chicago / IL / 11.7 mi. | 3,171 | 12,091 | 26.2 | $47,512 | 15.0 | 6.6 | 1.1 | 0.1 | 5.6 | |
| 60615 / Chicago / IL / 6.5 mi. | 3,159 | 21,341 | 14.8 | $31,571 | 78.2 | 2.9 | 67.0 | 0.1 | 5.8 | |
| 60641 / Chicago / IL / 7.5 mi. | 3,157 | 25,403 | 12.4 | $42,182 | 46.9 | 38.8 | 1.1 | 0.2 | 3.9 | |
| 60188 / Carol Stream / IL / 26.4 mi. | 3,151 | 14,813 | 21.3 | $65,766 | 26.3 | 9.7 | 4.0 | 0.1 | 10.9 | |
| 60030 / Grayslake / IL / 37.4 mi. | 3,139 | 11,537 | 27.2 | $71,331 | 10.7 | 4.7 | 1.3 | 0.1 | 3.5 | |
| 60532 / Lisle / IL / 24.9 mi. | 3,091 | 11,406 | 27.1 | $62,145 | 19.1 | 5.2 | 3.3 | 0.2 | 9.2 | |
| 60660 / Chicago / IL / 7.1 mi. | 3,079 | 22,257 | 13.8 | $34,293 | 54.9 | 20.8 | 17.5 | 0.3 | 12.5 | |
| 60561 / Darien / IL / 20.9 mi. | 3,074 | 8,961 | 34.3 | $74,949 | 18.1 | 3.6 | 1.8 | 0.1 | 11.4 | |
| 60645 / Chicago / IL / 8.8 mi. | 3,047 | 16,136 | 18.9 | $41,438 | 47.5 | 16.3 | 10.5 | 0.2 | 15.6 | |
| 60714 / Niles / IL / 13.6 mi. | 3,029 | 12,324 | 24.6 | $48,542 | 20.2 | 5.0 | 0.5 | 0.0 | 12.9 | |
| 60077 / Skokie / IL / 12 mi. | 3,006 | 10,081 | 29.8 | $48,460 | 33.2 | 5.7 | 2.7 | 0.1 | 22.3 | |
| 60655 / Chicago / IL / 14.5 mi. | 2,991 | 10,774 | 27.8 | $59,849 | 10.4 | 3.6 | 5.2 | 0.1 | 0.5 | |
| 60174 / Saint Charles / IL / 34.5 mi. | 2,950 | 11,583 | 25.5 | $67,608 | 10.2 | 5.8 | 2.0 | 0.1 | 1.7 | |
| 60441 / Lockport / IL / 30 mi. | 2,913 | 15,166 | 19.2 | $65,322 | 14.6 | 4.9 | 7.7 | 0.1 | 1.1 | |
| 60616 / Chicago / IL / 3.3 mi. | 2,869 | 19,279 | 14.9 | $30,625 | 78.3 | 9.1 | 38.3 | 0.2 | 29.2 | |
| 60647 / Chicago / IL / 4.7 mi. | 2,860 | 33,406 | 8.6 | $35,283 | 76.9 | 67.7 | 5.9 | 0.2 | 1.3 | |
| 60046 / Lake Villa / IL / 42.4 mi. | 2,840 | 10,347 | 27.4 | $69,276 | 9.2 | 3.7 | 1.8 | 0.2 | 2.2 | |
| 60060 / Mundelein / IL / 33.4 mi. | 2,820 | 11,896 | 23.7 | $70,726 | 31.3 | 22.6 | 1.5 | 0.1 | 6.1 | |
| 60050 / McHenry / IL / 46.6 mi. | 2,798 | 17,164 | 16.3 | $59,121 | 7.0 | 5.2 | 0.3 | 0.2 | 0.7 | |
| 60506 / Aurora / IL / 40.1 mi. | 2,796 | 17,654 | 15.8 | $50,743 | 39.7 | 23.7 | 13.0 | 0.1 | 1.3 | |
| 60123 / Elgin / IL / 39.7 mi. | 2,779 | 19,274 | 14.4 | $57,928 | 30.1 | 19.9 | 5.6 | 0.1 | 3.0 | |
| 60517 / Woodridge / IL / 24.2 mi. | 2,730 | 11,607 | 23.5 | $61,769 | 29.6 | 9.2 | 7.9 | 0.1 | 10.9 | |
| 60440 / Bolingbrook / IL / 27.3 mi. | 2,713 | 14,503 | 18.7 | $64,244 | 43.9 | 14.3 | 21.1 | 0.1 | 5.9 | |
| 60193 / Schaumburg / IL / 25.7 mi. | 2,705 | 16,475 | 16.4 | $61,097 | 17.1 | 4.7 | 2.0 | 0.1 | 9.0 | |
| 60181 / Villa Park / IL / 18.4 mi. | 2,689 | 11,066 | 24.3 | $54,517 | 24.6 | 14.6 | 2.8 | 0.1 | 5.7 | |
| 60626 / Chicago / IL / 8.3 mi. | 2,675 | 24,146 | 11.1 | $31,318 | 67.7 | 27.0 | 28.5 | 0.3 | 7.8 | |
| 60617 / Chicago / IL / 12.8 mi. | 2,644 | 31,600 | 8.4 | $35,534 | 89.7 | 34.3 | 54.0 | 0.2 | 0.2 | |
| 60018 / Des Plaines / IL / 16.1 mi. | 2,635 | 10,533 | 25.0 | $48,945 | 33.9 | 24.1 | 0.9 | 0.1 | 7.4 | |
| 60007 / Elk Grove Village / IL / 21.1 mi. | 2,631 | 13,452 | 19.6 | $62,271 | 17.5 | 6.3 | 1.4 | 0.1 | 8.6 | |
| 60637 / Chicago / IL / 7.9 mi. | 2,610 | 21,702 | 12.0 | $23,228 | 87.9 | 1.3 | 81.8 | 0.1 | 3.2 | |
| 60134 / Geneva / IL / 37.1 mi. | 2,604 | 7,233 | 36.0 | $80,542 | 6.2 | 3.0 | 1.3 | 0.0 | 1.3 | |
| 60619 / Chicago / IL / 10.4 mi. | 2,584 | 29,870 | 8.7 | $33,631 | 99.5 | 0.7 | 97.7 | 0.1 | 0.1 | |
| 60629 / Chicago / IL / 9.6 mi. | 2,578 | 32,389 | 8.0 | $40,279 | 76.7 | 48.6 | 25.6 | 0.1 | 0.7 | |
| 60523 / Oak Brook / IL / 18.2 mi. | 2,570 | 3,911 | 65.7 | $109,942 | 22.8 | 2.4 | 1.2 | 0.0 | 17.9 | |
| 60053 / Morton Grove / IL / 13.4 mi. | 2,568 | 7,897 | 32.5 | $65,466 | 29.2 | 4.5 | 0.5 | 0.1 | 22.4 | |
| 60628 / Chicago / IL / 14.1 mi. | 2,564 | 27,023 | 9.5 | $38,210 | 98.5 | 3.1 | 94.4 | 0.1 | 0.1 | |
| 60194 / Schaumburg / IL / 28.3 mi. | 2,537 | 15,551 | 16.3 | $59,660 | 33.5 | 11.0 | 4.6 | 0.1 | 15.8 | |
| 60510 / Batavia / IL / 37.5 mi. | 2,510 | 9,414 | 26.7 | $70,225 | 9.6 | 5.1 | 2.2 | 0.1 | 1.4 | |
| 60559 / Westmont / IL / 19.6 mi. | 2,470 | 10,393 | 23.8 | $53,438 | 25.8 | 7.0 | 5.1 | 0.1 | 12.0 | |
| 60620 / Chicago / IL / 10.9 mi. | 2,461 | 28,499 | 8.6 | $36,334 | 96.9 | 0.8 | 95.2 | 0.1 | 0.1 | |
| 60103 / Bartlett / IL / 30.3 mi. | 2,411 | 23,463 | 10.3 | $70,938 | 31.3 | 16.0 | 3.9 | 0.1 | 9.7 | |
| 60558 / Western Springs / IL / 15.7 mi. | 2,357 | 4,334 | 54.4 | $98,806 | 3.0 | 1.7 | 0.2 | 0.0 | 0.7 | |
| 60154 / Westchester / IL / 14 mi. | 2,353 | 6,968 | 33.8 | $59,105 | 17.3 | 5.6 | 7.3 | 0.0 | 3.4 | |
| 60467 / Orland Park / IL / 22.1 mi. | 2,351 | 6,856 | 34.3 | $81,896 | 7.1 | 2.8 | 0.8 | 0.0 | 2.7 | |
| 60632 / Chicago / IL / 7.5 mi. | 2,316 | 24,566 | 9.4 | $37,406 | 74.7 | 70.4 | 0.9 | 0.1 | 1.9 | |
| 60604 / Chicago / IL / 1.2 mi. | 2,244 | 33 | 6800.0 | $31,250 | 70.5 | 21.8 | 14.1 | 0.0 | 34.6 | |
| 60061 / Vernon Hills / IL / 28.8 mi. | 2,234 | 7,560 | 29.6 | $71,354 | 22.0 | 7.4 | 1.7 | 0.1 | 11.4 | |
| 60090 / Wheeling / IL / 22.5 mi. | 2,215 | 14,249 | 15.5 | $54,892 | 33.9 | 20.8 | 2.4 | 0.1 | 9.3 | |
| 60463 / Palos Heights / IL / 18.4 mi. | 2,208 | 4,883 | 45.2 | $68,136 | 4.5 | 1.6 | 0.4 | 0.1 | 1.7 | |
| 60101 / Addison / IL / 20.3 mi. | 2,189 | 12,395 | 17.7 | $54,495 | 38.9 | 27.6 | 2.4 | 0.1 | 7.7 | |
| 60430 / Homewood / IL / 23.2 mi. | 2,188 | 8,136 | 26.9 | $58,155 | 25.4 | 3.1 | 19.2 | 0.1 | 1.6 | |
| 60435 / Joliet / IL / 35.8 mi. | 2,181 | 21,196 | 10.3 | $44,910 | 23.6 | 11.6 | 9.1 | 0.2 | 1.4 | |
| 60804 / Cicero / IL / 8 mi. | 2,142 | 23,128 | 9.3 | $38,044 | 80.5 | 77.5 | 0.8 | 0.2 | 0.9 | |
| 60423 / Frankfort / IL / 31.1 mi. | 2,129 | 7,369 | 28.9 | $74,783 | 7.3 | 3.1 | 1.7 | 0.1 | 1.8 | |
| 60304 / Oak Park / IL / 8.9 mi. | 2,126 | 6,881 | 30.9 | $61,982 | 34.5 | 5.4 | 21.6 | 0.2 | 4.1 | |
| 60305 / River Forest / IL / 10.3 mi. | 2,086 | 4,092 | 51.0 | $89,284 | 13.3 | 4.0 | 4.8 | 0.1 | 3.2 | |
| 60195 / Schaumburg / IL / 28 mi. | 2,082 | 10,876 | 19.1 | $67,761 | 27.9 | 7.2 | 4.5 | 0.1 | 14.5 | |
| 60546 / Riverside / IL / 11.2 mi. | 2,072 | 6,526 | 31.7 | $55,287 | 11.0 | 6.7 | 1.4 | 0.1 | 2.0 | |
| 60102 / Algonquin / IL / 39.1 mi. | 2,045 | 16,048 | 12.7 | $75,542 | 10.0 | 5.1 | 1.1 | 0.1 | 2.7 | |
| 60411 / Chicago Heights / IL / 26.9 mi. | 2,033 | 20,232 | 10.0 | $40,626 | 56.8 | 17.1 | 37.5 | 0.2 | 0.6 | |
| 60526 / La Grange Park / IL / 13.6 mi. | 1,983 | 5,435 | 36.5 | $59,124 | 9.3 | 3.6 | 3.0 | 0.1 | 1.7 | |
| 60451 / New Lenox / IL / 32.2 mi. | 1,975 | 8,861 | 22.3 | $70,698 | 4.5 | 3.1 | 0.3 | 0.1 | 0.4 | |
| 60108 / Bloomingdale / IL / 24.4 mi. | 1,918 | 8,296 | 23.1 | $67,323 | 17.7 | 4.9 | 2.6 | 0.1 | 8.9 | |
| 60439 / Lemont / IL / 23.9 mi. | 1,915 | 6,602 | 29.0 | $76,857 | 4.9 | 2.9 | 0.3 | 0.1 | 1.0 | |
| 60175 / Saint Charles / IL / 39.8 mi. | 1,897 | 5,479 | 34.6 | $105,858 | 4.3 | 1.6 | 0.7 | 0.1 | 1.4 | |
| 60659 / Chicago / IL / 8 mi. | 1,892 | 12,755 | 14.8 | $45,064 | 54.5 | 16.2 | 5.0 | 0.2 | 27.3 | |
| 46383 / Valparaiso / IN / 41.8 mi. | 1,889 | 13,702 | 13.8 | $50,478 | 6.6 | 3.1 | 1.2 | 0.2 | 1.2 | |
| 60514 / Clarendon Hills / IL / 18.7 mi. | 1,873 | 7,669 | 24.4 | $61,747 | 12.9 | 3.9 | 2.1 | 0.0 | 5.6 | |
| 60172 / Roselle / IL / 25.1 mi. | 1,863 | 9,212 | 20.2 | $65,130 | 14.6 | 5.2 | 1.5 | 0.2 | 6.7 | |
| 60652 / Chicago / IL / 11.3 mi. | 1,851 | 12,865 | 14.4 | $53,120 | 62.4 | 17.2 | 41.7 | 0.1 | 1.1 | |
| 60013 / Cary / IL / 38.8 mi. | 1,849 | 7,830 | 23.6 | $74,560 | 7.4 | 5.2 | 0.3 | 0.1 | 1.1 | |
| 60085 / Waukegan / IL / 34.5 mi. | 1,837 | 23,020 | 8.0 | $39,276 | 73.7 | 48.9 | 18.9 | 0.2 | 3.8 | |
| 60185 / West Chicago / IL / 30.6 mi. | 1,831 | 9,504 | 19.3 | $66,953 | 42.1 | 37.8 | 1.3 | 0.1 | 1.9 | |
| 60098 / Woodstock / IL / 52.3 mi. | 1,772 | 9,795 | 18.1 | $52,846 | 18.2 | 14.8 | 0.7 | 0.2 | 1.6 | |
| 60002 / Antioch / IL / 45.7 mi. | 1,766 | 7,380 | 23.9 | $58,578 | 5.5 | 3.0 | 0.7 | 0.3 | 0.7 | |
| 60805 / Evergreen Park / IL / 12.7 mi. | 1,766 | 7,471 | 23.6 | $53,514 | 14.1 | 4.0 | 7.8 | 0.1 | 1.2 | |
| 60452 / Oak Forest / IL / 21.1 mi. | 1,760 | 9,739 | 18.1 | $60,339 | 13.5 | 5.9 | 3.7 | 0.1 | 2.7 | |
| 60712 / Lincolnwood / IL / 9.7 mi. | 1,755 | 4,485 | 39.1 | $71,234 | 28.3 | 4.2 | 0.4 | 0.0 | 21.0 | |
| 60513 / Brookfield / IL / 12.7 mi. | 1,701 | 7,570 | 22.5 | $52,660 | 11.1 | 8.0 | 0.9 | 0.1 | 1.2 | |
| 60044 / Lake Bluff / IL / 29.9 mi. | 1,672 | 3,987 | 41.9 | $76,154 | 20.4 | 6.4 | 7.8 | 0.6 | 4.0 | |
| 60607 / Chicago / IL / 2.2 mi. | 1,667 | 7,293 | 22.9 | $40,972 | 56.8 | 8.1 | 32.9 | 0.1 | 13.5 | |
| 60107 / Streamwood / IL / 29.9 mi. | 1,662 | 11,828 | 14.1 | $64,523 | 31.2 | 17.3 | 3.5 | 0.1 | 8.4 | |
| 60649 / Chicago / IL / 9.5 mi. | 1,623 | 23,520 | 6.9 | $27,699 | 98.8 | 1.1 | 96.3 | 0.1 | 0.2 | |
| 60543 / Oswego / IL / 39.5 mi. | 1,609 | 6,377 | 25.2 | $70,039 | 9.9 | 5.8 | 1.8 | 0.1 | 1.2 | |
| 60073 / Round Lake / IL / 40.2 mi. | 1,590 | 11,782 | 13.5 | $56,408 | 35.6 | 29.6 | 2.5 | 0.3 | 1.7 | |
| 60448 / Mokena / IL / 28.5 mi. | 1,582 | 6,256 | 25.3 | $73,533 | 5.4 | 3.0 | 0.5 | 0.1 | 1.1 | |
| 60466 / Park Forest / IL / 30.3 mi. | 1,575 | 11,450 | 13.8 | $48,591 | 55.9 | 4.3 | 48.5 | 0.1 | 0.8 | |
| 60022 / Glencoe / IL / 18.3 mi. | 1,570 | 2,948 | 53.3 | $171,063 | 6.1 | 1.3 | 2.1 | 0.1 | 1.7 | |
| 60612 / Chicago / IL / 3.7 mi. | 1,565 | 12,245 | 12.8 | $25,143 | 86.2 | 14.0 | 65.1 | 0.1 | 5.8 | |
| 60473 / South Holland / IL / 20.6 mi. | 1,557 | 7,678 | 20.3 | $60,116 | 56.6 | 3.9 | 50.7 | 0.1 | 0.9 | |
| 60608 / Chicago / IL / 4.1 mi. | 1,531 | 24,881 | 6.2 | $28,026 | 87.0 | 62.7 | 18.2 | 0.2 | 5.0 | |
| 46321 / Munster / IN / 24.7 mi. | 1,530 | 8,091 | 18.9 | $63,243 | 11.2 | 4.9 | 1.0 | 0.1 | 4.5 | |
| 60639 / Chicago / IL / 7.3 mi. | 1,515 | 25,430 | 6.0 | $40,165 | 86.1 | 66.4 | 17.2 | 0.1 | 1.3 | |
| 60446 / Romeoville / IL / 29.4 mi. | 1,489 | 6,733 | 22.1 | $60,692 | 22.2 | 13.5 | 4.4 | 0.2 | 2.3 | |
| 60120 / Elgin / IL / 33.3 mi. | 1,450 | 15,403 | 9.4 | $52,067 | 57.0 | 44.9 | 6.4 | 0.2 | 4.2 | |
| 60603 / Chicago / IL / 1 mi. | 1,417 | 14 | 10121.4 | $61,815 | 31.5 | 7.4 | 1.9 | 0.3 | 18.5 | |
| 60139 / Glendale Heights / IL / 23.8 mi. | 1,415 | 10,980 | 12.9 | $56,791 | 44.7 | 18.1 | 4.6 | 0.1 | 19.9 | |
| 60706 / Harwood Heights / IL / 9.3 mi. | 1,382 | 9,153 | 15.1 | $46,809 | 8.9 | 4.6 | 0.2 | 0.1 | 3.3 | |
| 60069 / Lincolnshire / IL / 26.2 mi. | 1,380 | 2,526 | 54.6 | $107,989 | 9.1 | 3.4 | 0.7 | 0.0 | 4.2 | |
| 60106 / Bensenville / IL / 17.3 mi. | 1,378 | 7,467 | 18.5 | $55,365 | 45.2 | 34.9 | 2.5 | 0.1 | 6.0 | |
| 60087 / Waukegan / IL / 37.4 mi. | 1,375 | 8,052 | 17.1 | $52,468 | 47.2 | 29.5 | 12.2 | 0.3 | 3.3 | |
| 60464 / Palos Park / IL / 20.1 mi. | 1,343 | 3,536 | 38.0 | $76,846 | 5.9 | 2.1 | 0.4 | 0.1 | 2.4 | |
| 60130 / Forest Park / IL / 10.2 mi. | 1,340 | 7,632 | 17.6 | $44,103 | 47.9 | 7.8 | 30.8 | 0.1 | 6.8 | |
| 60008 / Rolling Meadows / IL / 24 mi. | 1,339 | 8,458 | 15.8 | $57,694 | 30.5 | 20.2 | 2.8 | 0.1 | 6.3 | |
| 60422 / Flossmoor / IL / 24.8 mi. | 1,339 | 3,300 | 40.6 | $94,679 | 35.7 | 2.3 | 27.6 | 0.0 | 4.1 | |
| 60465 / Palos Hills / IL / 18.2 mi. | 1,318 | 7,164 | 18.4 | $52,164 | 15.6 | 4.7 | 5.5 | 0.1 | 2.6 | |
| 60438 / Lansing / IL / 22.9 mi. | 1,317 | 11,633 | 11.3 | $47,671 | 17.8 | 5.6 | 10.4 | 0.1 | 0.8 | |
| 60707 / Elmwood Park / IL / 9.9 mi. | 1,312 | 15,786 | 8.3 | $47,365 | 29.8 | 19.1 | 6.3 | 0.1 | 2.5 | |
| 60445 / Midlothian / IL / 19.1 mi. | 1,293 | 9,991 | 12.9 | $48,027 | 12.9 | 5.4 | 5.0 | 0.1 | 1.3 | |
| 60190 / Winfield / IL / 27.8 mi. | 1,285 | 3,871 | 33.2 | $84,502 | 11.1 | 4.2 | 2.5 | 0.1 | 3.3 | |
| 60431 / Joliet / IL / 41.2 mi. | 1,258 | 7,643 | 16.5 | $71,030 | 13.2 | 5.5 | 5.1 | 0.2 | 1.6 | |
| 60173 / Schaumburg / IL / 24.7 mi. | 1,217 | 5,873 | 20.7 | $62,031 | 40.5 | 5.5 | 5.2 | 0.1 | 27.9 | |
| 60609 / Chicago / IL / 6 mi. | 1,217 | 22,813 | 5.3 | $25,705 | 84.2 | 43.4 | 38.5 | 0.1 | 1.2 | |
| 60070 / Prospect Heights / IL / 21.5 mi. | 1,210 | 6,063 | 20.0 | $54,545 | 36.3 | 29.0 | 1.7 | 0.1 | 4.4 | |
| 60426 / Harvey / IL / 20 mi. | 1,207 | 14,441 | 8.4 | $34,459 | 90.9 | 9.6 | 79.6 | 0.1 | 0.4 | |
| 60803 / Alsip / IL / 16.4 mi. | 1,166 | 8,875 | 13.1 | $46,618 | 21.8 | 8.3 | 9.4 | 0.1 | 1.9 | |
| 60555 / Warrenville / IL / 31.7 mi. | 1,156 | 5,102 | 22.7 | $63,736 | 16.5 | 9.8 | 2.2 | 0.1 | 3.4 | |
| 60661 / Chicago / IL / 1.5 mi. | 1,145 | 2,687 | 42.6 | $54,698 | 45.0 | 5.9 | 21.3 | 0.0 | 15.9 | |
| 60191 / Wood Dale / IL / 19.2 mi. | 1,143 | 5,407 | 21.1 | $57,713 | 18.7 | 13.4 | 0.5 | 0.1 | 3.3 | |
| 60409 / Calumet City / IL / 19.8 mi. | 1,141 | 15,151 | 7.5 | $38,840 | 65.6 | 10.8 | 52.5 | 0.1 | 0.6 | |
| 46307 / Crown Point / IN / 37 mi. | 1,139 | 17,531 | 6.5 | $59,459 | 8.9 | 4.8 | 1.9 | 0.2 | 1.1 | |
| 60417 / Crete / IL / 32.3 mi. | 1,130 | 5,721 | 19.8 | $66,831 | 15.6 | 4.1 | 9.6 | 0.1 | 0.7 | |
| 60459 / Burbank / IL / 12.9 mi. | 1,096 | 9,343 | 11.7 | $49,240 | 15.7 | 11.1 | 0.3 | 0.1 | 1.8 | |
| 60118 / Dundee / IL / 39.1 mi. | 1,083 | 5,404 | 20.0 | $72,500 | 8.4 | 4.0 | 0.7 | 0.1 | 2.1 | |
| 60160 / Melrose Park / IL / 12.5 mi. | 1,074 | 7,565 | 14.2 | $41,064 | 59.6 | 54.0 | 2.7 | 0.1 | 2.0 | |
| 60131 / Franklin Park / IL / 13.9 mi. | 1,070 | 6,470 | 16.5 | $47,032 | 42.0 | 38.1 | 0.6 | 0.1 | 2.4 | |
| 60623 / Chicago / IL / 6.1 mi. | 1,068 | 27,639 | 3.9 | $28,203 | 97.9 | 62.9 | 34.5 | 0.1 | 0.1 | |
| 60143 / Itasca / IL / 21.3 mi. | 1,030 | 3,805 | 27.1 | $70,172 | 15.3 | 6.4 | 1.4 | 0.2 | 5.0 | |
| 60164 / Melrose Park / IL / 14.5 mi. | 1,007 | 6,971 | 14.4 | $50,068 | 42.9 | 34.9 | 2.8 | 0.2 | 4.0 | |
| 60443 / Matteson / IL / 27.6 mi. | 944 | 5,575 | 16.9 | $55,367 | 60.8 | 3.5 | 54.2 | 0.1 | 1.4 | |
| 60490 / Bolingbrook / IL / 25.9 mi. | 941 | 2,773 | 33.9 | $87,512 | 33.4 | 7.5 | 15.6 | 0.2 | 8.4 | |
| 60074 / Palatine / IL / 27.7 mi. | 929 | 9,044 | 10.3 | $51,594 | 48.6 | 32.2 | 4.1 | 0.1 | 10.6 | |
| 60505 / Aurora / IL / 35.8 mi. | 921 | 16,204 | 5.7 | $40,475 | 72.7 | 60.9 | 10.1 | 0.2 | 0.7 | |
| 60177 / South Elgin / IL / 34.5 mi. | 919 | 5,871 | 15.7 | $67,163 | 19.8 | 10.4 | 2.5 | 0.1 | 5.3 | |
| 60110 / Carpentersville / IL / 36.7 mi. | 916 | 9,323 | 9.8 | $53,624 | 48.8 | 39.8 | 5.5 | 0.3 | 1.8 | |
| 60099 / Zion / IL / 40.7 mi. | 899 | 10,096 | 8.9 | $48,101 | 40.8 | 14.0 | 21.9 | 0.2 | 1.8 | |
| 60542 / North Aurora / IL / 37.4 mi. | 892 | 4,166 | 21.4 | $59,820 | 17.7 | 9.5 | 4.3 | 0.2 | 2.5 | |
| 60012 / Crystal Lake / IL / 44.2 mi. | 878 | 3,206 | 27.4 | $89,804 | 5.0 | 2.3 | 0.3 | 0.1 | 1.6 | |
| 60624 / Chicago / IL / 5.5 mi. | 852 | 13,743 | 6.2 | $22,426 | 99.3 | 1.0 | 97.7 | 0.1 | 0.1 | |
| 60651 / Chicago / IL / 6.3 mi. | 839 | 21,207 | 4.0 | $32,622 | 97.6 | 26.8 | 69.5 | 0.1 | 0.4 | |
| 60644 / Chicago / IL / 7.2 mi. | 837 | 17,904 | 4.7 | $26,930 | 98.0 | 2.2 | 94.8 | 0.1 | 0.3 | |
| 60203 / Evanston / IL / 11.8 mi. | 835 | 1,713 | 48.7 | $81,133 | 25.5 | 4.3 | 11.8 | 0.1 | 7.3 | |
| 60153 / Maywood / IL / 11.8 mi. | 834 | 7,921 | 10.5 | $41,970 | 94.2 | 10.6 | 82.0 | 0.1 | 0.3 | |
| 60084 / Wauconda / IL / 37 mi. | 825 | 4,875 | 16.9 | $61,625 | 13.0 | 10.3 | 0.3 | 0.2 | 1.5 | |
| 60636 / Chicago / IL / 8.6 mi. | 822 | 14,041 | 5.9 | $27,727 | 99.5 | 1.2 | 97.5 | 0.1 | 0.1 | |
| 60406 / Blue Island / IL / 16.3 mi. | 815 | 9,101 | 9.0 | $35,604 | 62.9 | 37.2 | 23.6 | 0.2 | 0.4 | |
| 60602 / Chicago / IL / 1 mi. | 806 | 22 | 3663.6 | $23,750 | 45.7 | 31.4 | 11.4 | 0.0 | 2.9 | |
| 60142 / Huntley / IL / 45.9 mi. | 799 | 2,977 | 26.8 | $64,840 | 8.4 | 4.9 | 0.4 | 0.1 | 2.3 | |
| 60176 / Schiller Park / IL / 13.6 mi. | 795 | 4,157 | 19.1 | $41,291 | 31.1 | 22.0 | 1.8 | 0.1 | 5.1 | |
| 60429 / Hazel Crest / IL / 22.3 mi. | 772 | 5,506 | 14.0 | $49,078 | 78.5 | 3.8 | 71.9 | 0.1 | 1.0 | |
| 60621 / Chicago / IL / 8.2 mi. | 771 | 14,966 | 5.2 | $19,718 | 99.6 | 0.8 | 97.8 | 0.1 | 0.1 | |
| 60457 / Hickory Hills / IL / 16 mi. | 768 | 5,181 | 14.8 | $55,779 | 14.4 | 8.0 | 1.3 | 0.1 | 2.2 | |
| 60419 / Dolton / IL / 18.4 mi. | 751 | 8,486 | 8.8 | $47,979 | 86.7 | 3.1 | 81.8 | 0.1 | 0.6 | |
| 60436 / Joliet / IL / 38.8 mi. | 751 | 6,254 | 12.0 | $36,099 | 40.3 | 14.4 | 23.2 | 0.2 | 0.6 | |
| 46322 / Highland / IN / 25.3 mi. | 737 | 9,636 | 7.6 | $51,297 | 9.8 | 6.6 | 1.2 | 0.1 | 1.1 | |
| 46375 / Schererville / IN / 29.1 mi. | 723 | 7,215 | 10.0 | $59,975 | 11.1 | 5.7 | 1.5 | 0.1 | 2.6 | |
| 60471 / Richton Park / IL / 29.4 mi. | 719 | 4,692 | 15.3 | $48,248 | 65.7 | 3.8 | 58.4 | 0.2 | 1.5 | |
| 46304 / Chesterton / IN / 35.3 mi. | 719 | 8,073 | 8.9 | $54,812 | 6.2 | 3.5 | 0.5 | 0.3 | 0.9 | |
| 46410 / Merrillville / IN / 32 mi. | 718 | 12,574 | 5.7 | $48,191 | 37.5 | 9.4 | 24.9 | 0.2 | 1.4 | |
| 60155 / Broadview / IL / 12.4 mi. | 705 | 3,192 | 22.1 | $47,726 | 79.7 | 3.9 | 72.7 | 0.1 | 1.3 | |
| 60653 / Chicago / IL / 5.2 mi. | 697 | 12,898 | 5.4 | $14,205 | 99.3 | 0.8 | 97.5 | 0.1 | 0.1 | |
| 60425 / Glenwood / IL / 24.4 mi. | 694 | 3,377 | 20.6 | $53,654 | 51.0 | 5.0 | 44.2 | 0.0 | 0.7 | |
| 60171 / River Grove / IL / 11.5 mi. | 666 | 4,361 | 15.3 | $40,783 | 13.1 | 9.7 | 0.3 | 0.1 | 2.1 | |
| 60827 / Riverdale / IL / 17.3 mi. | 655 | 10,772 | 6.1 | $32,118 | 93.1 | 3.6 | 88.3 | 0.1 | 0.1 | |
| 60461 / Olympia Fields / IL / 26.3 mi. | 654 | 1,655 | 39.5 | $94,394 | 58.5 | 1.8 | 52.1 | 0.0 | 3.5 | |
| 60538 / Montgomery / IL / 38 mi. | 643 | 5,049 | 12.7 | $57,021 | 15.2 | 10.8 | 2.3 | 0.3 | 0.7 | |
| 60560 / Yorkville / IL / 46.7 mi. | 638 | 4,035 | 15.8 | $65,949 | 4.5 | 2.9 | 0.4 | 0.2 | 0.5 | |
| 60162 / Hillside / IL / 14.5 mi. | 624 | 3,119 | 20.0 | $49,867 | 56.7 | 13.2 | 36.6 | 0.1 | 5.1 | |
| 60415 / Chicago Ridge / IL / 15.7 mi. | 620 | 5,661 | 11.0 | $44,035 | 14.7 | 6.0 | 2.6 | 0.2 | 1.5 | |
| 46311 / Dyer / IN / 30.4 mi. | 620 | 5,873 | 10.6 | $63,307 | 7.7 | 4.9 | 0.5 | 0.1 | 1.4 | |
| 46327 / Hammond / IN / 18.7 mi. | 606 | 4,396 | 13.8 | $31,155 | 43.6 | 37.4 | 3.6 | 0.3 | 0.5 | |
| 60534 / Lyons / IL / 11.8 mi. | 604 | 4,005 | 15.1 | $43,993 | 21.3 | 16.3 | 0.9 | 0.1 | 1.4 | |
| 46408 / Gary / IN / 27.4 mi. | 602 | 7,350 | 8.2 | $36,543 | 64.6 | 7.4 | 55.1 | 0.2 | 0.3 | |
| 60083 / Wadsworth / IL / 41.2 mi. | 593 | 1,896 | 31.3 | $90,247 | 10.7 | 4.2 | 2.9 | 0.2 | 2.1 | |
| 60033 / Harvard / IL / 62.2 mi. | 583 | 4,445 | 13.1 | $50,462 | 27.6 | 25.3 | 0.4 | 0.2 | 1.1 | |
| 46368 / Portage / IN / 31.5 mi. | 580 | 13,645 | 4.3 | $48,021 | 12.9 | 9.6 | 1.4 | 0.2 | 0.6 | |
| 60064 / North Chicago / IL / 32.4 mi. | 577 | 4,939 | 11.7 | $33,248 | 87.0 | 27.6 | 56.1 | 0.1 | 1.6 | |
| 60020 / Fox Lake / IL / 44.8 mi. | 557 | 2,854 | 19.5 | $41,726 | 9.4 | 6.7 | 0.7 | 0.2 | 0.7 | |
| 60455 / Bridgeview / IL / 14.4 mi. | 557 | 5,917 | 9.4 | $42,917 | 18.1 | 9.6 | 0.8 | 0.2 | 2.2 | |
| 60081 / Spring Grove / IL / 49.1 mi. | 549 | 2,958 | 18.6 | $66,760 | 4.2 | 2.5 | 0.2 | 0.1 | 0.6 | |
| 60104 / Bellwood / IL / 13.3 mi. | 549 | 6,439 | 8.5 | $52,693 | 91.3 | 7.7 | 81.4 | 0.1 | 1.0 | |
| 46342 / Hobart / IN / 32.4 mi. | 549 | 11,375 | 4.8 | $46,212 | 12.1 | 9.1 | 1.2 | 0.3 | 0.5 | |
| 46394 / Whiting / IN / 16.2 mi. | 547 | 5,329 | 10.3 | $37,333 | 21.5 | 19.7 | 0.3 | 0.1 | 0.4 | |
| 60119 / Elburn / IL / 43.6 mi. | 522 | 2,692 | 19.4 | $79,159 | 4.1 | 2.4 | 0.1 | 0.2 | 0.6 | |
| 46324 / Hammond / IN / 22.4 mi. | 518 | 9,040 | 5.7 | $37,547 | 28.3 | 17.0 | 9.1 | 0.2 | 0.5 | |
| 60482 / Worth / IL / 16.6 mi. | 515 | 4,555 | 11.3 | $42,774 | 10.5 | 6.0 | 1.3 | 0.1 | 1.2 | |
| 60301 / Oak Park / IL / 9.3 mi. | 503 | 1,302 | 38.6 | $60,399 | 36.0 | 4.5 | 19.4 | 0.1 | 9.4 | |
| 60043 / Kenilworth / IL / 14.3 mi. | 497 | 835 | 59.5 | $200,001 | 4.0 | 1.3 | 0.2 | 0.0 | 2.4 | |
| 60042 / Island Lake / IL / 39.8 mi. | 494 | 3,082 | 16.0 | $62,917 | 11.2 | 8.2 | 0.7 | 0.1 | 1.5 | |
| 60041 / Ingleside / IL / 42.7 mi. | 491 | 3,393 | 14.5 | $59,874 | 6.3 | 4.2 | 0.4 | 0.2 | 0.7 | |
| 60633 / Chicago / IL / 16.9 mi. | 478 | 5,077 | 9.4 | $40,792 | 44.3 | 22.8 | 18.6 | 0.2 | 0.6 | |
| 60021 / Fox River Grove / IL / 37.3 mi. | 471 | 2,055 | 22.9 | $64,403 | 7.2 | 3.9 | 0.4 | 0.1 | 1.8 | |
| 60478 / Country Club Hills / IL / 23.8 mi. | 462 | 5,289 | 8.7 | $57,218 | 85.0 | 1.7 | 80.5 | 0.1 | 0.9 | |
| 60480 / Willow Springs / IL / 18.1 mi. | 446 | 1,824 | 24.5 | $56,563 | 9.8 | 5.4 | 0.6 | 0.1 | 1.9 | |
| 60449 / Monee / IL / 34.4 mi. | 445 | 2,126 | 20.9 | $64,821 | 7.9 | 3.4 | 2.4 | 0.1 | 0.5 | |
| 60140 / Hampshire / IL / 48.2 mi. | 418 | 2,497 | 16.7 | $63,380 | 4.5 | 3.4 | 0.1 | 0.1 | 0.3 | |
| 60501 / Summit Argo / IL / 12.8 mi. | 414 | 3,554 | 11.6 | $39,063 | 60.6 | 46.4 | 11.3 | 0.2 | 1.4 | |
| 60152 / Marengo / IL / 56.9 mi. | 403 | 3,958 | 10.2 | $60,024 | 10.5 | 9.2 | 0.3 | 0.2 | 0.3 | |
| 60096 / Winthrop Harbor / IL / 41.7 mi. | 400 | 2,426 | 16.5 | $64,159 | 8.6 | 4.4 | 0.6 | 0.4 | 1.9 | |
| 46312 / East Chicago / IN / 19.3 mi. | 397 | 11,692 | 3.4 | $26,543 | 88.0 | 51.6 | 35.2 | 0.2 | 0.2 | |
| 60554 / Sugar Grove / IL / 43.3 mi. | 391 | 1,592 | 24.6 | $72,991 | 7.4 | 4.7 | 1.3 | 0.0 | 0.5 | |
| 60475 / Steger / IL / 29.3 mi. | 387 | 3,619 | 10.7 | $43,133 | 17.1 | 8.3 | 6.3 | 0.2 | 0.6 | |
| 60163 / Berkeley / IL / 15.1 mi. | 384 | 1,864 | 20.6 | $59,922 | 48.4 | 15.7 | 27.8 | 0.1 | 3.5 | |
| 60040 / Highwood / IL / 23.5 mi. | 380 | 1,897 | 20.0 | $44,340 | 55.8 | 51.3 | 1.4 | 0.2 | 2.2 | |
| 60458 / Justice / IL / 14.9 mi. | 370 | 5,318 | 7.0 | $47,249 | 29.9 | 7.4 | 17.1 | 0.1 | 1.6 | |
| 60410 / Channahon / IL / 44.2 mi. | 364 | 2,385 | 15.3 | $70,770 | 5.4 | 3.7 | 0.4 | 0.1 | 0.3 | |
| 60097 / Wonder Lake / IL / 51.2 mi. | 362 | 3,669 | 9.9 | $55,278 | 6.3 | 4.5 | 0.2 | 0.2 | 0.6 | |
| 60481 / Wilmington / IL / 45.6 mi. | 355 | 4,337 | 8.2 | $50,509 | 3.6 | 1.9 | 0.4 | 0.4 | 0.2 | |
| 46323 / Hammond / IN / 22.7 mi. | 351 | 9,265 | 3.8 | $40,229 | 29.8 | 16.6 | 11.0 | 0.2 | 0.6 | |
| 60442 / Manhattan / IL / 37 mi. | 320 | 2,036 | 15.7 | $62,944 | 3.6 | 2.3 | 0.4 | 0.1 | 0.2 | |
| 60071 / Richmond / IL / 52.8 mi. | 315 | 1,041 | 30.3 | $63,281 | 4.1 | 2.9 | 0.3 | 0.1 | 0.3 | |
| 60401 / Beecher / IL / 38.1 mi. | 315 | 2,168 | 14.5 | $49,500 | 3.7 | 2.1 | 0.2 | 0.1 | 0.2 | |
| 46319 / Griffith / IN / 28 mi. | 315 | 7,458 | 4.2 | $49,181 | 19.5 | 8.2 | 9.1 | 0.3 | 0.8 | |
| 60088 / Great Lakes / IL / 31 mi. | 311 | 2,032 | 15.3 | $39,299 | 41.1 | 10.2 | 20.3 | 0.9 | 5.8 | |
| 60468 / Peotone / IL / 39.3 mi. | 302 | 1,903 | 15.9 | $58,000 | 3.9 | 2.0 | 0.8 | 0.1 | 0.4 | |
| 60545 / Plano / IL / 49.6 mi. | 295 | 2,577 | 11.4 | $52,227 | 22.2 | 20.4 | 0.3 | 0.2 | 0.4 | |
| 46403 / Gary / IN / 25.8 mi. | 294 | 5,948 | 4.9 | $37,800 | 82.0 | 5.3 | 74.3 | 0.1 | 0.2 | |
| 46373 / Saint John / IN / 31.7 mi. | 280 | 2,782 | 10.1 | $70,250 | 5.5 | 4.0 | 0.1 | 0.2 | 0.5 | |
| 60433 / Joliet / IL / 35.3 mi. | 266 | 5,738 | 4.6 | $40,837 | 58.8 | 15.1 | 42.2 | 0.1 | 0.2 | |
| 60184 / Wayne / IL / 32.7 mi. | 260 | 251 | 103.6 | $93,785 | 6.6 | 2.9 | 0.6 | 0.0 | 1.9 | |
| 60456 / Hometown / IL / 12.6 mi. | 258 | 1,883 | 13.7 | $38,521 | 6.0 | 3.7 | 0.1 | 0.2 | 0.5 | |
| 60157 / Medinah / IL / 22.6 mi. | 224 | 730 | 30.7 | $81,251 | 7.3 | 3.7 | 0.7 | 0.1 | 1.9 | |
| 60432 / Joliet / IL / 32.9 mi. | 212 | 5,737 | 3.7 | $34,146 | 78.3 | 46.4 | 30.4 | 0.2 | 0.3 | |
| 60192 / Schaumburg / IL / 25.6 mi. | 211 | 517 | 40.8 | $118,431 | 29.5 | 5.8 | 1.5 | 0.1 | 21.1 | |
| 46405 / Lake Station / IN / 28.7 mi. | 192 | 4,599 | 4.2 | $37,436 | 24.5 | 21.7 | 0.8 | 0.3 | 0.3 | |
| 60151 / Maple Park / IL / 49.4 mi. | 182 | 1,231 | 14.8 | $63,447 | 3.5 | 1.9 | 0.3 | 0.2 | 0.4 | |
| 46320 / Hammond / IN / 20.9 mi. | 180 | 6,102 | 2.9 | $25,894 | 66.7 | 23.6 | 40.6 | 0.2 | 0.3 | |
| 60476 / Thornton / IL / 22.6 mi. | 174 | 1,014 | 17.2 | $46,694 | 6.3 | 4.1 | 1.1 | 0.1 | 0.2 | |
| 46303 / Cedar Lake / IN / 36.7 mi. | 161 | 4,210 | 3.8 | $47,292 | 4.6 | 3.3 | 0.1 | 0.2 | 0.2 | |
| 46341 / Hebron / IN / 45.2 mi. | 139 | 3,446 | 4.0 | $52,047 | 4.5 | 2.9 | 0.4 | 0.2 | 0.2 | |
| 60421 / Elwood / IL / 40.4 mi. | 138 | 1,294 | 10.7 | $60,775 | 6.0 | 3.5 | 1.2 | 0.3 | 0.5 | |
| 46356 / Lowell / IN / 45.1 mi. | 136 | 5,134 | 2.6 | $52,633 | 4.5 | 3.1 | 0.1 | 0.2 | 0.2 | |
| 46404 / Gary / IN / 24.6 mi. | 127 | 7,948 | 1.6 | $26,691 | 99.0 | 1.5 | 96.5 | 0.2 | 0.1 | |
| 60408 / Braidwood / IL / 54.5 mi. | 126 | 1,743 | 7.2 | $55,337 | 4.1 | 2.9 | 0.1 | 0.1 | 0.3 | |
| 60469 / Posen / IL / 18.8 mi. | 116 | 1,620 | 7.2 | $48,636 | 33.7 | 22.6 | 8.8 | 0.2 | 0.2 | |
| 60029 / Golf / IL / 14.3 mi. | 109 | 125 | 87.2 | $138,669 | 2.0 | 0.9 | 0.0 | 0.0 | 1.1 | |
| 46402 / Gary / IN / 24.8 mi. | 101 | 3,361 | 3.0 | $18,759 | 96.9 | 6.7 | 88.6 | 0.1 | 0.1 | |
| 60141 / Hines / IL / 11.5 mi. | 100 | 8 | 1250.0 | $0 | 55.9 | 6.5 | 49.0 | 0.0 | 0.0 | |
| 60165 / Stone Park / IL / 13.5 mi. | 93 | 1,265 | 7.4 | $38,720 | 83.2 | 78.8 | 1.6 | 0.3 | 1.8 | |
| 60511 / Big Rock / IL / 48.3 mi. | 93 | 648 | 14.4 | $72,622 | 4.6 | 2.8 | 0.3 | 0.2 | 0.2 | |
| 46406 / Gary / IN / 23.2 mi. | 83 | 4,320 | 1.9 | $27,574 | 73.7 | 11.8 | 60.5 | 0.2 | 0.1 | |
| File | il_chicago_tribune | |||||||||
| Time | 5/17/05 6:29 PM | |||||||||
| Page | 8 | |||||||||
| Member | 111100 | |||||||||