
|
| Comparing the racial diversity of the journalists | ||||||||||
| at America's daily newspapers | ||||||||||
| with the communities that they serve | ||||||||||
| Newsroom diversity report for | ||||||||||
| Belleville News-Democrat | ||||||||||
| Belleville, Illinois | ||||||||||
| Owner: Knight Ridder (Calif.) | ||||||||||
| From a report for the Knight Foundation | ||||||||||
| by Bill Dedman and Stephen K. Doig, June 2005 | ||||||||||
| Click here to read the national report or to select another newspaper | ||||||||||
| Year | Non-white % of newsroom staff | 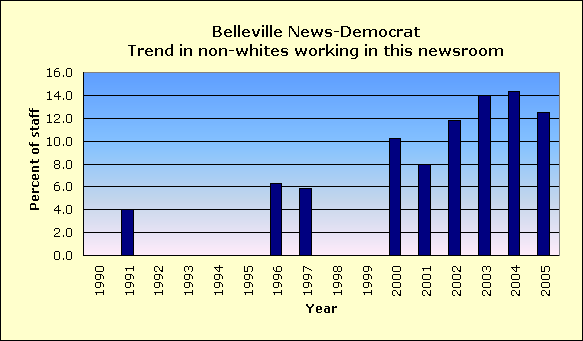
|
||||||||
| 2005 | 12.5 | |||||||||
| 2004 | 14.3 | |||||||||
| 2003 | 14.0 | |||||||||
| 2002 | 11.8 | |||||||||
| 2001 | 8.0 | |||||||||
| 2000 | 10.2 | |||||||||
| 1999 | Did not report | |||||||||
| 1998 | Did not report | |||||||||
| 1997 | 5.9 | |||||||||
| 1996 | 6.3 | |||||||||
| 1995 | Did not report | |||||||||
| 1994 | Did not report | |||||||||
| 1993 | Did not report | |||||||||
| 1992 | Did not report | |||||||||
| 1991 | 4.0 | |||||||||
| 1990 | Did not report | |||||||||
| The latest year at peak is | 2004 | |||||||||
| See the notes and definitions section below for the sources of these figures. | ||||||||||
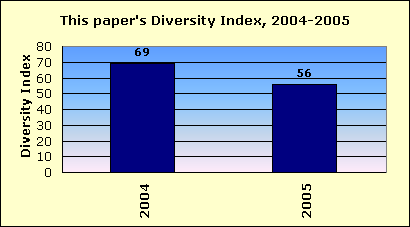
| Newsroom Diversity Index | ||||||||||
| for Belleville News-Democrat | ||||||||||
 |
||||||||||
| Year | Non-white % of newsroom staff | Non-white % of circulation area | Newsroom Diversity Index (parity=100) | |||||||
| 2005 | 12.5 | 22.3 | 56 | |||||||
| 2004 | 14.3 | 20.6 | 69 | |||||||
| How the index is calculated | ||||||||||
| The Newsroom Diversity Index is the non-white percentage of the newsroom staff | ||||||||||
| divided by the non-white percentage of residents in the circulation area. | ||||||||||
| (Parity = 100.) | ||||||||||
| Company index | ||||||||||
| This newspaper's owner, Knight Ridder (Calif.), | ||||||||||
| has a companywide, circulation-weighted Diversity Index of 76. | ||||||||||
| See the notes and definitions section below for the sources of these figures. | ||||||||||
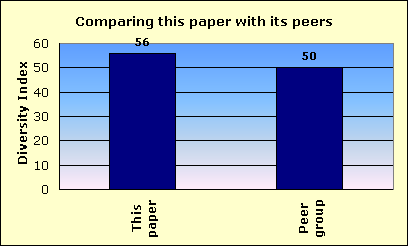
| Peer group comparison | ||||||||||
| for Belleville News-Democrat | ||||||||||
 |
||||||||||
| This newspaper's Newsroom Diversity Index is 56. | This paper | |||||||||
| Peer group | ||||||||||
| Compare that with 50, which is the median Diversity Index for all newspapers | ||||||||||
| reporting in this circulation category of 50,001 to 100,000 daily sales. | ||||||||||
| In that group, this newspaper's Diversity Index ranks 39 out of 90 | ||||||||||
| newspapers reporting in the category of 50,001 to 100,000 daily sales. | ||||||||||
| An example of a newspaper of similar circulation, in an area of similar level of non-white residents, but one that has a relatively high Diversity Index, is Florida Today, Melbourne, Florida, with a 19.1 percent non-white staff in a community that is 16.3 percent non-white. Its index is 117. | ||||||||||
| FYI, in circulation, this newspaper's average weekday circulation of | ||||||||||
| approximately 53,694 ranks 189 out of 1,410 daily newspapers in the US. | ||||||||||
| See the notes and definitions section below for the sources of these figures. | ||||||||||
| Details on race/ethnicity | ||||||||||
| in the circulation area | ||||||||||
| and the home county | ||||||||||
| of Belleville News-Democrat | ||||||||||
| Circulation area | ||||||||||
| Race/ethnicity | % of population | Number of residents | 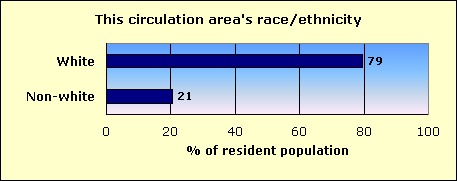
|
|||||||
| Hispanic | 2.0 | 8,810 | ||||||||
| Black | 16.6 | 73,002 | ||||||||
| Asian and Pacific Islander | 0.7 | 3,126 | ||||||||
| Native-American | 0.2 | 1,018 | ||||||||
| Other non-white | 0.1 | 368 | ||||||||
| Multi-racial | 1.0 | 4,204 | ||||||||
| Non-white | 20.6 | 90,528 | ||||||||
| White | 79.4 | 349,232 | ||||||||
| Total | 439,760 | |||||||||
| Home county: St. Clair | ||||||||||
| Race/ethnicity | % of population | Number of residents | 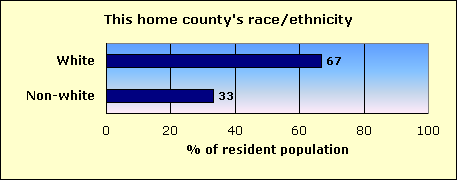
|
|||||||
| Hispanic | 2.2 | 5,604 | ||||||||
| Black | 28.6 | 73,282 | ||||||||
| Asian and Pacific Islander | 0.9 | 2,362 | ||||||||
| Native-American | 0.2 | 577 | ||||||||
| Other non-white | 0.1 | 265 | ||||||||
| Multi-racial | 1.1 | 2,841 | ||||||||
| Non-white | 33.2 | 84,931 | ||||||||
| White | 66.8 | 171,151 | ||||||||
| Total | 256,082 | |||||||||
| The home county of this newspaper is St. Clair. | ||||||||||
| About this report | ||||||||||
| This third annual report for the Knight Foundation adds context to an annual survey by the American Society of Newspaper Editors. ASNE has set a goal that | ||||||||||
| every newspaper, to help it know its community and gather the news, should employ at least one non-white journalist, and that newspapers should strive to | ||||||||||
| employ non-whites in proportion to their share of the community. ASNE's report, at www.asne.org, shows each newspaper's non-white employment, but does | ||||||||||
| not disclose how closely that employment mirrors the newspaper's circulation area. | ||||||||||
| That gap is filled by the report you are reading now. This report was not done by ASNE, but was done for the Knight Foundation by Bill Dedman and | ||||||||||
| Stephen K. Doig. It shows how close each newspaper is to ASNE's goal, by comparing the newsroom staffing with the circulation area population. | ||||||||||
| The full report is at www.powerreporting.com/knight. | ||||||||||
| Notes and definitions | ||||||||||
| 1. The Newsroom Diversity Index is the non-white percentage of the newsroom staff divided by the non-white percentage of the circulation area's residents. Parity = 100. | ||||||||||
| 2. Source for staffing: Survey by American Society of Newspaper Editors, April 2005. Newspapers report non-white staff as of the end of the previous year. | ||||||||||
| 3. Following ASNE's definition, newsroom staff includes only supervisors, reporters, editors, copy/layout editors and photographers. | ||||||||||
| 4. Also following ASNE's definition, "whites," "blacks," etc., exclude Hispanics, who are counted in a separate category. | ||||||||||
| 5. Source for boundaries of this newspaper's circulation area: ZIP Code circulation data, Audit Bureau of Circulations, latest available. | ||||||||||
| 6. A paper may define its circulation area differently for marketing efforts, or news coverage, or to set advertising rates. | ||||||||||
| 7. If ZIP Codes or counties are used, this report applies a threshold: 10 percent household penetration is required to include an area in the circulation area. | ||||||||||
| 8. Source for the demographics of residents of that circulation area: US Census 2000. | ||||||||||
| 9. Source for total circulation: Editor & Publisher magazine, Monday-Friday average at year-end 2004. | ||||||||||
| 10. Staff of non-English publications, such as the Miami Herald's El Nuevo Herald, are excluded from the ASNE staffing survey for the first time this year. | ||||||||||
| Demographics of ZIP Codes | ||||||||||
| where sales were reported by | ||||||||||
| Belleville News-Democrat | ||||||||||
| Note that some ZIP Codes listed here may not have been included in determining the newspaper's circulation area. In calculating the Diversity Index, a | ||||||||||
| ZIP Code was included only if the household penetration was at least 10 percent. Any lower-penetration ZIP Codes are also listed here for your information. | ||||||||||
| Also, if the newspaper reported more than 300 ZIP Codes, only the top 300 in weekday sales are listed here. | ||||||||||
| ZIP / City / State / Approx. distance in miles from the newspaper's home office | Weekday sales | Households | Penetration % (daily sales per 100 households) | Median household income | Non-white % of population |
Hispanic % of population |
Black % of population |
Native % of population |
Asian % of population |
|
| 62226 / Swansea / IL / 4.9 mi. | 4,802 | 11,360 | 42.3 | $39,493 | 18.5 | 1.6 | 14.4 | 0.2 | 1.2 | |
| 62221 / Swansea / IL / 4.2 mi. | 3,754 | 8,925 | 42.1 | $45,230 | 23.7 | 2.4 | 17.6 | 0.2 | 1.8 | |
| 62220 / Swansea / IL / 2.9 mi. | 3,747 | 7,834 | 47.8 | $37,395 | 15.2 | 1.7 | 11.0 | 0.2 | 0.8 | |
| 62269 / Shiloh / IL / 8.6 mi. | 3,614 | 9,924 | 36.4 | $55,339 | 17.5 | 2.3 | 10.9 | 0.2 | 2.4 | |
| 62223 / Swansea / IL / 5.9 mi. | 3,558 | 7,162 | 49.7 | $47,606 | 15.6 | 1.1 | 12.8 | 0.3 | 0.5 | |
| 62234 / State Park Place / IL / 14.1 mi. | 3,312 | 13,165 | 25.2 | $43,865 | 8.9 | 2.5 | 4.8 | 0.3 | 0.5 | |
| 62208 / Fairview Heights / IL / 8.5 mi. | 2,727 | 5,939 | 45.9 | $47,222 | 22.4 | 2.0 | 17.0 | 0.2 | 1.8 | |
| 62040 / Pontoon Beach / IL / 17.6 mi. | 2,080 | 18,435 | 11.3 | $37,096 | 7.1 | 2.4 | 2.6 | 0.4 | 0.5 | |
| 62206 / East Saint Louis / IL / 10.9 mi. | 1,540 | 6,299 | 24.4 | $29,899 | 45.1 | 2.1 | 40.9 | 0.3 | 0.4 | |
| 62258 / Mascoutah / IL / 11 mi. | 1,150 | 2,756 | 41.7 | $46,765 | 7.5 | 1.7 | 3.2 | 0.3 | 0.8 | |
| 62298 / Waterloo / IL / 12 mi. | 1,110 | 5,149 | 21.6 | $51,431 | 1.6 | 0.7 | 0.0 | 0.2 | 0.3 | |
| 62260 / Millstadt / IL / 5.6 mi. | 1,079 | 2,287 | 47.2 | $54,273 | 2.3 | 0.6 | 0.5 | 0.3 | 0.2 | |
| 62205 / Washingtn Park / IL / 12 mi. | 1,046 | 3,807 | 27.5 | $26,092 | 98.9 | 0.7 | 97.6 | 0.1 | 0.0 | |
| 62249 / Highland / IL / 23.4 mi. | 1,031 | 5,130 | 20.1 | $49,624 | 2.0 | 1.0 | 0.1 | 0.1 | 0.4 | |
| 62243 / Freeburg / IL / 4.7 mi. | 1,022 | 1,952 | 52.4 | $53,173 | 2.6 | 1.5 | 0.2 | 0.2 | 0.3 | |
| 62294 / Troy / IL / 16.4 mi. | 994 | 4,438 | 22.4 | $58,876 | 4.8 | 1.4 | 1.2 | 0.2 | 0.7 | |
| 62201 / Sauget / IL / 14.2 mi. | 991 | 3,122 | 31.7 | $12,822 | 85.6 | 16.7 | 68.0 | 0.2 | 0.1 | |
| 62204 / Washington Park / IL / 12.2 mi. | 891 | 3,432 | 26.0 | $18,000 | 96.7 | 1.6 | 94.3 | 0.2 | 0.1 | |
| 62232 / Hollywood Height / IL / 10.9 mi. | 888 | 2,758 | 32.2 | $36,406 | 11.1 | 3.3 | 5.8 | 0.3 | 0.7 | |
| 62203 / East Saint Louis / IL / 9.7 mi. | 882 | 3,269 | 27.0 | $29,872 | 94.9 | 1.1 | 92.9 | 0.2 | 0.1 | |
| 62025 / Holiday Shores / IL / 22 mi. | 802 | 10,629 | 7.5 | $51,657 | 11.2 | 0.9 | 7.5 | 0.2 | 1.3 | |
| 62236 / Columbia / IL / 11.5 mi. | 788 | 4,013 | 19.6 | $62,056 | 1.9 | 0.9 | 0.1 | 0.1 | 0.3 | |
| 62207 / East Saint Louis / IL / 10.7 mi. | 759 | 3,534 | 21.5 | $19,776 | 98.2 | 0.5 | 96.7 | 0.1 | 0.1 | |
| 62278 / Ruma / IL / 16.8 mi. | 758 | 2,567 | 29.5 | $45,955 | 1.5 | 0.5 | 0.0 | 0.1 | 0.3 | |
| 62254 / Lebanon / IL / 12.2 mi. | 648 | 1,892 | 34.2 | $42,257 | 17.3 | 1.4 | 13.4 | 0.3 | 0.6 | |
| 62285 / Smithton / IL / 5.1 mi. | 637 | 1,088 | 58.5 | $54,688 | 2.4 | 0.4 | 0.5 | 0.3 | 0.5 | |
| 62264 / New Athens / IL / 10.7 mi. | 575 | 1,226 | 46.9 | $41,974 | 2.3 | 0.7 | 0.5 | 0.2 | 0.4 | |
| 62265 / New Baden / IL / 16.1 mi. | 555 | 1,519 | 36.5 | $49,643 | 4.6 | 1.4 | 1.5 | 0.1 | 0.7 | |
| 62293 / Trenton / IL / 17.6 mi. | 545 | 1,727 | 31.6 | $52,052 | 2.3 | 1.1 | 0.2 | 0.1 | 0.6 | |
| 62230 / Trenton / IL / 24.7 mi. | 509 | 2,082 | 24.4 | $48,279 | 2.0 | 1.2 | 0.1 | 0.0 | 0.3 | |
| 62062 / Maryville / IL / 16.5 mi. | 469 | 1,657 | 28.3 | $55,440 | 7.0 | 1.9 | 3.4 | 0.1 | 0.5 | |
| 62034 / Glen Carbon / IL / 18.9 mi. | 449 | 4,595 | 9.8 | $57,053 | 10.9 | 1.5 | 6.2 | 0.2 | 2.0 | |
| 62239 / Dupo / IL / 11.5 mi. | 409 | 1,887 | 21.7 | $41,853 | 3.1 | 0.7 | 1.0 | 0.3 | 0.3 | |
| 62257 / Marrisa / IL / 17.9 mi. | 388 | 1,512 | 25.7 | $36,838 | 1.7 | 0.6 | 0.2 | 0.1 | 0.2 | |
| 62231 / Shattuc / IL / 32 mi. | 383 | 2,683 | 14.3 | $42,273 | 4.4 | 0.8 | 2.6 | 0.1 | 0.3 | |
| 62060 / Newport / IL / 16.4 mi. | 305 | 2,403 | 12.7 | $23,900 | 57.0 | 1.8 | 53.7 | 0.3 | 0.2 | |
| 62281 / Saint Jacob / IL / 18 mi. | 299 | 632 | 47.3 | $52,262 | 2.8 | 1.5 | 0.3 | 0.3 | 0.1 | |
| 62286 / Sparta / IL / 26.2 mi. | 288 | 2,538 | 11.3 | $34,279 | 15.3 | 1.2 | 12.0 | 0.3 | 0.4 | |
| 62263 / Todds Mill / IL / 31.2 mi. | 264 | 2,128 | 12.4 | $43,000 | 1.9 | 0.9 | 0.2 | 0.1 | 0.3 | |
| 63102 / Saint Louis / MO / 14.8 mi. | 242 | 654 | 37.0 | $37,991 | 43.0 | 1.1 | 37.5 | 0.8 | 2.3 | |
| 62271 / Okawville / IL / 22 mi. | 238 | 822 | 29.0 | $36,906 | 1.4 | 0.3 | 0.3 | 0.4 | 0.1 | |
| 62225 / Scott AFB / IL / 8 mi. | 220 | 1,442 | 15.3 | $43,538 | 26.8 | 5.7 | 15.3 | 0.4 | 2.5 | |
| 62216 / Trenton / IL / 21 mi. | 206 | 377 | 54.6 | $45,234 | 1.7 | 0.3 | 0.5 | 0.1 | 0.2 | |
| 62215 / Damiansville / IL / 19.5 mi. | 184 | 404 | 45.5 | $48,500 | 10.0 | 8.1 | 0.3 | 0.5 | 0.4 | |
| 62245 / Germantown / IL / 21 mi. | 161 | 867 | 18.6 | $51,833 | 1.6 | 1.1 | 0.1 | 0.0 | 0.1 | |
| 62275 / Pocahontas / IL / 31 mi. | 153 | 1,386 | 11.0 | $38,819 | 2.7 | 0.6 | 0.4 | 0.4 | 0.3 | |
| 62246 / Woburn / IL / 39.6 mi. | 140 | 3,158 | 4.4 | $40,346 | 14.4 | 2.0 | 11.1 | 0.5 | 0.4 | |
| 62255 / Lenzburg / IL / 15 mi. | 131 | 411 | 31.9 | $36,912 | 2.3 | 0.9 | 0.9 | 0.1 | 0.1 | |
| 62240 / East Carondelet / IL / 12.6 mi. | 127 | 712 | 17.8 | $44,777 | 3.0 | 0.6 | 1.0 | 0.6 | 0.1 | |
| 62090 / Venice / IL / 16 mi. | 118 | 574 | 20.6 | $17,368 | 91.9 | 0.7 | 90.6 | 0.1 | 0.0 | |
| 62001 / Kaufman / IL / 29 mi. | 114 | 573 | 19.9 | $46,833 | 1.6 | 0.8 | 0.0 | 0.1 | 0.0 | |
| 62295 / Valmeyer / IL / 21.7 mi. | 108 | 330 | 32.7 | $50,568 | 2.0 | 0.7 | 0.1 | 0.4 | 0.4 | |
| 62002 / Alton / IL / 29.5 mi. | 105 | 14,093 | 0.7 | $34,253 | 25.5 | 1.4 | 22.0 | 0.2 | 0.4 | |
| 62214 / Venedy / IL / 20.3 mi. | 104 | 480 | 21.7 | $41,319 | 1.7 | 0.8 | 0.0 | 0.3 | 0.0 | |
| 62061 / Marine / IL / 34.6 mi. | 99 | 559 | 17.7 | $40,647 | 1.9 | 0.6 | 0.1 | 0.2 | 0.1 | |
| 62277 / Prairie du Roche / IL / 25.5 mi. | 97 | 572 | 17.0 | $42,266 | 1.9 | 0.7 | 0.0 | 0.5 | 0.1 | |
| 62218 / Santa Fe / IL / 25.6 mi. | 87 | 480 | 18.1 | $55,185 | 1.6 | 0.1 | 0.1 | 0.0 | 0.2 | |
| 62217 / Baldwin / IL / 19.6 mi. | 81 | 354 | 22.9 | $32,788 | 59.1 | 7.0 | 51.8 | 0.1 | 0.2 | |
| 62233 / Chester / IL / 36.7 mi. | 77 | 2,564 | 3.0 | $40,703 | 4.7 | 0.6 | 2.9 | 0.1 | 0.3 | |
| 62237 / Winkle / IL / 28.9 mi. | 72 | 1,263 | 5.7 | $32,932 | 2.8 | 0.4 | 1.0 | 0.0 | 0.3 | |
| 62219 / Beckemeyer / IL / 29 mi. | 61 | 365 | 16.7 | $36,579 | 3.0 | 1.5 | 0.0 | 0.3 | 0.8 | |
| 62046 / Hamel / IL / 27.9 mi. | 49 | 158 | 31.0 | $43,750 | 2.3 | 0.8 | 0.0 | 0.0 | 0.0 | |
| 62059 / Stites / IL / 15.2 mi. | 46 | 264 | 17.4 | $15,326 | 100.0 | 0.5 | 98.8 | 0.2 | 0.0 | |
| 62242 / Evansville / IL / 24.4 mi. | 46 | 561 | 8.2 | $33,950 | 1.8 | 0.6 | 0.8 | 0.0 | 0.2 | |
| 62289 / Summerfield / IL / 14.3 mi. | 44 | 105 | 41.9 | $42,500 | 4.2 | 1.6 | 0.6 | 1.3 | 0.3 | |
| 62292 / Tilden / IL / 22.4 mi. | 44 | 248 | 17.7 | $35,885 | 2.8 | 1.9 | 0.0 | 0.2 | 0.0 | |
| 62801 / Wamac / IL / 43.2 mi. | 41 | 9,118 | 0.4 | $33,967 | 14.5 | 1.6 | 10.8 | 0.2 | 0.6 | |
| 62024 / Rosewood / IL / 25.2 mi. | 39 | 5,206 | 0.7 | $38,292 | 2.9 | 0.9 | 0.6 | 0.2 | 0.3 | |
| 62095 / Wood River / IL / 26 mi. | 34 | 4,422 | 0.8 | $33,286 | 3.3 | 1.3 | 0.7 | 0.2 | 0.4 | |
| 62244 / Fults / IL / 22.6 mi. | 34 | 410 | 8.3 | $49,201 | 1.4 | 0.5 | 0.0 | 0.0 | 0.4 | |
| 62273 / Pierron / IL / 29 mi. | 32 | 20 | 160.0 | $29,375 | 0.0 | 0.0 | 0.0 | 0.0 | 0.0 | |
| 62266 / New Memphis / IL / 15.3 mi. | 25 | 43 | 58.1 | $54,167 | 7.3 | 1.8 | 0.0 | 2.8 | 0.0 | |
| 62268 / Oakdale / IL / 23.8 mi. | 25 | 291 | 8.6 | $42,212 | 1.9 | 0.8 | 0.0 | 0.3 | 0.0 | |
| 62010 / Fort Russell / IL / 28.6 mi. | 23 | 4,165 | 0.6 | $45,173 | 2.8 | 1.0 | 0.7 | 0.2 | 0.4 | |
| 62250 / Hoffman / IL / 36.6 mi. | 16 | 183 | 8.7 | $42,019 | 2.2 | 0.4 | 0.2 | 0.4 | 0.4 | |
| File | il_belleville_news-democrat | |||||||||
| Time | 5/20/05 6:08 PM | |||||||||
| Page | 189 | |||||||||
| Member | 110250 | |||||||||