
|
| Comparing the racial diversity of the journalists | ||||||||||
| at America's daily newspapers | ||||||||||
| with the communities that they serve | ||||||||||
| Newsroom diversity report for | ||||||||||
| Rome News-Tribune | ||||||||||
| Rome, Georgia | ||||||||||
| From a report for the Knight Foundation | ||||||||||
| by Bill Dedman and Stephen K. Doig, June 2005 | ||||||||||
| Click here to read the national report or to select another newspaper | ||||||||||
| Year | Non-white % of newsroom staff | 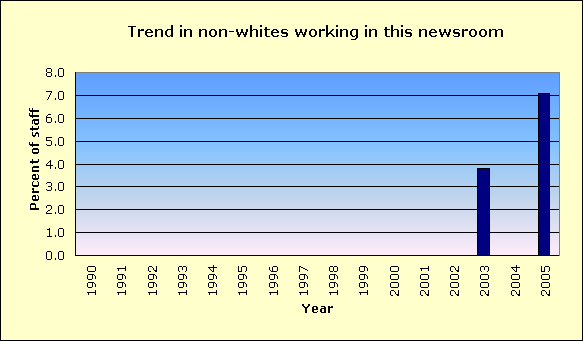
|
||||||||
| 2005 | 7.1 | |||||||||
| 2004 | Did not report | |||||||||
| 2003 | 3.8 | |||||||||
| 2002 | 0.0 | |||||||||
| 2001 | 0.0 | |||||||||
| 2000 | 0.0 | |||||||||
| 1999 | 0.0 | |||||||||
| 1998 | 0.0 | |||||||||
| 1997 | Did not report | |||||||||
| 1996 | Did not report | |||||||||
| 1995 | Did not report | |||||||||
| 1994 | Did not report | |||||||||
| 1993 | Did not report | |||||||||
| 1992 | Did not report | |||||||||
| 1991 | Did not report | |||||||||
| 1990 | Did not report | |||||||||
| The latest year at peak is | 2005 | |||||||||
| See the notes and definitions section below for the sources of these figures. | ||||||||||
| Newsroom Diversity Index | ||||||||||
| for Rome News-Tribune | ||||||||||
| Year | Non-white % of newsroom staff | Non-white % of circulation area | Newsroom Diversity Index (parity=100) | |||||||
| 2005 | 7.1 | 21.6 | 33 | |||||||
| 2004 | N/A | 21.6 | N/A | |||||||
| How the index is calculated | ||||||||||
| The Newsroom Diversity Index is the non-white percentage of the newsroom staff | ||||||||||
| divided by the non-white percentage of residents in the circulation area. | ||||||||||
| (Parity = 100.) | ||||||||||
| See the notes and definitions section below for the sources of these figures. | ||||||||||
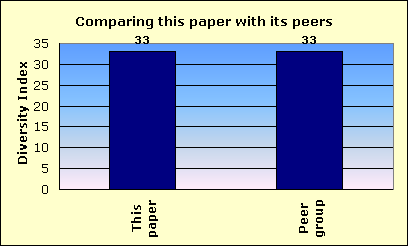
| Peer group comparison | ||||||||||
| for Rome News-Tribune | ||||||||||
 |
||||||||||
| This newspaper's Newsroom Diversity Index is 33. | This paper | |||||||||
| Peer group | ||||||||||
| Compare that with 33, which is the median Diversity Index for all newspapers | ||||||||||
| reporting in this circulation category of 10,001 to 25,000 daily sales. | ||||||||||
| In that group, this newspaper's Diversity Index ranks 128 out of 259 | ||||||||||
| newspapers reporting in the category of 10,001 to 25,000 daily sales. | ||||||||||
| An example of a newspaper of similar circulation, in an area of similar level of non-white residents, but one that has a relatively high Diversity Index, is Enterprise Ledger, Alabama, with a 16.7 percent non-white staff in a community that is 24.4 percent non-white. Its index is 68. | ||||||||||
| FYI, in circulation, this newspaper's average weekday circulation of | ||||||||||
| approximately 18,582 ranks 513 out of 1,410 daily newspapers in the US. | ||||||||||
| See the notes and definitions section below for the sources of these figures. | ||||||||||
| Details on race/ethnicity | ||||||||||
| in the circulation area | ||||||||||
| and the home county | ||||||||||
| of Rome News-Tribune | ||||||||||
| Circulation area | ||||||||||
| Race/ethnicity | % of population | Number of residents | 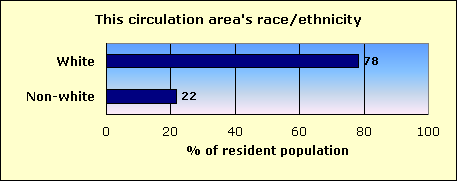
|
|||||||
| Hispanic | 6.6 | 7,796 | ||||||||
| Black | 13.1 | 15,409 | ||||||||
| Asian and Pacific Islander | 0.8 | 945 | ||||||||
| Native-American | 0.2 | 262 | ||||||||
| Other non-white | 0.1 | 88 | ||||||||
| Multi-racial | 0.8 | 950 | ||||||||
| Non-white | 21.6 | 25,450 | ||||||||
| White | 78.4 | 92,295 | ||||||||
| Total | 117,745 | |||||||||
| Home county: Floyd | ||||||||||
| Race/ethnicity | % of population | Number of residents | 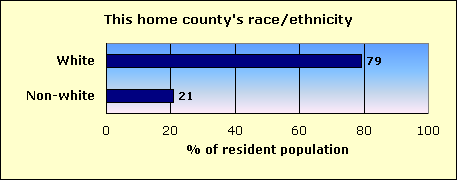
|
|||||||
| Hispanic | 5.5 | 4,983 | ||||||||
| Black | 13.2 | 11,984 | ||||||||
| Asian and Pacific Islander | 1.0 | 877 | ||||||||
| Native-American | 0.2 | 204 | ||||||||
| Other non-white | 0.1 | 63 | ||||||||
| Multi-racial | 0.9 | 780 | ||||||||
| Non-white | 20.9 | 18,891 | ||||||||
| White | 79.1 | 71,674 | ||||||||
| Total | 90,565 | |||||||||
| The home county of this newspaper is Floyd. | ||||||||||
| About this report | ||||||||||
| This third annual report for the Knight Foundation adds context to an annual survey by the American Society of Newspaper Editors. ASNE has set a goal that | ||||||||||
| every newspaper, to help it know its community and gather the news, should employ at least one non-white journalist, and that newspapers should strive to | ||||||||||
| employ non-whites in proportion to their share of the community. ASNE's report, at www.asne.org, shows each newspaper's non-white employment, but does | ||||||||||
| not disclose how closely that employment mirrors the newspaper's circulation area. | ||||||||||
| That gap is filled by the report you are reading now. This report was not done by ASNE, but was done for the Knight Foundation by Bill Dedman and | ||||||||||
| Stephen K. Doig. It shows how close each newspaper is to ASNE's goal, by comparing the newsroom staffing with the circulation area population. | ||||||||||
| The full report is at www.powerreporting.com/knight. | ||||||||||
| Notes and definitions | ||||||||||
| 1. The Newsroom Diversity Index is the non-white percentage of the newsroom staff divided by the non-white percentage of the circulation area's residents. Parity = 100. | ||||||||||
| 2. Source for staffing: Survey by American Society of Newspaper Editors, April 2005. Newspapers report non-white staff as of the end of the previous year. | ||||||||||
| 3. Following ASNE's definition, newsroom staff includes only supervisors, reporters, editors, copy/layout editors and photographers. | ||||||||||
| 4. Also following ASNE's definition, "whites," "blacks," etc., exclude Hispanics, who are counted in a separate category. | ||||||||||
| 5. Source for boundaries of this newspaper's circulation area: ZIP Code circulation data, Audit Bureau of Circulations, latest available. | ||||||||||
| 6. A paper may define its circulation area differently for marketing efforts, or news coverage, or to set advertising rates. | ||||||||||
| 7. If ZIP Codes or counties are used, this report applies a threshold: 10 percent household penetration is required to include an area in the circulation area. | ||||||||||
| 8. Source for the demographics of residents of that circulation area: US Census 2000. | ||||||||||
| 9. Source for total circulation: Editor & Publisher magazine, Monday-Friday average at year-end 2004. | ||||||||||
| 10. Staff of non-English publications, such as the Miami Herald's El Nuevo Herald, are excluded from the ASNE staffing survey for the first time this year. | ||||||||||
| Demographics of ZIP Codes | ||||||||||
| where sales were reported by | ||||||||||
| Rome News-Tribune | ||||||||||
| Note that some ZIP Codes listed here may not have been included in determining the newspaper's circulation area. In calculating the Diversity Index, a | ||||||||||
| ZIP Code was included only if the household penetration was at least 10 percent. Any lower-penetration ZIP Codes are also listed here for your information. | ||||||||||
| Also, if the newspaper reported more than 300 ZIP Codes, only the top 300 in weekday sales are listed here. | ||||||||||
| ZIP / City / State / Approx. distance in miles from the newspaper's home office | Weekday sales | Households | Penetration % (daily sales per 100 households) | Median household income | Non-white % of population |
Hispanic % of population |
Black % of population |
Native % of population |
Asian % of population |
|
| 30165 / Rome / GA / 7.3 mi. | 5,878 | 13,788 | 42.6 | $35,476 | 20.5 | 8.1 | 9.5 | 0.2 | 1.7 | |
| 30161 / Rome / GA / 0 mi. | 5,728 | 13,053 | 43.9 | $32,111 | 30.3 | 5.1 | 23.5 | 0.2 | 0.5 | |
| 30125 / Cedartown / GA / 17.8 mi. | 988 | 8,299 | 11.9 | $31,821 | 25.7 | 11.8 | 12.7 | 0.2 | 0.3 | |
| 30147 / Lindale / GA / 5.7 mi. | 744 | 1,718 | 43.3 | $35,558 | 4.7 | 1.7 | 1.3 | 0.2 | 0.4 | |
| 30173 / Silver Creek / GA / 7.6 mi. | 739 | 2,212 | 33.4 | $38,699 | 6.5 | 1.5 | 3.7 | 0.2 | 0.3 | |
| 30747 / Summerville / GA / 18.6 mi. | 427 | 5,798 | 7.4 | $29,775 | 17.8 | 0.9 | 15.7 | 0.1 | 0.1 | |
| 30124 / Cave Spring / GA / 12.8 mi. | 424 | 1,101 | 38.5 | $43,109 | 8.2 | 1.3 | 5.3 | 0.3 | 0.6 | |
| 30153 / Rockmart / GA / 20 mi. | 388 | 5,462 | 7.1 | $35,407 | 16.3 | 1.2 | 13.9 | 0.2 | 0.4 | |
| 30105 / Armuchee / GA / 15.9 mi. | 355 | 910 | 39.0 | $43,229 | 2.7 | 0.7 | 0.7 | 0.2 | 0.4 | |
| 30701 / Calhoun / GA / 23.1 mi. | 297 | 10,836 | 2.7 | $40,280 | 16.5 | 10.1 | 4.6 | 0.2 | 0.7 | |
| 30104 / Aragon / GA / 13.9 mi. | 215 | 1,463 | 14.7 | $36,225 | 9.5 | 1.2 | 7.4 | 0.2 | 0.2 | |
| 30103 / Adairsville / GA / 16.5 mi. | 205 | 4,040 | 5.1 | $37,314 | 9.8 | 1.3 | 6.8 | 0.2 | 0.6 | |
| 30145 / Kingston / GA / 10.3 mi. | 177 | 2,054 | 8.6 | $45,444 | 9.2 | 1.6 | 6.6 | 0.3 | 0.2 | |
| 30733 / Plainville / GA / 14.1 mi. | 93 | 684 | 13.6 | $33,563 | 5.9 | 3.2 | 1.4 | 0.5 | 0.1 | |
| 30730 / Lyerly / GA / 17 mi. | 84 | 730 | 11.5 | $37,065 | 12.6 | 0.6 | 9.7 | 0.4 | 0.0 | |
| 35959 / Cedar Bluff / AL / 29.5 mi. | 59 | 1,813 | 3.3 | $31,725 | 9.0 | 0.7 | 6.8 | 0.3 | 0.1 | |
| 30753 / Trion / GA / 23.1 mi. | 56 | 2,685 | 2.1 | $30,752 | 7.6 | 5.1 | 1.3 | 0.0 | 0.1 | |
| 35960 / Centre / AL / 26.2 mi. | 56 | 3,890 | 1.4 | $30,227 | 9.3 | 0.7 | 7.4 | 0.3 | 0.2 | |
| File | ga_rome_news-tribune | |||||||||
| Time | 5/21/05 11:53 AM | |||||||||
| Page | 512 | |||||||||
| Member | 109380 | |||||||||