
|
| Comparing the racial diversity of the journalists | ||||||||||
| at America's daily newspapers | ||||||||||
| with the communities that they serve | ||||||||||
| Newsroom diversity report for | ||||||||||
| Connecticut Post, Bridgeport | ||||||||||
| Bridgeport, Connecticut | ||||||||||
| Owner: MediaNews Group (Colo.) | ||||||||||
| From a report for the Knight Foundation | ||||||||||
| by Bill Dedman and Stephen K. Doig, June 2005 | ||||||||||
| Click here to read the national report or to select another newspaper | ||||||||||
| Year | Non-white % of newsroom staff | 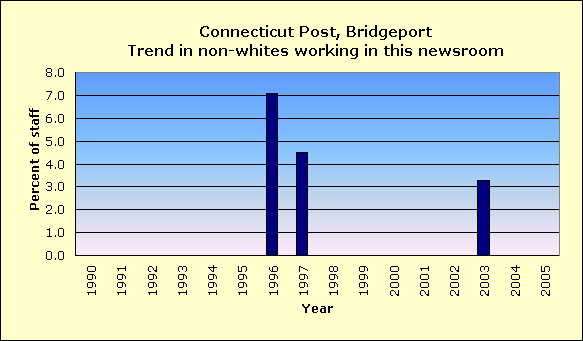
|
||||||||
| 2005 | Did not report | |||||||||
| 2004 | Did not report | |||||||||
| 2003 | 3.3 | |||||||||
| 2002 | Did not report | |||||||||
| 2001 | Did not report | |||||||||
| 2000 | Did not report | |||||||||
| 1999 | Did not report | |||||||||
| 1998 | Did not report | |||||||||
| 1997 | 4.5 | |||||||||
| 1996 | 7.1 | |||||||||
| 1995 | Did not report | |||||||||
| 1994 | Did not report | |||||||||
| 1993 | Did not report | |||||||||
| 1992 | Did not report | |||||||||
| 1991 | Did not report | |||||||||
| 1990 | Did not report | |||||||||
| The latest year at peak is | 1996 | |||||||||
| See the notes and definitions section below for the sources of these figures. | ||||||||||
| Newsroom Diversity Index | ||||||||||
| for Connecticut Post, Bridgeport | ||||||||||
| Year | Non-white % of newsroom staff | Non-white % of circulation area | Newsroom Diversity Index (parity=100) | |||||||
| 2005 | N/A | 28.9 | N/A | |||||||
| 2004 | N/A | 31.0 | N/A | |||||||
| How the index is calculated | ||||||||||
| The Newsroom Diversity Index is the non-white percentage of the newsroom staff | ||||||||||
| divided by the non-white percentage of residents in the circulation area. | ||||||||||
| (Parity = 100.) | ||||||||||
| Company index | ||||||||||
| This newspaper's owner, MediaNews Group (Colo.), | ||||||||||
| has a companywide, circulation-weighted Diversity Index of 47. | ||||||||||
| See the notes and definitions section below for the sources of these figures. | ||||||||||
| Peer group comparison | ||||||||||
| for Connecticut Post, Bridgeport | ||||||||||
| This paper | ||||||||||
| Peer group | ||||||||||
| The median Diversity Index is 50 for all newspapers | ||||||||||
| reporting in this circulation category of 50,001 to 100,000 daily sales. | ||||||||||
| An example of a newspaper of similar circulation, in an area of similar level of non-white residents, but one that has a relatively high Diversity Index, is Beaumont Enterprise, Texas, with a 24 percent non-white staff in a community that is 33.5 percent non-white. Its index is 72. | ||||||||||
| FYI, in circulation, this newspaper's average weekday circulation of | ||||||||||
| approximately 76,212 ranks 131 out of 1,410 daily newspapers in the US. | ||||||||||
| See the notes and definitions section below for the sources of these figures. | ||||||||||
| Details on race/ethnicity | ||||||||||
| in the circulation area | ||||||||||
| and the home county | ||||||||||
| of Connecticut Post, Bridgeport | ||||||||||
| Circulation area | ||||||||||
| Race/ethnicity | % of population | Number of residents | 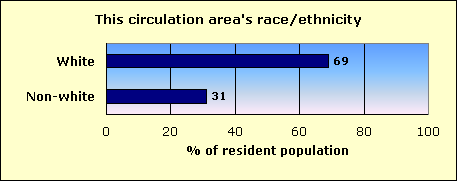
|
|||||||
| Hispanic | 13.8 | 55,574 | ||||||||
| Black | 12.5 | 50,176 | ||||||||
| Asian and Pacific Islander | 2.3 | 9,350 | ||||||||
| Native-American | 0.2 | 683 | ||||||||
| Other non-white | 0.4 | 1,569 | ||||||||
| Multi-racial | 1.8 | 7,408 | ||||||||
| Non-white | 31.0 | 124,760 | ||||||||
| White | 69.0 | 277,359 | ||||||||
| Total | 402,119 | |||||||||
| Home county: Fairfield | ||||||||||
| Race/ethnicity | % of population | Number of residents | 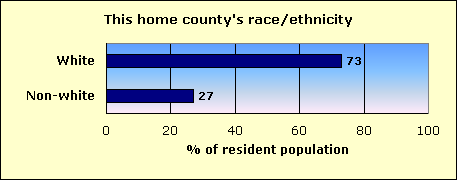
|
|||||||
| Hispanic | 11.9 | 104,835 | ||||||||
| Black | 9.6 | 84,724 | ||||||||
| Asian and Pacific Islander | 3.3 | 28,719 | ||||||||
| Native-American | 0.1 | 1,045 | ||||||||
| Other non-white | 0.4 | 3,396 | ||||||||
| Multi-racial | 1.7 | 14,696 | ||||||||
| Non-white | 26.9 | 237,415 | ||||||||
| White | 73.1 | 645,152 | ||||||||
| Total | 882,567 | |||||||||
| The home county of this newspaper is Fairfield. | ||||||||||
| About this report | ||||||||||
| This third annual report for the Knight Foundation adds context to an annual survey by the American Society of Newspaper Editors. ASNE has set a goal that | ||||||||||
| every newspaper, to help it know its community and gather the news, should employ at least one non-white journalist, and that newspapers should strive to | ||||||||||
| employ non-whites in proportion to their share of the community. ASNE's report, at www.asne.org, shows each newspaper's non-white employment, but does | ||||||||||
| not disclose how closely that employment mirrors the newspaper's circulation area. | ||||||||||
| That gap is filled by the report you are reading now. This report was not done by ASNE, but was done for the Knight Foundation by Bill Dedman and | ||||||||||
| Stephen K. Doig. It shows how close each newspaper is to ASNE's goal, by comparing the newsroom staffing with the circulation area population. | ||||||||||
| The full report is at www.powerreporting.com/knight. | ||||||||||
| Notes and definitions | ||||||||||
| 1. The Newsroom Diversity Index is the non-white percentage of the newsroom staff divided by the non-white percentage of the circulation area's residents. Parity = 100. | ||||||||||
| 2. Source for staffing: Survey by American Society of Newspaper Editors, April 2005. Newspapers report non-white staff as of the end of the previous year. | ||||||||||
| 3. Following ASNE's definition, newsroom staff includes only supervisors, reporters, editors, copy/layout editors and photographers. | ||||||||||
| 4. Also following ASNE's definition, "whites," "blacks," etc., exclude Hispanics, who are counted in a separate category. | ||||||||||
| 5. Source for boundaries of this newspaper's circulation area: ZIP Code circulation data, Audit Bureau of Circulations, latest available. | ||||||||||
| 6. A paper may define its circulation area differently for marketing efforts, or news coverage, or to set advertising rates. | ||||||||||
| 7. If ZIP Codes or counties are used, this report applies a threshold: 10 percent household penetration is required to include an area in the circulation area. | ||||||||||
| 8. Source for the demographics of residents of that circulation area: US Census 2000. | ||||||||||
| 9. Source for total circulation: Editor & Publisher magazine, Monday-Friday average at year-end 2004. | ||||||||||
| 10. Staff of non-English publications, such as the Miami Herald's El Nuevo Herald, are excluded from the ASNE staffing survey for the first time this year. | ||||||||||
| Demographics of ZIP Codes | ||||||||||
| where sales were reported by | ||||||||||
| Connecticut Post, Bridgeport | ||||||||||
| Note that some ZIP Codes listed here may not have been included in determining the newspaper's circulation area. In calculating the Diversity Index, a | ||||||||||
| ZIP Code was included only if the household penetration was at least 10 percent. Any lower-penetration ZIP Codes are also listed here for your information. | ||||||||||
| Also, if the newspaper reported more than 300 ZIP Codes, only the top 300 in weekday sales are listed here. | ||||||||||
| ZIP / City / State / Approx. distance in miles from the newspaper's home office | Weekday sales | Households | Penetration % (daily sales per 100 households) | Median household income | Non-white % of population |
Hispanic % of population |
Black % of population |
Native % of population |
Asian % of population |
|
| 06611 / Trumbull / CT / 4.9 mi. | 7,387 | 11,919 | 62.0 | $79,446 | 7.9 | 2.7 | 1.8 | 0.1 | 2.4 | |
| 06460 / Milford / CT / 7.4 mi. | 7,379 | 20,900 | 35.3 | $61,183 | 8.7 | 3.4 | 1.8 | 0.1 | 2.3 | |
| 06484 / Shelton / CT / 8.7 mi. | 7,298 | 14,190 | 51.4 | $67,292 | 7.9 | 3.5 | 1.0 | 0.1 | 2.1 | |
| 06614 / Stratford / CT / 4.4 mi. | 7,291 | 12,909 | 56.5 | $57,489 | 10.1 | 4.8 | 3.0 | 0.1 | 1.3 | |
| 06606 / Bridgeport / CT / 2.3 mi. | 5,859 | 15,578 | 37.6 | $42,798 | 57.5 | 21.8 | 27.7 | 0.2 | 2.5 | |
| 06604 / Bridgeport / CT / 0 mi. | 4,523 | 10,901 | 41.5 | $31,344 | 69.2 | 32.4 | 25.2 | 0.3 | 5.8 | |
| 06468 / Upper Stepney / CT / 9.9 mi. | 3,657 | 6,481 | 56.4 | $85,000 | 6.1 | 2.5 | 1.2 | 0.1 | 1.5 | |
| 06615 / Stratford / CT / 2.7 mi. | 3,500 | 6,989 | 50.1 | $47,047 | 36.0 | 10.5 | 21.4 | 0.2 | 1.6 | |
| 06610 / Bridgeport / CT / 2 mi. | 3,210 | 8,474 | 37.9 | $34,715 | 66.2 | 30.7 | 30.4 | 0.3 | 1.6 | |
| 06605 / Bridgeport / CT / 1.4 mi. | 2,264 | 8,546 | 26.5 | $32,419 | 70.0 | 33.7 | 27.5 | 0.3 | 4.5 | |
| 06401 / Ansonia / CT / 12 mi. | 1,483 | 7,507 | 19.8 | $43,026 | 18.8 | 7.4 | 8.1 | 0.3 | 1.1 | |
| 06483 / Seymour / CT / 14 mi. | 1,401 | 6,154 | 22.8 | $52,408 | 7.1 | 3.0 | 1.3 | 0.2 | 1.8 | |
| 06418 / Derby / CT / 14.2 mi. | 1,302 | 5,252 | 24.8 | $45,670 | 14.4 | 7.7 | 3.6 | 0.1 | 1.8 | |
| 06612 / Easton / CT / 6.7 mi. | 1,072 | 2,465 | 43.5 | $125,557 | 4.7 | 1.8 | 0.2 | 0.0 | 2.0 | |
| 06880 / Westport / CT / 7.9 mi. | 992 | 9,606 | 10.3 | $120,036 | 6.7 | 2.3 | 1.1 | 0.0 | 2.4 | |
| 06608 / Bridgeport / CT / 0.9 mi. | 919 | 4,127 | 22.3 | $21,623 | 93.4 | 65.4 | 24.2 | 0.1 | 1.9 | |
| 06516 / West Haven / CT / 12.6 mi. | 818 | 21,090 | 3.9 | $42,393 | 30.3 | 9.1 | 15.8 | 0.2 | 2.9 | |
| 06607 / Bridgeport / CT / 1.5 mi. | 800 | 2,673 | 29.9 | $27,899 | 95.6 | 24.6 | 67.5 | 0.3 | 0.5 | |
| 06478 / Seymour / CT / 16.1 mi. | 682 | 3,344 | 20.4 | $77,126 | 3.8 | 1.8 | 0.5 | 0.2 | 0.7 | |
| 06473 / North Haven / CT / 20.8 mi. | 567 | 8,661 | 6.5 | $65,807 | 8.2 | 1.9 | 2.2 | 0.1 | 3.3 | |
| 06511 / New Haven / CT / 15.6 mi. | 555 | 20,332 | 2.7 | $29,253 | 66.1 | 11.2 | 44.9 | 0.4 | 6.4 | |
| 06477 / Orange / CT / 10.6 mi. | 528 | 4,739 | 11.1 | $79,365 | 7.0 | 1.4 | 0.8 | 0.1 | 3.9 | |
| 06851 / Norwalk / CT / 10.6 mi. | 476 | 10,434 | 4.6 | $67,381 | 22.9 | 10.2 | 7.6 | 0.1 | 3.6 | |
| 06470 / Newtown / CT / 15.1 mi. | 378 | 4,930 | 7.7 | $91,126 | 7.5 | 2.9 | 2.5 | 0.1 | 1.3 | |
| 06902 / Stamford / CT / 18.7 mi. | 374 | 21,732 | 1.7 | $52,315 | 54.5 | 25.1 | 22.9 | 0.2 | 3.9 | |
| 06482 / Sandy Hook / CT / 15.2 mi. | 296 | 3,395 | 8.7 | $88,483 | 4.7 | 1.6 | 0.5 | 0.0 | 1.6 | |
| 06850 / Norwalk / CT / 12.3 mi. | 291 | 7,057 | 4.1 | $60,031 | 27.8 | 11.1 | 10.4 | 0.1 | 4.4 | |
| 06514 / New Haven / CT / 17.3 mi. | 270 | 9,862 | 2.7 | $46,699 | 32.6 | 5.3 | 21.3 | 0.1 | 3.9 | |
| 06854 / South Norwalk / CT / 12.8 mi. | 249 | 10,530 | 2.4 | $47,171 | 58.3 | 25.3 | 27.5 | 0.1 | 2.7 | |
| 06403 / Beacon Falls / CT / 17.7 mi. | 204 | 2,024 | 10.1 | $56,712 | 4.7 | 2.1 | 0.7 | 0.1 | 1.1 | |
| 06855 / Norwalk / CT / 11.1 mi. | 159 | 3,226 | 4.9 | $62,513 | 27.7 | 15.1 | 8.6 | 0.1 | 2.4 | |
| 06770 / Union City / CT / 21.4 mi. | 138 | 11,725 | 1.2 | $51,355 | 11.1 | 4.5 | 2.7 | 0.2 | 1.7 | |
| 06820 / Tokeneke / CT / 15.4 mi. | 114 | 6,592 | 1.7 | $146,755 | 5.9 | 2.2 | 0.4 | 0.0 | 2.4 | |
| 06512 / New Haven / CT / 16.7 mi. | 107 | 11,572 | 0.9 | $45,793 | 10.7 | 5.9 | 1.9 | 0.1 | 1.7 | |
| 06903 / Stamford / CT / 18.3 mi. | 104 | 5,006 | 2.1 | $118,440 | 10.4 | 2.7 | 3.1 | 0.0 | 3.5 | |
| 06897 / Wilton / CT / 11.8 mi. | 103 | 5,925 | 1.7 | $141,428 | 5.6 | 1.5 | 0.6 | 0.1 | 2.7 | |
| 06883 / Weston / CT / 8.7 mi. | 101 | 3,312 | 3.0 | $146,697 | 5.9 | 2.1 | 0.9 | 0.1 | 2.0 | |
| 06525 / Woodbridge / CT / 14.6 mi. | 100 | 3,103 | 3.2 | $102,121 | 9.7 | 1.5 | 1.5 | 0.0 | 5.1 | |
| 06488 / Southbury / CT / 18.9 mi. | 91 | 7,225 | 1.3 | $61,919 | 3.9 | 1.6 | 0.4 | 0.1 | 1.2 | |
| 06830 / Greenwich / CT / 23 mi. | 91 | 9,976 | 0.9 | $82,285 | 19.1 | 9.6 | 3.1 | 0.1 | 4.7 | |
| 06810 / Danbury / CT / 18.5 mi. | 90 | 16,424 | 0.5 | $46,116 | 39.0 | 21.1 | 6.4 | 0.2 | 5.8 | |
| 06801 / Bethel / CT / 16.3 mi. | 75 | 6,485 | 1.2 | $68,979 | 10.1 | 3.7 | 1.2 | 0.1 | 3.5 | |
| 06811 / Danbury / CT / 20.7 mi. | 55 | 10,625 | 0.5 | $66,979 | 21.4 | 7.8 | 6.3 | 0.2 | 4.9 | |
| 06905 / Stamford / CT / 17.9 mi. | 54 | 8,321 | 0.6 | $67,285 | 23.5 | 7.9 | 5.7 | 0.0 | 8.2 | |
| 06405 / Branford / CT / 20.4 mi. | 53 | 12,540 | 0.4 | $58,009 | 7.9 | 2.6 | 1.3 | 0.1 | 2.8 | |
| 06840 / New Canaan / CT / 14.6 mi. | 53 | 6,824 | 0.8 | $141,592 | 6.1 | 1.7 | 1.0 | 0.0 | 2.3 | |
| 06901 / Stamford / CT / 18.7 mi. | 52 | 3,305 | 1.6 | $38,523 | 55.4 | 21.1 | 22.5 | 0.1 | 8.4 | |
| 06510 / New Haven / CT / 15.5 mi. | 51 | 1,241 | 4.1 | $21,551 | 43.5 | 11.1 | 15.3 | 0.4 | 13.7 | |
| 06804 / Brookfield Center / CT / 20.8 mi. | 48 | 5,726 | 0.8 | $82,838 | 6.6 | 2.5 | 0.8 | 0.1 | 2.6 | |
| 06896 / West Redding / CT / 12.9 mi. | 44 | 2,897 | 1.5 | $104,369 | 5.0 | 1.5 | 0.7 | 0.1 | 1.8 | |
| 06877 / Ridgefield / CT / 16.6 mi. | 37 | 8,452 | 0.4 | $107,229 | 5.4 | 2.0 | 0.6 | 0.1 | 2.1 | |
| 06705 / Waterbury / CT / 25.7 mi. | 32 | 10,338 | 0.3 | $37,333 | 29.1 | 13.5 | 10.4 | 0.2 | 2.0 | |
| 06518 / New Haven / CT / 20.5 mi. | 31 | 6,310 | 0.5 | $60,639 | 12.6 | 2.6 | 5.0 | 0.1 | 3.7 | |
| 06870 / Old Greenwich / CT / 20.4 mi. | 31 | 2,633 | 1.2 | $126,247 | 11.4 | 3.3 | 0.8 | 0.0 | 6.0 | |
| 06437 / Guilford / CT / 25.7 mi. | 28 | 8,139 | 0.3 | $76,745 | 5.6 | 2.1 | 0.9 | 0.0 | 1.6 | |
| 06906 / Stamford / CT / 17.4 mi. | 26 | 3,355 | 0.8 | $66,983 | 26.7 | 11.7 | 7.8 | 0.1 | 5.4 | |
| 06515 / Westville / CT / 14.7 mi. | 21 | 6,351 | 0.3 | $36,717 | 54.0 | 8.6 | 40.9 | 0.2 | 1.9 | |
| 06410 / Cheshire / CT / 25.2 mi. | 18 | 9,356 | 0.2 | $80,494 | 12.0 | 3.9 | 4.5 | 0.2 | 2.6 | |
| 06798 / Woodbury / CT / 24.4 mi. | 18 | 3,719 | 0.5 | $68,408 | 4.1 | 1.7 | 0.5 | 0.2 | 1.1 | |
| 06517 / Whitneyville / CT / 17.5 mi. | 15 | 6,213 | 0.2 | $55,230 | 25.9 | 4.5 | 16.9 | 0.2 | 2.7 | |
| 06708 / Waterbury / CT / 24.9 mi. | 12 | 11,632 | 0.1 | $42,538 | 23.0 | 12.0 | 7.1 | 0.2 | 1.7 | |
| File | ct_connecticut_post__bridgeport | |||||||||
| Time | 5/20/05 3:46 PM | |||||||||
| Page | 131 | |||||||||
| Member | 106200 | |||||||||