
|
| Comparing the racial diversity of the journalists | ||||||||||
| at America's daily newspapers | ||||||||||
| with the communities that they serve | ||||||||||
| Newsroom diversity report for | ||||||||||
| Ventura County Star | ||||||||||
| Ventura, California | ||||||||||
| Owner: Scripps (Ohio) | ||||||||||
| From a report for the Knight Foundation | ||||||||||
| by Bill Dedman and Stephen K. Doig, June 2005 | ||||||||||
| Click here to read the national report or to select another newspaper | ||||||||||
| Year | Non-white % of newsroom staff | 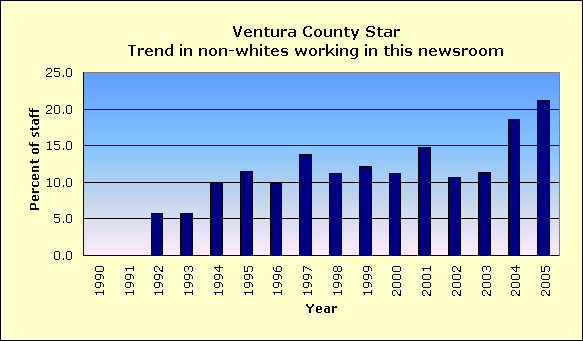
|
||||||||
| 2005 | 21.2 | |||||||||
| 2004 | 18.6 | |||||||||
| 2003 | 11.3 | |||||||||
| 2002 | 10.6 | |||||||||
| 2001 | 14.7 | |||||||||
| 2000 | 11.2 | |||||||||
| 1999 | 12.1 | |||||||||
| 1998 | 11.2 | |||||||||
| 1997 | 13.8 | |||||||||
| 1996 | 9.9 | |||||||||
| 1995 | 11.5 | |||||||||
| 1994 | 10.0 | |||||||||
| 1993 | 5.8 | |||||||||
| 1992 | 5.7 | |||||||||
| 1991 | Did not report | |||||||||
| 1990 | Did not report | |||||||||
| The latest year at peak is | 2005 | |||||||||
| See the notes and definitions section below for the sources of these figures. | ||||||||||
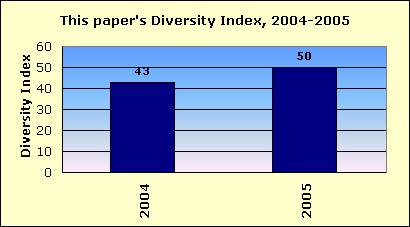
| Newsroom Diversity Index | ||||||||||
| for Ventura County Star | ||||||||||
 |
||||||||||
| Year | Non-white % of newsroom staff | Non-white % of circulation area | Newsroom Diversity Index (parity=100) | |||||||
| 2005 | 21.2 | 42.2 | 50 | |||||||
| 2004 | 18.6 | 43.6 | 43 | |||||||
| How the index is calculated | ||||||||||
| The Newsroom Diversity Index is the non-white percentage of the newsroom staff | ||||||||||
| divided by the non-white percentage of residents in the circulation area. | ||||||||||
| (Parity = 100.) | ||||||||||
| Company index | ||||||||||
| This newspaper's owner, Scripps (Ohio), | ||||||||||
| has a companywide, circulation-weighted Diversity Index of 56. | ||||||||||
| See the notes and definitions section below for the sources of these figures. | ||||||||||
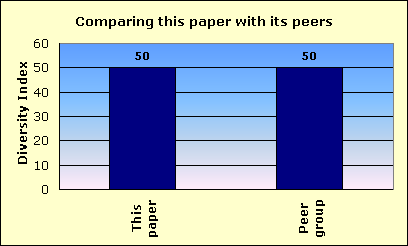
| Peer group comparison | ||||||||||
| for Ventura County Star | ||||||||||
 |
||||||||||
| This newspaper's Newsroom Diversity Index is 50. | This paper | |||||||||
| Peer group | ||||||||||
| Compare that with 50, which is the median Diversity Index for all newspapers | ||||||||||
| reporting in this circulation category of 50,001 to 100,000 daily sales. | ||||||||||
| In that group, this newspaper's Diversity Index ranks 44 out of 90 | ||||||||||
| newspapers reporting in the category of 50,001 to 100,000 daily sales. | ||||||||||
| An example of a newspaper of similar circulation, in an area of similar level of non-white residents, but one that has a relatively high Diversity Index, is The Times, Shreveport, Louisiana, with a 31.1 percent non-white staff in a community that is 41.3 percent non-white. Its index is 75. | ||||||||||
| FYI, in circulation, this newspaper's average weekday circulation of | ||||||||||
| approximately 98,550 ranks 106 out of 1,410 daily newspapers in the US. | ||||||||||
| See the notes and definitions section below for the sources of these figures. | ||||||||||
| Details on race/ethnicity | ||||||||||
| in the circulation area | ||||||||||
| and the home county | ||||||||||
| of Ventura County Star | ||||||||||
| Circulation area | ||||||||||
| Race/ethnicity | % of population | Number of residents | 
|
|||||||
| Hispanic | 33.8 | 251,253 | ||||||||
| Black | 1.8 | 13,378 | ||||||||
| Asian and Pacific Islander | 5.4 | 40,041 | ||||||||
| Native-American | 0.4 | 3,150 | ||||||||
| Other non-white | 0.2 | 1,105 | ||||||||
| Multi-racial | 2.0 | 15,151 | ||||||||
| Non-white | 43.6 | 324,078 | ||||||||
| White | 56.4 | 419,145 | ||||||||
| Total | 743,223 | |||||||||
| Home county: Ventura | ||||||||||
| Race/ethnicity | % of population | Number of residents | 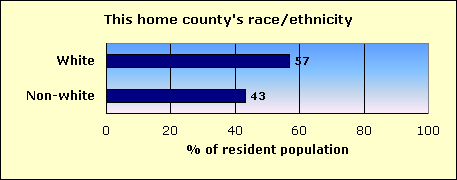
|
|||||||
| Hispanic | 33.4 | 251,734 | ||||||||
| Black | 1.8 | 13,490 | ||||||||
| Asian and Pacific Islander | 5.4 | 40,831 | ||||||||
| Native-American | 0.4 | 3,177 | ||||||||
| Other non-white | 0.2 | 1,122 | ||||||||
| Multi-racial | 2.0 | 15,394 | ||||||||
| Non-white | 43.3 | 325,748 | ||||||||
| White | 56.8 | 427,449 | ||||||||
| Total | 753,197 | |||||||||
| The home county of this newspaper is Ventura. | ||||||||||
| About this report | ||||||||||
| This third annual report for the Knight Foundation adds context to an annual survey by the American Society of Newspaper Editors. ASNE has set a goal that | ||||||||||
| every newspaper, to help it know its community and gather the news, should employ at least one non-white journalist, and that newspapers should strive to | ||||||||||
| employ non-whites in proportion to their share of the community. ASNE's report, at www.asne.org, shows each newspaper's non-white employment, but does | ||||||||||
| not disclose how closely that employment mirrors the newspaper's circulation area. | ||||||||||
| That gap is filled by the report you are reading now. This report was not done by ASNE, but was done for the Knight Foundation by Bill Dedman and | ||||||||||
| Stephen K. Doig. It shows how close each newspaper is to ASNE's goal, by comparing the newsroom staffing with the circulation area population. | ||||||||||
| The full report is at www.powerreporting.com/knight. | ||||||||||
| Notes and definitions | ||||||||||
| 1. The Newsroom Diversity Index is the non-white percentage of the newsroom staff divided by the non-white percentage of the circulation area's residents. Parity = 100. | ||||||||||
| 2. Source for staffing: Survey by American Society of Newspaper Editors, April 2005. Newspapers report non-white staff as of the end of the previous year. | ||||||||||
| 3. Following ASNE's definition, newsroom staff includes only supervisors, reporters, editors, copy/layout editors and photographers. | ||||||||||
| 4. Also following ASNE's definition, "whites," "blacks," etc., exclude Hispanics, who are counted in a separate category. | ||||||||||
| 5. Source for boundaries of this newspaper's circulation area: ZIP Code circulation data, Audit Bureau of Circulations, latest available. | ||||||||||
| 6. A paper may define its circulation area differently for marketing efforts, or news coverage, or to set advertising rates. | ||||||||||
| 7. If ZIP Codes or counties are used, this report applies a threshold: 10 percent household penetration is required to include an area in the circulation area. | ||||||||||
| 8. Source for the demographics of residents of that circulation area: US Census 2000. | ||||||||||
| 9. Source for total circulation: Editor & Publisher magazine, Monday-Friday average at year-end 2004. | ||||||||||
| 10. Staff of non-English publications, such as the Miami Herald's El Nuevo Herald, are excluded from the ASNE staffing survey for the first time this year. | ||||||||||
| Demographics of ZIP Codes | ||||||||||
| where sales were reported by | ||||||||||
| Ventura County Star | ||||||||||
| Note that some ZIP Codes listed here may not have been included in determining the newspaper's circulation area. In calculating the Diversity Index, a | ||||||||||
| ZIP Code was included only if the household penetration was at least 10 percent. Any lower-penetration ZIP Codes are also listed here for your information. | ||||||||||
| Also, if the newspaper reported more than 300 ZIP Codes, only the top 300 in weekday sales are listed here. | ||||||||||
| ZIP / City / State / Approx. distance in miles from the newspaper's home office | Weekday sales | Households | Penetration % (daily sales per 100 households) | Median household income | Non-white % of population |
Hispanic % of population |
Black % of population |
Native % of population |
Asian % of population |
|
| 93003 / Ventura / CA / 4.1 mi. | 10,065 | 18,213 | 55.3 | $54,574 | 28.3 | 19.9 | 1.4 | 0.5 | 3.7 | |
| 93010 / Camarillo / CA / 14.7 mi. | 7,234 | 15,041 | 48.1 | $63,245 | 30.4 | 18.4 | 2.0 | 0.4 | 6.9 | |
| 93030 / Oxnard / CA / 7.3 mi. | 5,688 | 21,277 | 26.7 | $46,175 | 79.5 | 68.7 | 3.4 | 0.4 | 5.3 | |
| 93065 / Simi Valley / CA / 27.9 mi. | 5,535 | 20,881 | 26.5 | $72,384 | 28.4 | 17.9 | 1.2 | 0.5 | 6.2 | |
| 93033 / Oxnard / CA / 9.8 mi. | 5,437 | 16,746 | 32.5 | $46,342 | 88.2 | 73.9 | 3.1 | 0.4 | 9.3 | |
| 91360 / Thousand Oaks / CA / 22.7 mi. | 4,962 | 14,526 | 34.2 | $72,033 | 23.3 | 14.9 | 0.9 | 0.4 | 5.2 | |
| 93001 / Ventura / CA / 1 mi. | 4,715 | 12,836 | 36.7 | $43,023 | 39.0 | 32.6 | 1.1 | 0.8 | 2.0 | |
| 93004 / Ventura / CA / 6.6 mi. | 4,574 | 9,645 | 47.4 | $59,099 | 31.7 | 24.5 | 1.1 | 0.6 | 2.8 | |
| 91320 / Thousand Oaks / CA / 20.3 mi. | 4,550 | 12,977 | 35.1 | $77,865 | 23.1 | 13.8 | 1.1 | 0.3 | 5.9 | |
| 93063 / Simi Valley / CA / 31.5 mi. | 4,399 | 16,393 | 26.8 | $67,311 | 25.5 | 15.2 | 1.2 | 0.3 | 6.3 | |
| 93012 / Santa Rosa Valle / CA / 17.1 mi. | 4,206 | 9,786 | 43.0 | $69,939 | 19.4 | 9.4 | 0.8 | 0.3 | 6.8 | |
| 93060 / Santa Paula / CA / 12.8 mi. | 3,365 | 9,095 | 37.0 | $43,166 | 71.2 | 68.6 | 0.4 | 0.5 | 0.8 | |
| 93035 / Oxnard / CA / 7.4 mi. | 3,260 | 9,160 | 35.6 | $58,874 | 46.0 | 33.0 | 3.7 | 0.4 | 6.2 | |
| 91362 / Westlake Village / CA / 25.2 mi. | 3,194 | 12,146 | 26.3 | $83,750 | 21.7 | 11.5 | 1.0 | 0.2 | 6.8 | |
| 93021 / Moorpark / CA / 21.5 mi. | 3,106 | 9,468 | 32.8 | $76,796 | 37.7 | 28.1 | 1.4 | 0.3 | 5.5 | |
| 93041 / Port Hueneme / CA / 9.4 mi. | 2,483 | 8,054 | 30.8 | $41,714 | 55.8 | 38.4 | 6.0 | 0.7 | 7.1 | |
| 93023 / Ojai / CA / 11.1 mi. | 2,431 | 8,201 | 29.6 | $50,709 | 19.7 | 15.4 | 0.4 | 0.5 | 1.3 | |
| 91361 / Westlake Village / CA / 25.1 mi. | 1,885 | 7,589 | 24.8 | $86,646 | 13.5 | 5.7 | 0.8 | 0.2 | 5.1 | |
| 93015 / Fillmore / CA / 21.7 mi. | 1,709 | 4,461 | 38.3 | $45,732 | 68.0 | 65.0 | 0.2 | 0.5 | 0.8 | |
| 93022 / Oak View / CA / 8.1 mi. | 892 | 2,137 | 41.7 | $59,313 | 21.3 | 17.1 | 0.7 | 0.7 | 1.0 | |
| 91301 / Saratoga Hills / CA / 29.9 mi. | 848 | 8,486 | 10.0 | $88,725 | 17.1 | 6.8 | 1.2 | 0.2 | 6.4 | |
| 91377 / Oak Park / CA / 29.9 mi. | 562 | 5,252 | 10.7 | $89,561 | 15.1 | 4.5 | 0.9 | 0.2 | 7.2 | |
| 93066 / Somis / CA / 15 mi. | 386 | 944 | 40.9 | $63,043 | 38.8 | 32.5 | 0.9 | 0.1 | 2.9 | |
| 93013 / Carpinteria / CA / 14.4 mi. | 132 | 6,230 | 2.1 | $52,052 | 44.0 | 38.8 | 0.5 | 0.4 | 2.4 | |
| 93040 / Piru / CA / 28.5 mi. | 74 | 366 | 20.2 | $41,098 | 76.5 | 71.7 | 0.2 | 1.9 | 1.3 | |
| 91302 / Woodland Hills / CA / 34.1 mi. | 28 | 8,541 | 0.3 | $93,378 | 15.9 | 4.9 | 1.2 | 0.1 | 7.3 | |
| File | ca_ventura_county_star | |||||||||
| Time | 5/17/05 5:23 PM | |||||||||
| Page | 106 | |||||||||
| Member | 105150 | |||||||||