
|
| Comparing the racial diversity of the journalists | ||||||||||
| at America's daily newspapers | ||||||||||
| with the communities that they serve | ||||||||||
| Newsroom diversity report for | ||||||||||
| The Salinas Californian | ||||||||||
| Salinas, California | ||||||||||
| Owner: Gannett Co. (Va.) | ||||||||||
| From a report for the Knight Foundation | ||||||||||
| by Bill Dedman and Stephen K. Doig, June 2005 | ||||||||||
| Click here to read the national report or to select another newspaper | ||||||||||
| Year | Non-white % of newsroom staff | 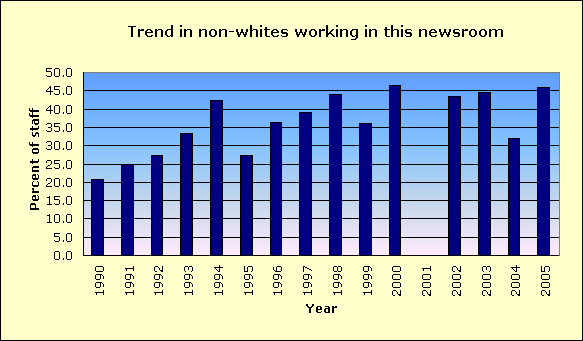
|
||||||||
| 2005 | 45.8 | |||||||||
| 2004 | 32.0 | |||||||||
| 2003 | 44.4 | |||||||||
| 2002 | 43.5 | |||||||||
| 2001 | Did not report | |||||||||
| 2000 | 46.4 | |||||||||
| 1999 | 36.0 | |||||||||
| 1998 | 44.0 | |||||||||
| 1997 | 39.1 | |||||||||
| 1996 | 36.4 | |||||||||
| 1995 | 27.3 | |||||||||
| 1994 | 42.3 | |||||||||
| 1993 | 33.3 | |||||||||
| 1992 | 27.3 | |||||||||
| 1991 | 25.0 | |||||||||
| 1990 | 20.8 | |||||||||
| The latest year at peak is | 2000 | |||||||||
| See the notes and definitions section below for the sources of these figures. | ||||||||||
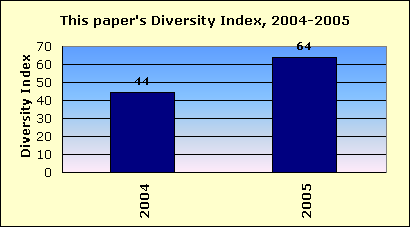
| Newsroom Diversity Index | ||||||||||
| for The Salinas Californian | ||||||||||
 |
||||||||||
| Year | Non-white % of newsroom staff | Non-white % of circulation area | Newsroom Diversity Index (parity=100) | |||||||
| 2005 | 45.8 | 72.0 | 64 | |||||||
| 2004 | 32.0 | 72.0 | 44 | |||||||
| How the index is calculated | ||||||||||
| The Newsroom Diversity Index is the non-white percentage of the newsroom staff | ||||||||||
| divided by the non-white percentage of residents in the circulation area. | ||||||||||
| (Parity = 100.) | ||||||||||
| Company index | ||||||||||
| This newspaper's owner, Gannett Co. (Va.), | ||||||||||
| has a companywide, circulation-weighted Diversity Index of 89. | ||||||||||
| See the notes and definitions section below for the sources of these figures. | ||||||||||
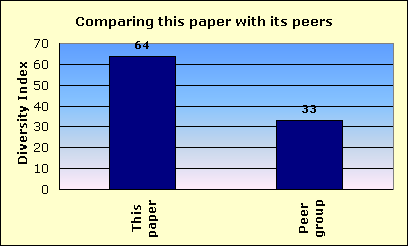
| Peer group comparison | ||||||||||
| for The Salinas Californian | ||||||||||
 |
||||||||||
| This newspaper's Newsroom Diversity Index is 64. | This paper | |||||||||
| Peer group | ||||||||||
| Compare that with 33, which is the median Diversity Index for all newspapers | ||||||||||
| reporting in this circulation category of 10,001 to 25,000 daily sales. | ||||||||||
| In that group, this newspaper's Diversity Index ranks 62 out of 259 | ||||||||||
| newspapers reporting in the category of 10,001 to 25,000 daily sales. | ||||||||||
| FYI, in circulation, this newspaper's average weekday circulation of | ||||||||||
| approximately 17,528 ranks 540 out of 1,410 daily newspapers in the US. | ||||||||||
| See the notes and definitions section below for the sources of these figures. | ||||||||||
| Details on race/ethnicity | ||||||||||
| in the circulation area | ||||||||||
| and the home county | ||||||||||
| of The Salinas Californian | ||||||||||
| Circulation area | ||||||||||
| Race/ethnicity | % of population | Number of residents | 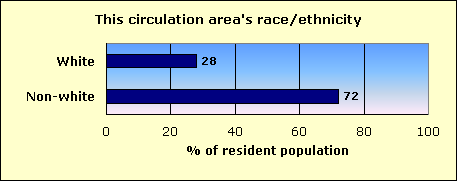
|
|||||||
| Hispanic | 62.5 | 153,307 | ||||||||
| Black | 2.1 | 5,240 | ||||||||
| Asian and Pacific Islander | 4.8 | 11,861 | ||||||||
| Native-American | 0.4 | 1,040 | ||||||||
| Other non-white | 0.2 | 600 | ||||||||
| Multi-racial | 1.8 | 4,413 | ||||||||
| Non-white | 72.0 | 176,461 | ||||||||
| White | 28.0 | 68,694 | ||||||||
| Total | 245,155 | |||||||||
| Home county: Monterey | ||||||||||
| Race/ethnicity | % of population | Number of residents | 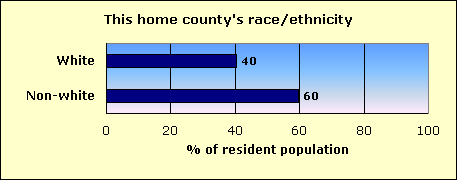
|
|||||||
| Hispanic | 46.8 | 187,969 | ||||||||
| Black | 3.5 | 14,085 | ||||||||
| Asian and Pacific Islander | 6.2 | 24,746 | ||||||||
| Native-American | 0.4 | 1,782 | ||||||||
| Other non-white | 0.3 | 1,190 | ||||||||
| Multi-racial | 2.5 | 9,945 | ||||||||
| Non-white | 59.7 | 239,717 | ||||||||
| White | 40.3 | 162,045 | ||||||||
| Total | 401,762 | |||||||||
| The home county of this newspaper is Monterey. | ||||||||||
| About this report | ||||||||||
| This third annual report for the Knight Foundation adds context to an annual survey by the American Society of Newspaper Editors. ASNE has set a goal that | ||||||||||
| every newspaper, to help it know its community and gather the news, should employ at least one non-white journalist, and that newspapers should strive to | ||||||||||
| employ non-whites in proportion to their share of the community. ASNE's report, at www.asne.org, shows each newspaper's non-white employment, but does | ||||||||||
| not disclose how closely that employment mirrors the newspaper's circulation area. | ||||||||||
| That gap is filled by the report you are reading now. This report was not done by ASNE, but was done for the Knight Foundation by Bill Dedman and | ||||||||||
| Stephen K. Doig. It shows how close each newspaper is to ASNE's goal, by comparing the newsroom staffing with the circulation area population. | ||||||||||
| The full report is at www.powerreporting.com/knight. | ||||||||||
| Notes and definitions | ||||||||||
| 1. The Newsroom Diversity Index is the non-white percentage of the newsroom staff divided by the non-white percentage of the circulation area's residents. Parity = 100. | ||||||||||
| 2. Source for staffing: Survey by American Society of Newspaper Editors, April 2005. Newspapers report non-white staff as of the end of the previous year. | ||||||||||
| 3. Following ASNE's definition, newsroom staff includes only supervisors, reporters, editors, copy/layout editors and photographers. | ||||||||||
| 4. Also following ASNE's definition, "whites," "blacks," etc., exclude Hispanics, who are counted in a separate category. | ||||||||||
| 5. Source for boundaries of this newspaper's circulation area: ZIP Code circulation data, Audit Bureau of Circulations, latest available. | ||||||||||
| 6. A paper may define its circulation area differently for marketing efforts, or news coverage, or to set advertising rates. | ||||||||||
| 7. If ZIP Codes or counties are used, this report applies a threshold: 10 percent household penetration is required to include an area in the circulation area. | ||||||||||
| 8. Source for the demographics of residents of that circulation area: US Census 2000. | ||||||||||
| 9. Source for total circulation: Editor & Publisher magazine, Monday-Friday average at year-end 2004. | ||||||||||
| 10. Staff of non-English publications, such as the Miami Herald's El Nuevo Herald, are excluded from the ASNE staffing survey for the first time this year. | ||||||||||
| Demographics of ZIP Codes | ||||||||||
| where sales were reported by | ||||||||||
| The Salinas Californian | ||||||||||
| Note that some ZIP Codes listed here may not have been included in determining the newspaper's circulation area. In calculating the Diversity Index, a | ||||||||||
| ZIP Code was included only if the household penetration was at least 10 percent. Any lower-penetration ZIP Codes are also listed here for your information. | ||||||||||
| Also, if the newspaper reported more than 300 ZIP Codes, only the top 300 in weekday sales are listed here. | ||||||||||
| ZIP / City / State / Approx. distance in miles from the newspaper's home office | Weekday sales | Households | Penetration % (daily sales per 100 households) | Median household income | Non-white % of population |
Hispanic % of population |
Black % of population |
Native % of population |
Asian % of population |
|
| 93906 / Salinas / CA / 4.4 mi. | 4,636 | 15,554 | 29.8 | $49,124 | 69.6 | 53.9 | 2.8 | 0.5 | 9.3 | |
| 93901 / Salinas / CA / 0 mi. | 4,316 | 10,141 | 42.6 | $42,177 | 56.0 | 40.6 | 6.7 | 0.6 | 5.0 | |
| 93905 / Salinas / CA / 2.3 mi. | 2,234 | 11,610 | 19.2 | $36,176 | 93.6 | 89.1 | 0.7 | 0.2 | 2.9 | |
| 93907 / Salinas / CA / 7.8 mi. | 1,768 | 7,250 | 24.4 | $60,179 | 43.3 | 30.1 | 2.0 | 0.8 | 6.7 | |
| 93908 / Salinas / CA / 3.5 mi. | 1,135 | 4,551 | 24.9 | $85,488 | 25.9 | 16.8 | 0.6 | 0.3 | 5.7 | |
| 93960 / Soledad / CA / 24.2 mi. | 627 | 2,958 | 21.2 | $43,377 | 87.8 | 83.9 | 0.8 | 0.3 | 1.8 | |
| 93930 / King City / CA / 44.9 mi. | 597 | 3,819 | 15.6 | $39,672 | 75.6 | 71.9 | 0.2 | 0.5 | 1.9 | |
| 93926 / Gonzales / CA / 15.8 mi. | 484 | 2,009 | 24.1 | $41,538 | 89.1 | 85.5 | 0.5 | 0.3 | 1.9 | |
| 93927 / Greenfield / CA / 31 mi. | 468 | 3,143 | 14.9 | $38,445 | 87.3 | 84.5 | 0.8 | 0.3 | 0.8 | |
| 95012 / Castroville / CA / 10.1 mi. | 414 | 2,032 | 20.4 | $41,200 | 81.2 | 75.3 | 0.7 | 0.3 | 3.2 | |
| 93955 / Seaside / CA / 10 mi. | 287 | 9,959 | 2.9 | $41,386 | 64.9 | 35.0 | 14.6 | 0.6 | 9.5 | |
| 93940 / Monterey / CA / 12.2 mi. | 256 | 13,900 | 1.8 | $50,274 | 24.2 | 10.3 | 2.3 | 0.4 | 7.5 | |
| 93933 / Marina / CA / 6.7 mi. | 210 | 7,863 | 2.7 | $42,231 | 57.5 | 18.3 | 9.8 | 0.5 | 21.7 | |
| 95023 / Hollister / CA / 24.9 mi. | 169 | 13,911 | 1.2 | $58,559 | 55.5 | 49.5 | 0.9 | 0.5 | 2.4 | |
| 95076 / Watsonville / CA / 19.1 mi. | 144 | 21,509 | 0.7 | $45,354 | 69.6 | 63.8 | 0.5 | 0.4 | 3.1 | |
| 93925 / Chualar / CA / 13.6 mi. | 88 | 286 | 30.8 | $48,295 | 73.9 | 69.0 | 0.5 | 0.4 | 3.0 | |
| 93962 / Spreckels / CA / 2.6 mi. | 69 | 145 | 47.6 | $58,519 | 29.4 | 26.1 | 0.5 | 1.0 | 0.5 | |
| 95004 / Aromas / CA / 15.2 mi. | 66 | 1,082 | 6.1 | $67,697 | 30.4 | 23.3 | 0.3 | 1.0 | 2.4 | |
| 93950 / Pacific Grove / CA / 15.6 mi. | 40 | 7,277 | 0.5 | $50,263 | 16.5 | 7.2 | 1.1 | 0.4 | 4.7 | |
| 95045 / San Juan Bautista / CA / 14.8 mi. | 38 | 1,145 | 3.3 | $47,056 | 49.5 | 42.7 | 0.9 | 0.6 | 2.4 | |
| 95039 / Moss Landing / CA / 11.9 mi. | 31 | 302 | 10.3 | $49,286 | 53.7 | 41.4 | 1.5 | 0.7 | 3.8 | |
| File | ca_the_salinas_californian | |||||||||
| Time | 5/19/05 7:46 PM | |||||||||
| Page | 539 | |||||||||
| Member | 104100 | |||||||||