
|
| Comparing the racial diversity of the journalists | ||||||||||
| at America's daily newspapers | ||||||||||
| with the communities that they serve | ||||||||||
| Newsroom diversity report for | ||||||||||
| The Bakersfield Californian | ||||||||||
| Bakersfield, California | ||||||||||
| From a report for the Knight Foundation | ||||||||||
| by Bill Dedman and Stephen K. Doig, June 2005 | ||||||||||
| Click here to read the national report or to select another newspaper | ||||||||||
| Year | Non-white % of newsroom staff | 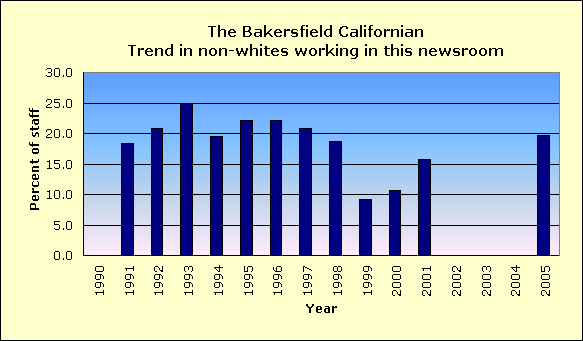
|
||||||||
| 2005 | 19.7 | |||||||||
| 2004 | Did not report | |||||||||
| 2003 | Did not report | |||||||||
| 2002 | Did not report | |||||||||
| 2001 | 15.8 | |||||||||
| 2000 | 10.6 | |||||||||
| 1999 | 9.2 | |||||||||
| 1998 | 18.7 | |||||||||
| 1997 | 20.8 | |||||||||
| 1996 | 22.2 | |||||||||
| 1995 | 22.2 | |||||||||
| 1994 | 19.5 | |||||||||
| 1993 | 25.0 | |||||||||
| 1992 | 20.9 | |||||||||
| 1991 | 18.3 | |||||||||
| 1990 | Did not report | |||||||||
| The latest year at peak is | 1993 | |||||||||
| See the notes and definitions section below for the sources of these figures. | ||||||||||
| Newsroom Diversity Index | ||||||||||
| for The Bakersfield Californian | ||||||||||
| Year | Non-white % of newsroom staff | Non-white % of circulation area | Newsroom Diversity Index (parity=100) | |||||||
| 2005 | 19.7 | 53.6 | 37 | |||||||
| 2004 | N/A | 52.9 | N/A | |||||||
| How the index is calculated | ||||||||||
| The Newsroom Diversity Index is the non-white percentage of the newsroom staff | ||||||||||
| divided by the non-white percentage of residents in the circulation area. | ||||||||||
| (Parity = 100.) | ||||||||||
| See the notes and definitions section below for the sources of these figures. | ||||||||||
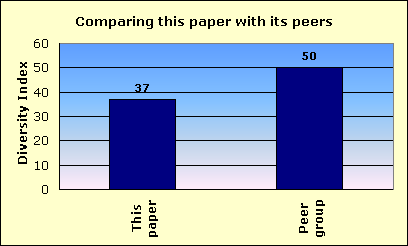
| Peer group comparison | ||||||||||
| for The Bakersfield Californian | ||||||||||
 |
||||||||||
| This newspaper's Newsroom Diversity Index is 37. | This paper | |||||||||
| Peer group | ||||||||||
| Compare that with 50, which is the median Diversity Index for all newspapers | ||||||||||
| reporting in this circulation category of 50,001 to 100,000 daily sales. | ||||||||||
| In that group, this newspaper's Diversity Index ranks 60 out of 90 | ||||||||||
| newspapers reporting in the category of 50,001 to 100,000 daily sales. | ||||||||||
| An example of a newspaper of similar circulation, in an area of similar level of non-white residents, but one that has a relatively high Diversity Index, is The Times, Shreveport, Louisiana, with a 31.1 percent non-white staff in a community that is 41.3 percent non-white. Its index is 75. | ||||||||||
| FYI, in circulation, this newspaper's average weekday circulation of | ||||||||||
| approximately 62,278 ranks 167 out of 1,410 daily newspapers in the US. | ||||||||||
| See the notes and definitions section below for the sources of these figures. | ||||||||||
| Details on race/ethnicity | ||||||||||
| in the circulation area | ||||||||||
| and the home county | ||||||||||
| of The Bakersfield Californian | ||||||||||
| Circulation area | ||||||||||
| Race/ethnicity | % of population | Number of residents | 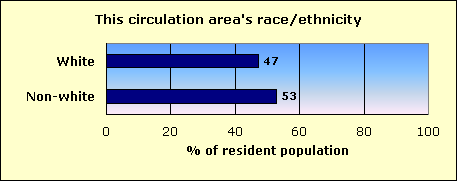
|
|||||||
| Hispanic | 41.1 | 241,955 | ||||||||
| Black | 5.5 | 32,610 | ||||||||
| Asian and Pacific Islander | 3.3 | 19,472 | ||||||||
| Native-American | 0.9 | 5,178 | ||||||||
| Other non-white | 0.1 | 831 | ||||||||
| Multi-racial | 2.0 | 11,563 | ||||||||
| Non-white | 52.9 | 311,609 | ||||||||
| White | 47.1 | 277,370 | ||||||||
| Total | 588,979 | |||||||||
| Home county: Kern | ||||||||||
| Race/ethnicity | % of population | Number of residents | 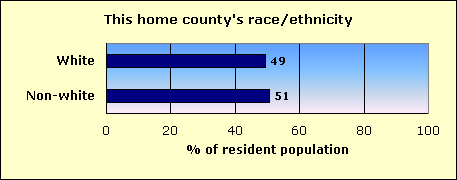
|
|||||||
| Hispanic | 38.4 | 254,036 | ||||||||
| Black | 5.7 | 37,845 | ||||||||
| Asian and Pacific Islander | 3.3 | 21,905 | ||||||||
| Native-American | 0.9 | 5,885 | ||||||||
| Other non-white | 0.2 | 989 | ||||||||
| Multi-racial | 2.1 | 13,795 | ||||||||
| Non-white | 50.6 | 334,455 | ||||||||
| White | 49.5 | 327,190 | ||||||||
| Total | 661,645 | |||||||||
| The home county of this newspaper is Kern. | ||||||||||
| About this report | ||||||||||
| This third annual report for the Knight Foundation adds context to an annual survey by the American Society of Newspaper Editors. ASNE has set a goal that | ||||||||||
| every newspaper, to help it know its community and gather the news, should employ at least one non-white journalist, and that newspapers should strive to | ||||||||||
| employ non-whites in proportion to their share of the community. ASNE's report, at www.asne.org, shows each newspaper's non-white employment, but does | ||||||||||
| not disclose how closely that employment mirrors the newspaper's circulation area. | ||||||||||
| That gap is filled by the report you are reading now. This report was not done by ASNE, but was done for the Knight Foundation by Bill Dedman and | ||||||||||
| Stephen K. Doig. It shows how close each newspaper is to ASNE's goal, by comparing the newsroom staffing with the circulation area population. | ||||||||||
| The full report is at www.powerreporting.com/knight. | ||||||||||
| Notes and definitions | ||||||||||
| 1. The Newsroom Diversity Index is the non-white percentage of the newsroom staff divided by the non-white percentage of the circulation area's residents. Parity = 100. | ||||||||||
| 2. Source for staffing: Survey by American Society of Newspaper Editors, April 2005. Newspapers report non-white staff as of the end of the previous year. | ||||||||||
| 3. Following ASNE's definition, newsroom staff includes only supervisors, reporters, editors, copy/layout editors and photographers. | ||||||||||
| 4. Also following ASNE's definition, "whites," "blacks," etc., exclude Hispanics, who are counted in a separate category. | ||||||||||
| 5. Source for boundaries of this newspaper's circulation area: ZIP Code circulation data, Audit Bureau of Circulations, latest available. | ||||||||||
| 6. A paper may define its circulation area differently for marketing efforts, or news coverage, or to set advertising rates. | ||||||||||
| 7. If ZIP Codes or counties are used, this report applies a threshold: 10 percent household penetration is required to include an area in the circulation area. | ||||||||||
| 8. Source for the demographics of residents of that circulation area: US Census 2000. | ||||||||||
| 9. Source for total circulation: Editor & Publisher magazine, Monday-Friday average at year-end 2004. | ||||||||||
| 10. Staff of non-English publications, such as the Miami Herald's El Nuevo Herald, are excluded from the ASNE staffing survey for the first time this year. | ||||||||||
| Demographics of ZIP Codes | ||||||||||
| where sales were reported by | ||||||||||
| The Bakersfield Californian | ||||||||||
| Note that some ZIP Codes listed here may not have been included in determining the newspaper's circulation area. In calculating the Diversity Index, a | ||||||||||
| ZIP Code was included only if the household penetration was at least 10 percent. Any lower-penetration ZIP Codes are also listed here for your information. | ||||||||||
| Also, if the newspaper reported more than 300 ZIP Codes, only the top 300 in weekday sales are listed here. | ||||||||||
| ZIP / City / State / Approx. distance in miles from the newspaper's home office | Weekday sales | Households | Penetration % (daily sales per 100 households) | Median household income | Non-white % of population |
Hispanic % of population |
Black % of population |
Native % of population |
Asian % of population |
|
| 93309 / Bakersfield / CA / 3.4 mi. | 9,547 | 22,431 | 42.6 | $40,084 | 38.2 | 22.8 | 8.4 | 0.8 | 3.7 | |
| 93306 / Bakersfield / CA / 4.8 mi. | 7,470 | 17,631 | 42.4 | $38,711 | 51.1 | 42.3 | 3.4 | 1.1 | 2.3 | |
| 93311 / Bakersfield / CA / 7.4 mi. | 5,481 | 7,353 | 74.5 | $60,700 | 33.4 | 17.1 | 3.8 | 0.5 | 9.2 | |
| 93312 / Greenacres / CA / 7.9 mi. | 5,261 | 13,026 | 40.4 | $61,583 | 20.0 | 13.1 | 1.7 | 0.9 | 2.3 | |
| 93308 / Bakersfield / CA / 3.1 mi. | 5,141 | 16,155 | 31.8 | $33,035 | 18.4 | 12.2 | 1.2 | 1.5 | 1.3 | |
| 93304 / Bakersfield / CA / 1.7 mi. | 3,806 | 14,633 | 26.0 | $28,613 | 62.9 | 42.2 | 12.7 | 1.0 | 4.2 | |
| 93305 / Bakersfield / CA / 2.2 mi. | 3,773 | 10,448 | 36.1 | $24,114 | 74.9 | 65.7 | 5.3 | 1.1 | 1.1 | |
| 93307 / Bakersfield / CA / 4.4 mi. | 3,018 | 16,168 | 18.7 | $26,462 | 76.8 | 60.0 | 11.7 | 0.8 | 2.3 | |
| 93313 / Pumpkin Center / CA / 8.2 mi. | 2,556 | 7,509 | 34.0 | $50,114 | 44.9 | 27.9 | 7.5 | 0.8 | 5.9 | |
| 93301 / Bakersfield / CA / 0.9 mi. | 2,045 | 5,040 | 40.6 | $25,587 | 48.7 | 31.8 | 10.9 | 0.9 | 2.3 | |
| 93561 / Tehachapi / CA / 30.3 mi. | 1,907 | 7,855 | 24.3 | $47,031 | 32.9 | 21.6 | 6.5 | 0.7 | 1.0 | |
| 93215 / Delano / CA / 28.1 mi. | 1,565 | 8,940 | 17.5 | $27,912 | 92.0 | 71.7 | 2.2 | 0.3 | 15.9 | |
| 93268 / Taft / CA / 25.2 mi. | 1,187 | 5,206 | 22.8 | $31,938 | 22.5 | 17.4 | 0.9 | 1.1 | 1.4 | |
| 93263 / Shafter / CA / 16 mi. | 950 | 3,975 | 23.9 | $29,466 | 69.4 | 66.1 | 1.4 | 0.6 | 0.4 | |
| 93280 / Wasco / CA / 21.6 mi. | 923 | 4,401 | 21.0 | $29,351 | 77.1 | 65.9 | 9.3 | 0.5 | 0.7 | |
| 93555 / Ridgecrest / CA / 71.7 mi. | 840 | 11,769 | 7.1 | $45,722 | 22.0 | 11.3 | 3.1 | 0.8 | 3.9 | |
| 93240 / Mountain Mesa / CA / 34.5 mi. | 684 | 2,527 | 27.1 | $22,194 | 12.5 | 6.2 | 0.3 | 1.5 | 0.6 | |
| 93203 / Di Giorgio / CA / 13.6 mi. | 665 | 3,838 | 17.3 | $24,577 | 87.1 | 84.1 | 0.5 | 0.4 | 1.3 | |
| 93241 / Lamont / CA / 9.4 mi. | 651 | 3,593 | 18.1 | $25,147 | 91.2 | 89.1 | 0.2 | 0.3 | 0.7 | |
| 93250 / McFarland / CA / 22.3 mi. | 341 | 2,236 | 15.3 | $25,137 | 87.4 | 82.6 | 3.0 | 0.5 | 0.8 | |
| 93285 / Wofford Heights / CA / 35.9 mi. | 246 | 1,269 | 19.4 | $24,227 | 11.1 | 6.3 | 0.1 | 0.9 | 0.6 | |
| 93257 / Porterville / CA / 44.8 mi. | 206 | 19,524 | 1.1 | $30,995 | 57.8 | 49.3 | 0.8 | 1.7 | 4.1 | |
| 93238 / River Kern / CA / 39.6 mi. | 205 | 864 | 23.7 | $27,955 | 14.7 | 8.0 | 1.1 | 2.1 | 0.7 | |
| 93243 / Lebec / CA / 34.4 mi. | 196 | 438 | 44.7 | $39,091 | 28.2 | 22.0 | 0.3 | 1.2 | 0.7 | |
| 93225 / Frazier Park / CA / 35.1 mi. | 160 | 1,745 | 9.2 | $39,530 | 15.8 | 10.4 | 0.5 | 1.0 | 1.1 | |
| 93249 / Lost Hills / CA / 43.2 mi. | 158 | 469 | 33.7 | $30,625 | 96.3 | 95.4 | 0.2 | 0.2 | 0.2 | |
| 93206 / Buttonwillow / CA / 22.3 mi. | 135 | 564 | 23.9 | $26,912 | 71.6 | 65.7 | 3.2 | 0.8 | 0.3 | |
| 93205 / Bodfish / CA / 31.3 mi. | 134 | 891 | 15.0 | $21,842 | 11.4 | 5.2 | 0.2 | 2.3 | 0.6 | |
| 93518 / Loraine / CA / 29 mi. | 128 | 424 | 30.2 | $31,196 | 14.0 | 6.1 | 0.6 | 1.8 | 0.7 | |
| 93501 / Mojave / CA / 49.9 mi. | 92 | 1,820 | 5.1 | $29,121 | 36.5 | 25.4 | 4.5 | 1.2 | 1.9 | |
| 93219 / Earlimart / CA / 35.6 mi. | 91 | 2,126 | 4.3 | $22,735 | 94.5 | 85.4 | 1.0 | 0.3 | 6.7 | |
| 93222 / Pine Mountain Cl / CA / 34.9 mi. | 87 | 634 | 13.7 | $43,875 | 14.9 | 9.5 | 0.6 | 1.0 | 1.2 | |
| 93283 / Weldon / CA / 41.9 mi. | 80 | 850 | 9.4 | $21,932 | 15.9 | 6.1 | 0.4 | 5.8 | 0.5 | |
| 93531 / Keene / CA / 23.7 mi. | 76 | 545 | 13.9 | $54,792 | 16.8 | 9.2 | 1.4 | 1.1 | 0.1 | |
| 93505 / California City / CA / 58.2 mi. | 64 | 3,038 | 2.1 | $45,868 | 38.9 | 17.0 | 12.5 | 1.2 | 3.8 | |
| 93252 / Maricopa / CA / 28.6 mi. | 62 | 669 | 9.3 | $31,250 | 28.1 | 11.4 | 11.9 | 1.2 | 2.9 | |
| 93224 / Fellows / CA / 30 mi. | 56 | 210 | 26.7 | $38,056 | 12.8 | 10.5 | 0.2 | 0.8 | 0.8 | |
| 93226 / Glennville / CA / 28.5 mi. | 42 | 118 | 35.6 | $37,083 | 18.9 | 3.9 | 0.4 | 2.5 | 3.2 | |
| 93560 / Willow Springs / CA / 52 mi. | 40 | 5,210 | 0.8 | $42,029 | 39.1 | 25.7 | 6.3 | 0.9 | 3.0 | |
| 93527 / Pearsonville / CA / 65.5 mi. | 37 | 926 | 4.0 | $37,361 | 13.2 | 6.2 | 0.4 | 1.9 | 1.5 | |
| 93251 / McKittrick / CA / 34.9 mi. | 36 | 104 | 34.6 | $53,750 | 17.6 | 14.9 | 0.0 | 0.0 | 0.3 | |
| 93562 / Trona / CA / 89.2 mi. | 35 | 785 | 4.5 | $35,952 | 22.1 | 15.4 | 1.5 | 1.4 | 1.1 | |
| 93254 / New Cuyama / CA / 44 mi. | 34 | 273 | 12.5 | $36,500 | 44.1 | 41.0 | 0.4 | 1.0 | 0.3 | |
| 93255 / Onyx / CA / 48.4 mi. | 24 | 279 | 8.6 | $17,171 | 13.3 | 4.6 | 0.0 | 3.4 | 0.0 | |
| 93261 / Richgrove / CA / 27.6 mi. | 23 | 619 | 3.7 | $22,011 | 97.4 | 91.4 | 0.0 | 0.2 | 5.4 | |
| File | ca_the_bakersfield_californian | |||||||||
| Time | 5/20/05 5:49 PM | |||||||||
| Page | 167 | |||||||||
| Member | 101350 | |||||||||