
|
| Comparing the racial diversity of the journalists | ||||||||||
| at America's daily newspapers | ||||||||||
| with the communities that they serve | ||||||||||
| Newsroom diversity report for | ||||||||||
| San Gabriel Valley Newspaper Group, West Covina | ||||||||||
| West Covina, California | ||||||||||
| Owner: MediaNews Group (Colo.) | ||||||||||
| From a report for the Knight Foundation | ||||||||||
| by Bill Dedman and Stephen K. Doig, June 2005 | ||||||||||
| Click here to read the national report or to select another newspaper | ||||||||||
| Year | Non-white % of newsroom staff | 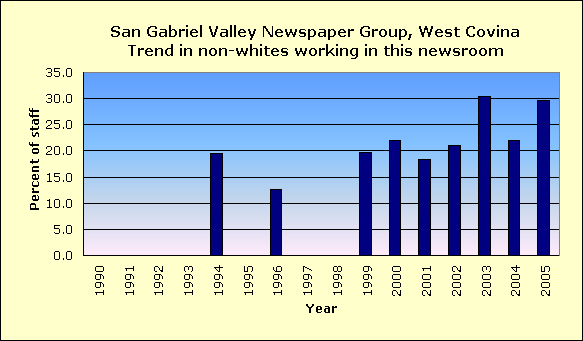
|
||||||||
| 2005 | 29.7 | |||||||||
| 2004 | 21.9 | |||||||||
| 2003 | 30.4 | |||||||||
| 2002 | 21.0 | |||||||||
| 2001 | 18.4 | |||||||||
| 2000 | 22.0 | |||||||||
| 1999 | 19.7 | |||||||||
| 1998 | Did not report | |||||||||
| 1997 | Did not report | |||||||||
| 1996 | 12.6 | |||||||||
| 1995 | Did not report | |||||||||
| 1994 | 19.5 | |||||||||
| 1993 | Did not report | |||||||||
| 1992 | Did not report | |||||||||
| 1991 | Did not report | |||||||||
| 1990 | Did not report | |||||||||
| The latest year at peak is | 2003 | |||||||||
| See the notes and definitions section below for the sources of these figures. | ||||||||||
| Newsroom Diversity Index | ||||||||||
| for San Gabriel Valley Newspaper Group, West Covina | ||||||||||
 |
||||||||||
| Year | Non-white % of newsroom staff | Non-white % of circulation area | Newsroom Diversity Index (parity=100) | |||||||
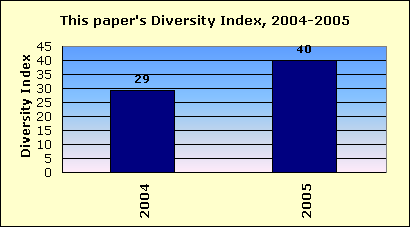
| 2005 | 29.7 | 74.3 | 40 | |||||||
| 2004 | 21.9 | 75.0 | 29 | |||||||
| How the index is calculated | ||||||||||
| The Newsroom Diversity Index is the non-white percentage of the newsroom staff | ||||||||||
| divided by the non-white percentage of residents in the circulation area. | ||||||||||
| (Parity = 100.) | ||||||||||
| Company index | ||||||||||
| This newspaper's owner, MediaNews Group (Colo.), | ||||||||||
| has a companywide, circulation-weighted Diversity Index of 47. | ||||||||||
| See the notes and definitions section below for the sources of these figures. | ||||||||||
| Peer group comparison | ||||||||||
| for San Gabriel Valley Newspaper Group, West Covina | ||||||||||
 |
||||||||||
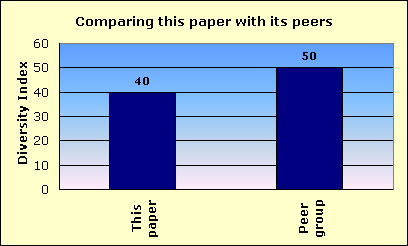
| This newspaper's Newsroom Diversity Index is 40. | This paper | |||||||||
| Peer group | ||||||||||
| Compare that with 50, which is the median Diversity Index for all newspapers | ||||||||||
| reporting in this circulation category of 50,001 to 100,000 daily sales. | ||||||||||
| In that group, this newspaper's Diversity Index ranks 56 out of 90 | ||||||||||
| newspapers reporting in the category of 50,001 to 100,000 daily sales. | ||||||||||
| An example of a newspaper of similar circulation, in an area of similar level of non-white residents, but one that has a relatively high Diversity Index, is El Paso Times, Texas, with a 60 percent non-white staff in a community that is 81.4 percent non-white. Its index is 74. | ||||||||||
| FYI, in circulation, this newspaper's average weekday circulation of | ||||||||||
| approximately 98,905 ranks 104 out of 1,410 daily newspapers in the US. | ||||||||||
| See the notes and definitions section below for the sources of these figures. | ||||||||||
| Details on race/ethnicity | ||||||||||
| in the circulation area | ||||||||||
| and the home county | ||||||||||
| of San Gabriel Valley Newspaper Group, West Covina | ||||||||||
| Circulation area | ||||||||||
| Race/ethnicity | % of population | Number of residents | 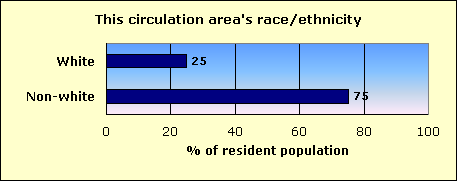
|
|||||||
| Hispanic | 57.8 | 412,242 | ||||||||
| Black | 2.3 | 16,255 | ||||||||
| Asian and Pacific Islander | 12.9 | 92,237 | ||||||||
| Native-American | 0.3 | 2,297 | ||||||||
| Other non-white | 0.1 | 908 | ||||||||
| Multi-racial | 1.5 | 10,969 | ||||||||
| Non-white | 75.0 | 534,908 | ||||||||
| White | 25.0 | 178,083 | ||||||||
| Total | 712,991 | |||||||||
| Home county: Los Angeles | ||||||||||
| Race/ethnicity | % of population | Number of residents | 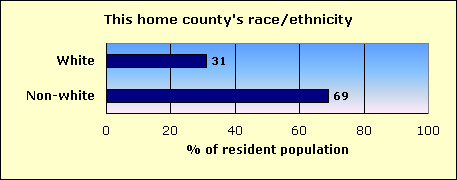
|
|||||||
| Hispanic | 44.6 | 4,242,213 | ||||||||
| Black | 9.5 | 901,472 | ||||||||
| Asian and Pacific Islander | 12.1 | 1,147,834 | ||||||||
| Native-American | 0.3 | 25,609 | ||||||||
| Other non-white | 0.2 | 19,935 | ||||||||
| Multi-racial | 2.3 | 222,661 | ||||||||
| Non-white | 68.9 | 6,559,724 | ||||||||
| White | 31.1 | 2,959,614 | ||||||||
| Total | 9,519,338 | |||||||||
| The home county of this newspaper is Los Angeles. | ||||||||||
| About this report | ||||||||||
| This third annual report for the Knight Foundation adds context to an annual survey by the American Society of Newspaper Editors. ASNE has set a goal that | ||||||||||
| every newspaper, to help it know its community and gather the news, should employ at least one non-white journalist, and that newspapers should strive to | ||||||||||
| employ non-whites in proportion to their share of the community. ASNE's report, at www.asne.org, shows each newspaper's non-white employment, but does | ||||||||||
| not disclose how closely that employment mirrors the newspaper's circulation area. | ||||||||||
| That gap is filled by the report you are reading now. This report was not done by ASNE, but was done for the Knight Foundation by Bill Dedman and | ||||||||||
| Stephen K. Doig. It shows how close each newspaper is to ASNE's goal, by comparing the newsroom staffing with the circulation area population. | ||||||||||
| The full report is at www.powerreporting.com/knight. | ||||||||||
| Notes and definitions | ||||||||||
| 1. The Newsroom Diversity Index is the non-white percentage of the newsroom staff divided by the non-white percentage of the circulation area's residents. Parity = 100. | ||||||||||
| 2. Source for staffing: Survey by American Society of Newspaper Editors, April 2005. Newspapers report non-white staff as of the end of the previous year. | ||||||||||
| 3. Following ASNE's definition, newsroom staff includes only supervisors, reporters, editors, copy/layout editors and photographers. | ||||||||||
| 4. Also following ASNE's definition, "whites," "blacks," etc., exclude Hispanics, who are counted in a separate category. | ||||||||||
| 5. Source for boundaries of this newspaper's circulation area: ZIP Code circulation data, Audit Bureau of Circulations, latest available. | ||||||||||
| 6. A paper may define its circulation area differently for marketing efforts, or news coverage, or to set advertising rates. | ||||||||||
| 7. If ZIP Codes or counties are used, this report applies a threshold: 10 percent household penetration is required to include an area in the circulation area. | ||||||||||
| 8. Source for the demographics of residents of that circulation area: US Census 2000. | ||||||||||
| 9. Source for total circulation: Editor & Publisher magazine, Monday-Friday average at year-end 2004. | ||||||||||
| 10. Staff of non-English publications, such as the Miami Herald's El Nuevo Herald, are excluded from the ASNE staffing survey for the first time this year. | ||||||||||
| Demographics of ZIP Codes | ||||||||||
| where sales were reported by | ||||||||||
| San Gabriel Valley Newspaper Group, West Covina | ||||||||||
| Note that some ZIP Codes listed here may not have been included in determining the newspaper's circulation area. In calculating the Diversity Index, a | ||||||||||
| ZIP Code was included only if the household penetration was at least 10 percent. Any lower-penetration ZIP Codes are also listed here for your information. | ||||||||||
| Also, if the newspaper reported more than 300 ZIP Codes, only the top 300 in weekday sales are listed here. | ||||||||||
| ZIP / City / State / Approx. distance in miles from the newspaper's home office | Weekday sales | Households | Penetration % (daily sales per 100 households) | Median household income | Non-white % of population |
Hispanic % of population |
Black % of population |
Native % of population |
Asian % of population |
|
| 91011 / La Canada Flintr / CA / 17.3 mi. | 4,034 | 6,851 | 58.9 | $109,802 | 28.5 | 4.8 | 0.3 | 0.1 | 20.3 | |
| 91706 / Irwindale / CA / 3.6 mi. | 3,894 | 17,235 | 22.6 | $41,621 | 92.7 | 78.8 | 1.4 | 0.3 | 11.4 | |
| 91790 / West Covina / CA / 2.7 mi. | 3,872 | 12,853 | 30.1 | $50,825 | 75.5 | 52.6 | 4.4 | 0.3 | 16.1 | |
| 90601 / Whittier / CA / 9.2 mi. | 3,152 | 11,202 | 28.1 | $52,800 | 71.0 | 62.1 | 0.9 | 0.4 | 5.7 | |
| 90041 / Los Angeles / CA / 16.3 mi. | 3,129 | 9,375 | 33.4 | $48,439 | 69.6 | 38.6 | 2.0 | 0.4 | 25.4 | |
| 91744 / La Puente / CA / 4.7 mi. | 3,106 | 18,468 | 16.8 | $46,792 | 91.8 | 81.3 | 1.9 | 0.3 | 7.2 | |
| 91103 / Pasadena / CA / 14.6 mi. | 2,933 | 8,017 | 36.6 | $34,824 | 83.8 | 50.1 | 26.7 | 0.2 | 4.7 | |
| 91741 / Glendora / CA / 4.1 mi. | 2,873 | 8,730 | 32.9 | $67,419 | 22.9 | 14.9 | 0.8 | 0.3 | 4.9 | |
| 91722 / Covina / CA / 0 mi. | 2,633 | 10,226 | 25.7 | $50,126 | 66.7 | 50.1 | 4.4 | 0.3 | 9.7 | |
| 91773 / San Dimas / CA / 4.6 mi. | 2,420 | 11,602 | 20.9 | $63,526 | 39.2 | 23.4 | 3.2 | 0.4 | 9.7 | |
| 91702 / Azusa / CA / 1.9 mi. | 2,414 | 15,333 | 15.7 | $42,108 | 77.3 | 66.0 | 3.2 | 0.4 | 5.8 | |
| 90660 / Pico Rivera / CA / 12.2 mi. | 2,376 | 16,425 | 14.5 | $41,491 | 92.3 | 88.3 | 0.5 | 0.3 | 2.5 | |
| 91724 / Covina / CA / 2.4 mi. | 2,362 | 8,338 | 28.3 | $59,158 | 51.9 | 34.4 | 3.9 | 0.5 | 10.5 | |
| 91006 / Arcadia / CA / 6.9 mi. | 2,233 | 10,478 | 21.3 | $58,779 | 58.2 | 13.0 | 0.9 | 0.2 | 41.5 | |
| 90042 / Los Angeles / CA / 15.5 mi. | 2,199 | 19,592 | 11.2 | $36,064 | 87.2 | 70.2 | 2.7 | 0.5 | 12.2 | |
| 91016 / Monrovia / CA / 6 mi. | 2,181 | 14,707 | 14.8 | $46,468 | 53.3 | 35.3 | 8.0 | 0.3 | 7.1 | |
| 91745 / La Puente / CA / 7.2 mi. | 2,178 | 16,099 | 13.5 | $59,642 | 77.8 | 38.0 | 1.4 | 0.3 | 36.0 | |
| 91740 / Glendora / CA / 2.7 mi. | 2,136 | 8,316 | 25.7 | $52,696 | 40.9 | 28.4 | 2.0 | 0.4 | 7.2 | |
| 90602 / Whittier / CA / 10.6 mi. | 2,083 | 8,195 | 25.4 | $40,695 | 74.2 | 68.4 | 1.1 | 0.5 | 2.7 | |
| 91010 / Irwindale / CA / 4.3 mi. | 2,066 | 8,098 | 25.5 | $50,634 | 70.5 | 47.2 | 9.8 | 0.4 | 10.8 | |
| 91791 / West Covina / CA / 2.2 mi. | 2,057 | 9,762 | 21.1 | $56,216 | 68.5 | 40.2 | 5.4 | 0.3 | 20.0 | |
| 91723 / Covina / CA / 1.1 mi. | 1,984 | 6,251 | 31.7 | $42,100 | 56.5 | 41.4 | 4.5 | 0.4 | 7.7 | |
| 91101 / Pasadena / CA / 13 mi. | 1,976 | 8,759 | 22.6 | $38,187 | 59.0 | 29.2 | 11.7 | 0.3 | 14.6 | |
| 91024 / Sierra Madre / CA / 9.1 mi. | 1,974 | 4,746 | 41.6 | $65,862 | 20.3 | 10.0 | 1.1 | 0.2 | 5.7 | |
| 91770 / South San Gabrie / CA / 9.8 mi. | 1,889 | 16,112 | 11.7 | $37,896 | 91.8 | 42.1 | 0.5 | 0.2 | 47.6 | |
| 91732 / El Monte / CA / 6.1 mi. | 1,869 | 14,473 | 12.9 | $34,141 | 91.9 | 71.5 | 0.6 | 0.3 | 18.5 | |
| 90606 / Whittier / CA / 11.5 mi. | 1,745 | 8,503 | 20.5 | $44,440 | 85.9 | 82.1 | 1.0 | 0.3 | 1.6 | |
| 90605 / Whittier / CA / 11.2 mi. | 1,738 | 10,132 | 17.2 | $50,630 | 74.9 | 69.5 | 0.9 | 0.3 | 2.7 | |
| 91750 / La Verne / CA / 7.3 mi. | 1,723 | 12,557 | 13.7 | $60,366 | 36.6 | 23.5 | 3.4 | 0.4 | 6.8 | |
| 90301 / Inglewood / CA / 25.4 mi. | 1,592 | 11,981 | 13.3 | $31,306 | 95.2 | 57.3 | 34.3 | 0.2 | 1.8 | |
| 91746 / La Puente / CA / 5.2 mi. | 1,571 | 6,791 | 23.1 | $44,189 | 92.4 | 82.5 | 1.6 | 0.3 | 7.2 | |
| 90604 / Whittier / CA / 12.1 mi. | 1,508 | 11,737 | 12.8 | $49,836 | 61.7 | 54.5 | 1.3 | 0.3 | 3.7 | |
| 90603 / Whittier / CA / 10.9 mi. | 1,488 | 6,732 | 22.1 | $59,328 | 41.8 | 34.7 | 0.5 | 0.4 | 4.5 | |
| 91731 / El Monte / CA / 7.5 mi. | 1,474 | 7,605 | 19.4 | $30,942 | 92.0 | 72.7 | 0.7 | 0.3 | 17.2 | |
| 90631 / La Habra Heights / CA / 10.9 mi. | 1,461 | 21,720 | 6.7 | $50,666 | 56.0 | 45.4 | 1.3 | 0.3 | 6.9 | |
| 91776 / San Gabriel / CA / 10.2 mi. | 1,429 | 11,634 | 12.3 | $38,085 | 87.9 | 34.2 | 1.1 | 0.3 | 50.4 | |
| 91030 / South Pasadena / CA / 13.6 mi. | 1,348 | 10,352 | 13.0 | $55,701 | 49.1 | 16.1 | 2.9 | 0.1 | 26.5 | |
| 91801 / Alhambra / CA / 12.2 mi. | 1,216 | 19,405 | 6.3 | $38,229 | 85.6 | 33.1 | 1.5 | 0.2 | 48.6 | |
| 91733 / South El Monte / CA / 8 mi. | 1,162 | 9,861 | 11.8 | $32,644 | 95.3 | 80.1 | 0.2 | 0.2 | 14.2 | |
| 91789 / Walnut / CA / 5.7 mi. | 1,125 | 12,986 | 8.7 | $73,943 | 78.8 | 20.0 | 3.9 | 0.1 | 52.0 | |
| 91754 / Monterey Park / CA / 13.4 mi. | 1,078 | 11,258 | 9.6 | $40,267 | 92.3 | 31.3 | 0.3 | 0.2 | 58.6 | |
| 91007 / Arcadia / CA / 8.2 mi. | 1,015 | 11,368 | 8.9 | $51,255 | 58.9 | 10.5 | 1.2 | 0.1 | 44.4 | |
| 91748 / Rowland Heights / CA / 7.4 mi. | 1,005 | 13,456 | 7.5 | $51,640 | 84.9 | 28.4 | 2.3 | 0.1 | 51.6 | |
| 90638 / Mirada / CA / 13.5 mi. | 987 | 14,815 | 6.7 | $61,724 | 52.9 | 33.4 | 1.8 | 0.3 | 15.1 | |
| 90640 / Montebello / CA / 12.3 mi. | 792 | 18,933 | 4.2 | $38,773 | 88.9 | 74.5 | 0.6 | 0.2 | 11.5 | |
| 91105 / Pasadena / CA / 14.4 mi. | 745 | 4,632 | 16.1 | $83,737 | 27.2 | 11.6 | 3.8 | 0.2 | 8.8 | |
| 91792 / West Covina / CA / 4.2 mi. | 735 | 8,975 | 8.2 | $54,074 | 88.1 | 41.9 | 8.7 | 0.3 | 34.3 | |
| 91775 / San Gabriel / CA / 10 mi. | 708 | 8,321 | 8.5 | $56,657 | 64.7 | 22.1 | 1.3 | 0.2 | 38.5 | |
| 91803 / Alhambra / CA / 13.1 mi. | 696 | 9,693 | 7.2 | $41,303 | 87.2 | 39.9 | 0.9 | 0.2 | 44.5 | |
| 90650 / Norwalk / CA / 15.4 mi. | 577 | 26,860 | 2.1 | $46,012 | 81.1 | 62.9 | 4.4 | 0.5 | 11.7 | |
| 90022 / Los Angeles / CA / 14.2 mi. | 535 | 17,150 | 3.1 | $27,471 | 97.8 | 96.3 | 0.3 | 0.3 | 0.7 | |
| 90670 / Santa Fe Springs / CA / 13.7 mi. | 533 | 4,555 | 11.7 | $46,061 | 79.8 | 70.1 | 3.8 | 0.5 | 4.0 | |
| 91765 / Pomona / CA / 7.7 mi. | 525 | 14,662 | 3.6 | $69,848 | 67.9 | 17.7 | 4.9 | 0.2 | 42.0 | |
| 90020 / Sanford / CA / 21.9 mi. | 490 | 16,932 | 2.9 | $24,208 | 90.3 | 38.2 | 6.7 | 0.2 | 43.0 | |
| 90021 / Market / CA / 18.6 mi. | 444 | 1,313 | 33.8 | $13,053 | 88.3 | 53.5 | 26.8 | 0.9 | 5.3 | |
| 91701 / Rancho Cucamonga / CA / 16 mi. | 439 | 12,609 | 3.5 | $66,668 | 38.0 | 22.0 | 5.7 | 0.3 | 6.7 | |
| 90023 / Lugo / CA / 16.6 mi. | 405 | 10,755 | 3.8 | $26,884 | 98.5 | 97.2 | 0.2 | 0.2 | 0.7 | |
| 91710 / Chino / CA / 12.8 mi. | 386 | 19,015 | 2.0 | $55,185 | 61.3 | 46.4 | 7.7 | 0.4 | 4.8 | |
| 91001 / Altadena / CA / 14 mi. | 353 | 12,379 | 2.9 | $63,543 | 66.1 | 22.4 | 35.9 | 0.3 | 3.6 | |
| 91768 / Pomona / CA / 7 mi. | 252 | 8,448 | 3.0 | $35,733 | 80.8 | 63.7 | 8.4 | 0.4 | 6.6 | |
| 91780 / Temple City / CA / 8.4 mi. | 243 | 11,247 | 2.2 | $47,575 | 63.1 | 22.4 | 0.9 | 0.1 | 37.5 | |
| 91766 / Pomona / CA / 8.4 mi. | 185 | 16,979 | 1.1 | $41,876 | 87.1 | 69.8 | 6.5 | 0.3 | 8.9 | |
| 90032 / Los Angeles / CA / 14.6 mi. | 146 | 12,596 | 1.2 | $33,445 | 95.5 | 80.3 | 2.1 | 0.4 | 11.7 | |
| 91711 / Claremont / CA / 9.9 mi. | 146 | 11,449 | 1.3 | $66,663 | 34.9 | 15.4 | 4.8 | 0.2 | 11.4 | |
| 90012 / Los Angeles / CA / 18 mi. | 139 | 7,840 | 1.8 | $20,152 | 86.7 | 30.1 | 16.2 | 0.2 | 38.9 | |
| 91767 / Pomona / CA / 8.7 mi. | 126 | 13,049 | 1.0 | $40,057 | 79.3 | 58.5 | 13.6 | 0.4 | 4.9 | |
| 91504 / Burbank / CA / 23.8 mi. | 124 | 9,595 | 1.3 | $55,813 | 44.1 | 27.2 | 1.9 | 0.2 | 10.5 | |
| 91761 / Ontario / CA / 16.3 mi. | 93 | 14,941 | 0.6 | $49,430 | 73.3 | 57.1 | 8.8 | 0.3 | 5.2 | |
| 91709 / Chino Hills / CA / 11.4 mi. | 82 | 20,026 | 0.4 | $78,336 | 56.3 | 25.7 | 5.4 | 0.3 | 22.0 | |
| 90240 / Downey / CA / 14.6 mi. | 67 | 7,860 | 0.9 | $55,492 | 67.2 | 53.0 | 1.7 | 0.3 | 10.2 | |
| 91730 / Rancho Cucamonga / CA / 16.7 mi. | 57 | 16,665 | 0.3 | $50,047 | 54.3 | 35.7 | 9.6 | 0.4 | 5.3 | |
| 90019 / Rimpau / CA / 23.6 mi. | 49 | 23,816 | 0.2 | $31,501 | 91.3 | 44.1 | 31.6 | 0.2 | 12.7 | |
| 91763 / Montclair / CA / 11 mi. | 43 | 9,176 | 0.5 | $40,230 | 76.4 | 60.3 | 5.8 | 0.4 | 8.0 | |
| 91784 / Upland / CA / 12.9 mi. | 36 | 7,998 | 0.5 | $81,460 | 29.0 | 13.3 | 3.8 | 0.2 | 9.1 | |
| 90018 / Los Angeles / CA / 22.6 mi. | 27 | 15,215 | 0.2 | $23,797 | 97.3 | 49.2 | 42.6 | 0.2 | 3.0 | |
| 91106 / Pasadena / CA / 12.3 mi. | 24 | 10,532 | 0.2 | $46,617 | 54.3 | 25.5 | 9.1 | 0.2 | 16.0 | |
| 91108 / San Marino / CA / 11.5 mi. | 19 | 4,353 | 0.4 | $119,147 | 54.7 | 4.4 | 0.2 | 0.0 | 47.7 | |
| File | ca_san_gabriel_valley_newspaper_group__west_covina | |||||||||
| Time | 5/17/05 5:26 PM | |||||||||
| Page | 104 | |||||||||
| Member | 105300 | |||||||||